End Market Analysis of Ethiopian Livestock and ... - USAID Microlinks
End Market Analysis of Ethiopian Livestock and ... - USAID Microlinks
End Market Analysis of Ethiopian Livestock and ... - USAID Microlinks

Create successful ePaper yourself
Turn your PDF publications into a flip-book with our unique Google optimized e-Paper software.
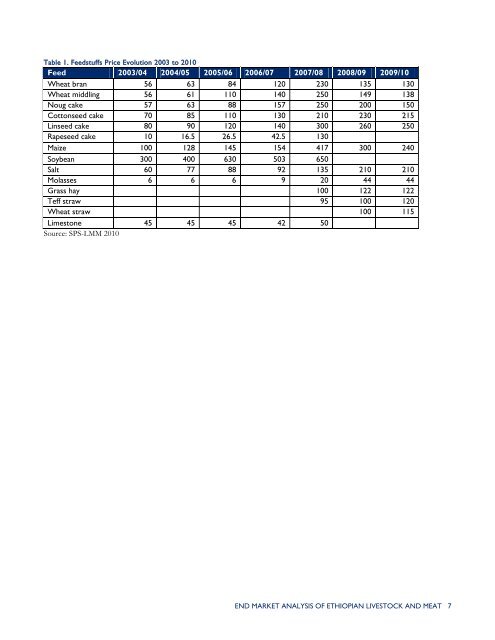
Table 1. Feedstuffs Price Evolution 2003 to 2010<br />
Feed 2003/04 2004/05 2005/06 2006/07 2007/08 2008/09 2009/10<br />
Wheat bran 56 63 84 120 230 135 130<br />
Wheat middling 56 61 110 140 250 149 138<br />
Noug cake 57 63 88 157 250 200 150<br />
Cottonseed cake 70 85 110 130 210 230 215<br />
Linseed cake 80 90 120 140 300 260 250<br />
Rapeseed cake 10 16.5 26.5 42.5 130<br />
Maize 100 128 145 154 417 300 240<br />
Soybean 300 400 630 503 650<br />
Salt 60 77 88 92 135 210 210<br />
Molasses 6 6 6 9 20 44 44<br />
Grass hay 100 122 122<br />
Teff straw 95 100 120<br />
Wheat straw 100 115<br />
Limestone 45 45 45 42 50<br />
Source: SPS-LMM 2010<br />
END MARKET ANALYSIS OF ETHIOPIAN LIVESTOCK AND MEAT 7