End Market Analysis of Ethiopian Livestock and ... - USAID Microlinks
End Market Analysis of Ethiopian Livestock and ... - USAID Microlinks
End Market Analysis of Ethiopian Livestock and ... - USAID Microlinks

Create successful ePaper yourself
Turn your PDF publications into a flip-book with our unique Google optimized e-Paper software.
Pastoral households, which depend on livestock for their livelihoods, own relatively more livestock—Borena<br />
pastoralists, for instance, own an average <strong>of</strong> 13 head <strong>of</strong> cattle, five goats <strong>and</strong> two sheep. 22<br />
Although the majority <strong>of</strong> Ethiopia’s livestock is found in the highl<strong>and</strong>s, 95 percent <strong>of</strong> the livestock supplied for export<br />
is supplied by the pastoral <strong>and</strong> agro-pastoral areas <strong>of</strong> Afar, Somali <strong>and</strong> Borena. A large percentage <strong>of</strong> the cattle <strong>and</strong><br />
beef meat exported from Ethiopia originates in Borena, <strong>and</strong> this area stages a fierce purchasing competition between<br />
live animal <strong>and</strong> meat exporters. 23 This is likely due in large part to consumer preferences for Boran cattle <strong>and</strong> is<br />
facilitated by Borena Zone’s relative ease <strong>of</strong> access from the feedlots <strong>and</strong> abattoirs in Adama (Nazreth), Modjo <strong>and</strong><br />
Bish<strong>of</strong>tu (Debre Zeit). In 2007, the SPS-LMM program found that on 180 feedlot centers in Oromiya, all 20,500 cattle<br />
were sourced in southern (e.g. Borena) or southeastern rangel<strong>and</strong>s. 24 Many <strong>of</strong> the sheep <strong>and</strong> goats exported from<br />
Ethiopia are lowl<strong>and</strong> breeds from Somali <strong>and</strong> Afar. These have a relatively low dressing weight (8-10 kg per animal,<br />
compared to 16-20 kg in neighboring countries). 25<br />
Reasons for sale vary across regions <strong>and</strong> across households. For non-pastoral households, a large proportion <strong>of</strong> sales<br />
(up to 75 percent, according to ILRI researchers Asfaw Negassa <strong>and</strong> Mohammad Jabbar) are <strong>of</strong> non-productive<br />
animals such as older draught oxen. The periodic need for cash may lead a household to sell an animal, usually a<br />
shoat, <strong>and</strong> the decision <strong>of</strong> when <strong>and</strong> where to sell is generally informed by the limited market information available to<br />
the seller. In some instances, fear <strong>of</strong> theft plays a role. For pastoralist households, seasonality is an important factor as<br />
rangel<strong>and</strong>s can support fewer animals during the dry season, leading owners to sell livestock during the dry season <strong>and</strong><br />
keep them during the wet season. Pastoralist households sell small ruminants to obtain cash for grain purchases or<br />
other expenditures. Somali households seem to be more market-oriented than other pastoralist households, with a<br />
good knowledge <strong>of</strong> markets in cross-border areas <strong>of</strong> Somalil<strong>and</strong> <strong>and</strong> Somalia.<br />
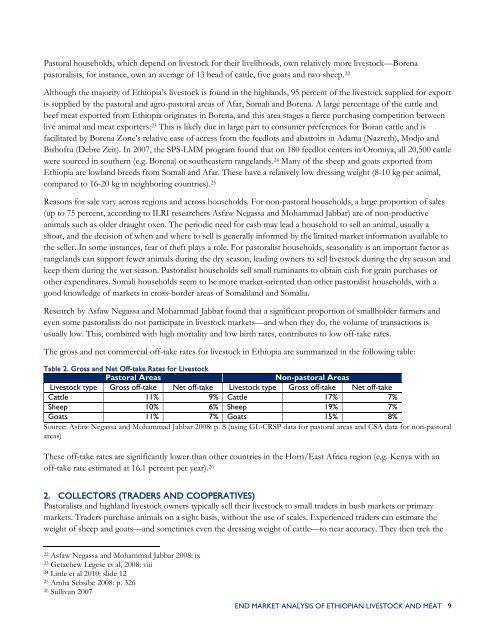
Research by Asfaw Negassa <strong>and</strong> Mohammad Jabbar found that a significant proportion <strong>of</strong> smallholder farmers <strong>and</strong><br />
even some pastoralists do not participate in livestock markets—<strong>and</strong> when they do, the volume <strong>of</strong> transactions is<br />
usually low. This, combined with high mortality <strong>and</strong> low birth rates, contributes to low <strong>of</strong>f-take rates.<br />
The gross <strong>and</strong> net commercial <strong>of</strong>f-take rates for livestock in Ethiopia are summarized in the following table:<br />
Table 2. Gross <strong>and</strong> Net Off-take Rates for <strong>Livestock</strong><br />
Pastoral Areas Non-pastoral Areas<br />
<strong>Livestock</strong> type Gross <strong>of</strong>f-take Net <strong>of</strong>f-take <strong>Livestock</strong> type Gross <strong>of</strong>f-take Net <strong>of</strong>f-take<br />
Cattle 11% 9% Cattle 17% 7%<br />
Sheep 10% 6% Sheep 19% 7%<br />
Goats 11% 7% Goats 15% 8%<br />
Source: Asfaw Negassa <strong>and</strong> Mohammad Jabbar 2008: p. 8 (using GL-CRSP data for pastoral areas <strong>and</strong> CSA data for non-pastoral<br />
areas)<br />
These <strong>of</strong>f-take rates are significantly lower than other countries in the Horn/East Africa region (e.g. Kenya with an<br />
<strong>of</strong>f-take rate estimated at 16.1 percent per year). 26<br />
2. COLLECTORS (TRADERS AND COOPERATIVES)<br />
Pastoralists <strong>and</strong> highl<strong>and</strong> livestock owners typically sell their livestock to small traders in bush markets or primary<br />
markets. Traders purchase animals on a sight basis, without the use <strong>of</strong> scales. Experienced traders can estimate the<br />
weight <strong>of</strong> sheep <strong>and</strong> goats—<strong>and</strong> sometimes even the dressing weight <strong>of</strong> cattle—to near accuracy. They then trek the<br />
22 Asfaw Negassa <strong>and</strong> Mohammad Jabbar 2008: ix<br />
23 Getachew Legese et al, 2008: viii<br />
24 Little et al 2010: slide 12<br />
25 Amha Sebsibe 2008: p. 326<br />
26 Sullivan 2007<br />
END MARKET ANALYSIS OF ETHIOPIAN LIVESTOCK AND MEAT 9