Smooth Bottom Net Trawl Fishing Gear Effect on - New England ...
Smooth Bottom Net Trawl Fishing Gear Effect on - New England ...
Smooth Bottom Net Trawl Fishing Gear Effect on - New England ...

Create successful ePaper yourself
Turn your PDF publications into a flip-book with our unique Google optimized e-Paper software.
NOAA/NMFS Unallied Science Project, Cooperative Agreement NA16FL2264 May 2005<br />
<str<strong>on</strong>g>Smooth</str<strong>on</strong>g> <str<strong>on</strong>g>Bottom</str<strong>on</strong>g> <str<strong>on</strong>g>Net</str<strong>on</strong>g> <str<strong>on</strong>g>Trawl</str<strong>on</strong>g> <str<strong>on</strong>g>Fishing</str<strong>on</strong>g> <str<strong>on</strong>g>Gear</str<strong>on</strong>g> <str<strong>on</strong>g>Effect</str<strong>on</strong>g> <strong>on</strong> the Seabed:<br />
Investigati<strong>on</strong> of Temporal and Cumulative <str<strong>on</strong>g>Effect</str<strong>on</strong>g>s BKAM/CR<br />
Both n<strong>on</strong>-projected ‘raw’ s<strong>on</strong>ar data and geographically referenced data were inspected to meet<br />
these goals. Geo-referenced side-scan s<strong>on</strong>ar imagery was imported to ArcView GIS for detailed<br />
inspecti<strong>on</strong>. Data layers representing video drifts (Secti<strong>on</strong> 3.3), benthic grab samples (Secti<strong>on</strong><br />
3.4) and SPI observati<strong>on</strong> points (Secti<strong>on</strong> 3.5) were added to the GIS project to aid interpretati<strong>on</strong>.<br />
The high-resoluti<strong>on</strong> n<strong>on</strong>-projected “waterfall” side-scan imagery often provides clearer bottom<br />
imagery, and was closely inspected.<br />
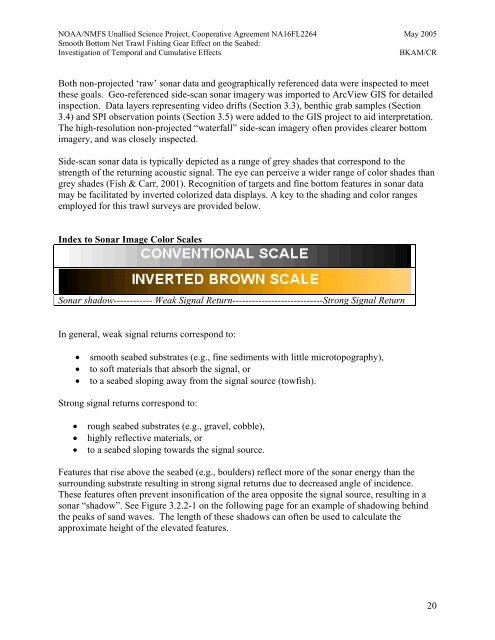
Side-scan s<strong>on</strong>ar data is typically depicted as a range of grey shades that corresp<strong>on</strong>d to the<br />
strength of the returning acoustic signal. The eye can perceive a wider range of color shades than<br />
grey shades (Fish & Carr, 2001). Recogniti<strong>on</strong> of targets and fine bottom features in s<strong>on</strong>ar data<br />
may be facilitated by inverted colorized data displays. A key to the shading and color ranges<br />
employed for this trawl surveys are provided below.<br />
Index to S<strong>on</strong>ar Image Color Scales<br />
S<strong>on</strong>ar shadow------------ Weak Signal Return----------------------------Str<strong>on</strong>g Signal Return<br />
In general, weak signal returns corresp<strong>on</strong>d to:<br />
• smooth seabed substrates (e.g., fine sediments with little microtopography),<br />
• to soft materials that absorb the signal, or<br />
• to a seabed sloping away from the signal source (towfish).<br />
Str<strong>on</strong>g signal returns corresp<strong>on</strong>d to:<br />
• rough seabed substrates (e.g., gravel, cobble),<br />
• highly reflective materials, or<br />
• to a seabed sloping towards the signal source.<br />
Features that rise above the seabed (e.g., boulders) reflect more of the s<strong>on</strong>ar energy than the<br />
surrounding substrate resulting in str<strong>on</strong>g signal returns due to decreased angle of incidence.<br />
These features often prevent ins<strong>on</strong>ificati<strong>on</strong> of the area opposite the signal source, resulting in a<br />
s<strong>on</strong>ar “shadow”. See Figure 3.2.2-1 <strong>on</strong> the following page for an example of shadowing behind<br />
the peaks of sand waves. The length of these shadows can often be used to calculate the<br />
approximate height of the elevated features.<br />
20