worksheet and assessment card masters - National STEM Centre
worksheet and assessment card masters - National STEM Centre
worksheet and assessment card masters - National STEM Centre

Create successful ePaper yourself
Turn your PDF publications into a flip-book with our unique Google optimized e-Paper software.
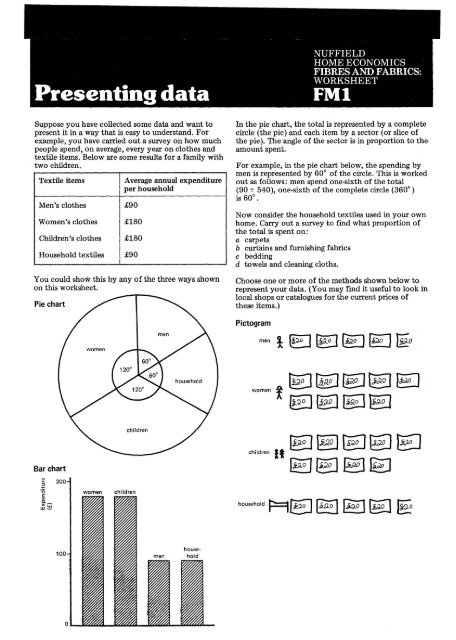
Suppose you have collected some data <strong>and</strong> want to<br />
present it in a way that is easy to underst<strong>and</strong>. For<br />
example, you have carried out a survey on how much<br />
people spend, on average, every year on clothes <strong>and</strong><br />
textile items. Below are some results for a family with<br />
two children.<br />
Textile items Average annual expenditure<br />
per household<br />
Men's clothes £90<br />
Women's clothes £180<br />
Children's clothes £180<br />
Household textiles £90<br />
You could show this by any of the three ways shown<br />
on this <strong>worksheet</strong>.<br />
Pie chart<br />
100<br />
a<br />
women<br />
children<br />
In the pie chart, the total is represented by a complete<br />
circle (the pie) <strong>and</strong> each item by a sector (or slice of<br />
the pie). The angle of the sector is in proportion to theamount<br />
spent.<br />
For example, in the pie chart below, the spending by<br />
men is represented by 60° of the circle. This is worked<br />
out as follows: men spend one-sixth of the total<br />
(90 -;.540), one-sixth of the complete circle (360°)<br />
is 60°.<br />
Now consider the household textiles used in your own<br />
home. Carry out a survey to find what proportion of<br />
the total is spent on:<br />
a carpets<br />
b curtains <strong>and</strong> furnishing fabrics<br />
c bedding<br />
d towels <strong>and</strong> cleaning cloths.<br />
Choose one or more of the methods shown below to<br />
represent your data. (You may find it useful to look in<br />
local shops or catalogues for the current prices of<br />
these items.)<br />
Pictogram<br />
men 10~~~§JIio<br />
women<br />
~Ci8~~§J<br />
t §~ fell§J e2J<br />
~~~[8§J§J<br />
children It<br />
Bar chart ~eJI§JB<br />
CIl<br />
200<br />
E:0 women children<br />
c:<br />
CIl<br />
~ xw~<br />
household P=9[g ~:l§~]~ f§