Grounding Line Location using Echograms - CReSIS
Grounding Line Location using Echograms - CReSIS
Grounding Line Location using Echograms - CReSIS

You also want an ePaper? Increase the reach of your titles
YUMPU automatically turns print PDFs into web optimized ePapers that Google loves.
o How is Glacier Goo Similar to a Real Glacier?<br />
Engage (for students with some glaciology background):<br />
• Complete an Internet search for glacier and ice sheet images<br />
• Make a few predictions about glacial processes (formation, movement, etc.)<br />
Q1) Sketch a glacier and label several parts.<br />
Q2) What part of a glacier do you predict to flow the fastest? What may cause a glacier to speed up?<br />
Q3) Give an example of a method or technology that researchers use to collect data about glaciers.<br />
Explain:<br />
Explore the ‘Echogram Background’ document. Make sure you are familiar with all the necessary information.<br />
• Discuss different characteristics and features of the echogram and how to interpret.<br />
This particular echogram was from the 2003 Greenland field campaign flown over Petermann Glacier in NW Greenland.<br />
Q4) What characteristics of a glacier do you see in this echogram?<br />
Q5) Describe how are you able to identify each characteristic?<br />
Q6) Estimate the latitude and longitude of the grounding line.<br />
Q7) What direction is the platform carrying the radar flying?<br />
Explore:<br />
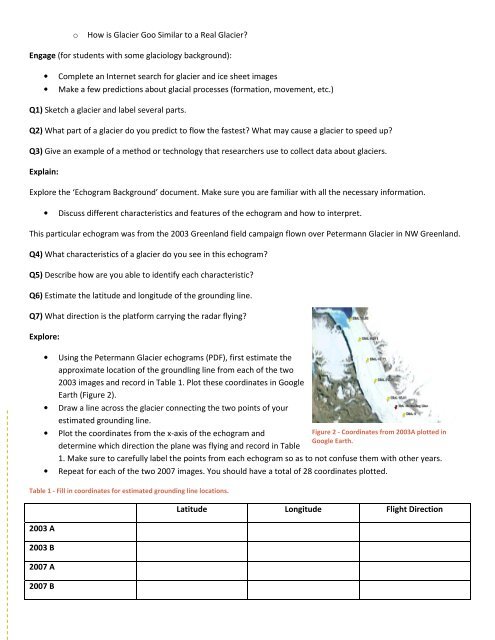
• Using the Petermann Glacier echograms (PDF), first estimate the<br />
approximate location of the groundling line from each of the two<br />
2003 images and record in Table 1. Plot these coordinates in Google<br />
Earth (Figure 2).<br />
• Draw a line across the glacier connecting the two points of your<br />
estimated grounding line.<br />
• Plot the coordinates from the x-axis of the echogram and<br />
determine which direction the plane was flying and record in Table<br />
1. Make sure to carefully label the points from each echogram so as to not confuse them with other years.<br />
• Repeat for each of the two 2007 images. You should have a total of 28 coordinates plotted.<br />
Table 1 - Fill in coordinates for estimated grounding line locations.<br />
2003 A<br />
2003 B<br />
2007 A<br />
2007 B<br />
Figure 2 - Coordinates from 2003A plotted in<br />
Google Earth.<br />
Latitude Longitude Flight Direction