Grounding Line Location using Echograms - CReSIS
Grounding Line Location using Echograms - CReSIS
Grounding Line Location using Echograms - CReSIS

You also want an ePaper? Increase the reach of your titles
YUMPU automatically turns print PDFs into web optimized ePapers that Google loves.
<strong>CReSIS</strong> measures ice sheet thickness by flying radar sensors mostly over regions of Antarctica and Greenland with the<br />
purpose of <strong>using</strong> the information to better model the amount of ice on Earth and how it changes over time. This is<br />
important in the study of glaciers, sea level rise, and climate change. <strong>CReSIS</strong> radar data are collected via airborne<br />
platforms with the radar attached to the wings and/or belly of an aircraft. Radar is an active sensor in which signals are<br />
sent out (transmitted) and returned by reflection off an object. These return signals are detected (absorbed) and<br />
processed to produce a two-dimensional image (echogram). <strong>Echograms</strong> contain data about locations and depths of<br />
bedrock or water under the surface of the ice sheets. There are many types of radar that can be attached to an aircraft<br />
depending on the science interests. The Multi-channel Coherent Radar Depth Sounder (MCoRDS) is a type of radar that<br />
is best used for collecting information about the bedrock.<br />
Materials:<br />
• Computer with Internet and Google Earth<br />
• Echogram Background<br />
• Petermann Glacier (Greenland) echograms (<strong>Grounding</strong><strong>Line</strong>_Student.pdf)<br />
• Student Worksheet (optional)<br />
Engage (for students without any glaciology background):<br />
• <strong>CReSIS</strong> Ice, Ice Baby lessons (https://www.cresis.ku.edu/education/k-12/ice-ice-baby-lessons)<br />
o How do Ice Sheets Form?<br />
o How is Glacier Goo Similar to a Real Glacier?<br />
Engage (for students with some glaciology background):<br />
• Complete an Internet search for glacier and ice sheet images<br />
• Make a few predictions about glacial processes (formation, movement, etc.)<br />
Q1) Sketch a glacier and label several parts.<br />
Q2) What part of a glacier do you predict to flow the fastest? What may cause a glacier to speed up?<br />
Q3) Give an example of a method or technology that researchers use to collect data about glaciers.<br />
Explain:<br />
Q4) What characteristics of a glacier do you see in this echogram?<br />
Q5) Describe how are you able to identify each characteristic?<br />
Q6) Estimate the latitude and longitude of the grounding line.<br />
Q7) What direction is the platform carrying the radar flying?<br />
Explore:<br />
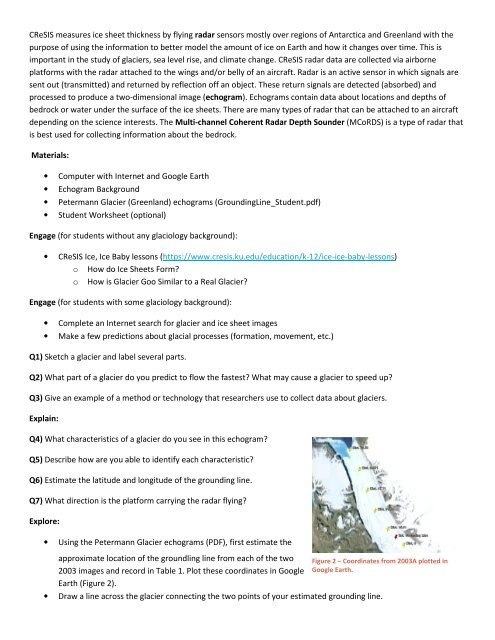
• Using the Petermann Glacier echograms (PDF), first estimate the<br />
approximate location of the groundling line from each of the two<br />
2003 images and record in Table 1. Plot these coordinates in Google<br />
Earth (Figure 2).<br />
Figure 2 – Coordinates from 2003A plotted in<br />
Google Earth.<br />
• Draw a line across the glacier connecting the two points of your estimated grounding line.