Grounding Line Location using Echograms - CReSIS
Grounding Line Location using Echograms - CReSIS
Grounding Line Location using Echograms - CReSIS

You also want an ePaper? Increase the reach of your titles
YUMPU automatically turns print PDFs into web optimized ePapers that Google loves.
Q8) Do the grounding lines fall between the flight lines? If not recalculate your estimated grounding line<br />
Q9) Briefly describe the changes you observe in the location of the grounding line in 2003, 2007.<br />
Q10) Briefly explain how you determined the flight path direction for the data collected for each echogram.<br />
*NOTE* A *.kmz (Google Earth) file has been included with all of the data points plotted for your reference. It also<br />
includes estimated grounding lines drawn for each of the three years (2003, 2007, and 2011).<br />
Explain:<br />
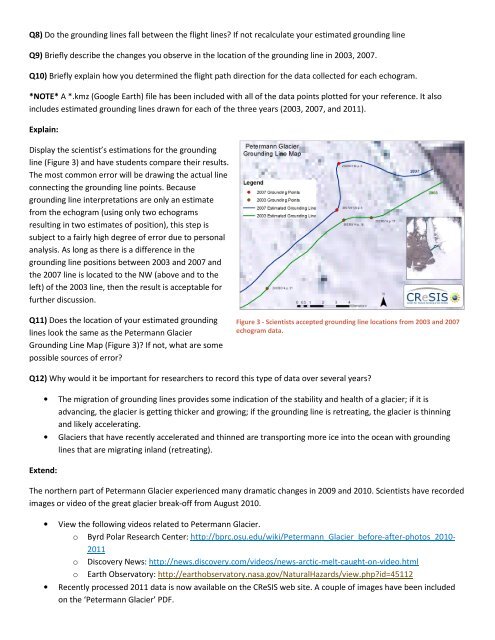
Display the scientist’s estimations for the grounding<br />
line (Figure 3) and have students compare their results.<br />
The most common error will be drawing the actual line<br />
connecting the grounding line points. Because<br />
grounding line interpretations are only an estimate<br />
from the echogram (<strong>using</strong> only two echograms<br />
resulting in two estimates of position), this step is<br />
subject to a fairly high degree of error due to personal<br />
analysis. As long as there is a difference in the<br />
grounding line positions between 2003 and 2007 and<br />
the 2007 line is located to the NW (above and to the<br />
left) of the 2003 line, then the result is acceptable for<br />
further discussion.<br />
Q11) Does the location of your estimated grounding<br />
lines look the same as the Petermann Glacier<br />
<strong>Grounding</strong> <strong>Line</strong> Map (Figure 3)? If not, what are some<br />
possible sources of error?<br />
Q12) Why would it be important for researchers to record this type of data over several years?<br />
Extend:<br />
Figure 3 - Scientists accepted grounding line locations from 2003 and 2007<br />
echogram data.<br />
• The migration of grounding lines provides some indication of the stability and health of a glacier; if it is<br />
advancing, the glacier is getting thicker and growing; if the grounding line is retreating, the glacier is thinning<br />
and likely accelerating.<br />
• Glaciers that have recently accelerated and thinned are transporting more ice into the ocean with grounding<br />
lines that are migrating inland (retreating).<br />
The northern part of Petermann Glacier experienced many dramatic changes in 2009 and 2010. Scientists have recorded<br />
images or video of the great glacier break-off from August 2010.<br />
• View the following videos related to Petermann Glacier.<br />
o Byrd Polar Research Center: http://bprc.osu.edu/wiki/Petermann_Glacier_before-after-photos_2010-<br />
2011<br />
o Discovery News: http://news.discovery.com/videos/news-arctic-melt-caught-on-video.html<br />
o Earth Observatory: http://earthobservatory.nasa.gov/NaturalHazards/view.php?id=45112<br />
• Recently processed 2011 data is now available on the <strong>CReSIS</strong> web site. A couple of images have been included<br />
on the ‘Petermann Glacier’ PDF.