Australasian Clinical Indicator Report 2003 – 2010 Obstetrics ...
Australasian Clinical Indicator Report 2003 – 2010 Obstetrics ...
Australasian Clinical Indicator Report 2003 – 2010 Obstetrics ...

Create successful ePaper yourself
Turn your PDF publications into a flip-book with our unique Google optimized e-Paper software.
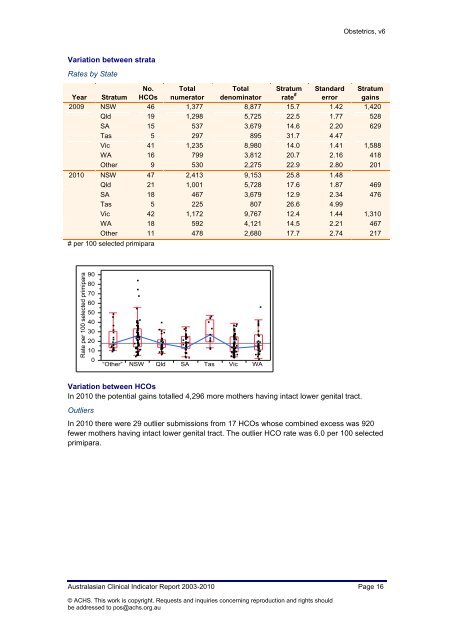
Variation between strata<br />
Rates by State<br />
<strong>Obstetrics</strong>, v6<br />
No. Total<br />
Total Stratum<br />
Year Stratum HCOs numerator denominator rate #<br />
Standard Stratum<br />
error gains<br />
2009 NSW 46 1,377 8,877 15.7 1.42 1,420<br />
Qld 19 1,298 5,725 22.5 1.77 528<br />
SA 15 537 3,679 14.6 2.20 629<br />
Tas 5 297 895 31.7 4.47<br />
Vic 41 1,235 8,980 14.0 1.41 1,588<br />
WA 16 799 3,812 20.7 2.16 418<br />
Other 9 530 2,275 22.9 2.80 201<br />
<strong>2010</strong> NSW 47 2,413 9,153 25.8 1.48<br />
Qld 21 1,001 5,728 17.6 1.87 469<br />
SA 18 467 3,679 12.9 2.34 476<br />
Tas 5 225 807 26.6 4.99<br />
Vic 42 1,172 9,767 12.4 1.44 1,310<br />
WA 18 592 4,121 14.5 2.21 467<br />
Other 11 478 2,680 17.7 2.74 217<br />
# per 100 selected primipara<br />
Variation between HCOs<br />
In <strong>2010</strong> the potential gains totalled 4,296 more mothers having intact lower genital tract.<br />
Outliers<br />
In <strong>2010</strong> there were 29 outlier submissions from 17 HCOs whose combined excess was 920<br />
fewer mothers having intact lower genital tract. The outlier HCO rate was 6.0 per 100 selected<br />
primipara.<br />
<strong>Australasian</strong> <strong>Clinical</strong> <strong>Indicator</strong> <strong>Report</strong> <strong>2003</strong>-<strong>2010</strong> Page 16<br />
© ACHS. This work is copyright. Requests and inquiries concerning reproduction and rights should<br />
be addressed to pos@achs.org.au