Australasian Clinical Indicator Report 2003 – 2010 Obstetrics ...
Australasian Clinical Indicator Report 2003 – 2010 Obstetrics ...
Australasian Clinical Indicator Report 2003 – 2010 Obstetrics ...

You also want an ePaper? Increase the reach of your titles
YUMPU automatically turns print PDFs into web optimized ePapers that Google loves.
Rates by State<br />
<strong>Obstetrics</strong>, v6<br />
No. Total<br />
Total Stratum<br />
Year Stratum HCOs numerator denominator rate #<br />
Standard Stratum<br />
error gains<br />
2009 NSW 38 84 10,553 0.97 0.16<br />
Qld 20 162 10,140 1.58 0.16 61<br />
SA 15 125 5,576 2.18 0.22 67<br />
Tas 6 65 1,651 2.98 0.41 33<br />
Vic 36 199 15,540 1.31 0.13 52<br />
WA 17 112 8,077 1.43 0.18 37<br />
Other 8 67 3,108 2.01 0.30 32<br />
<strong>2010</strong> NSW 41 169 13,619 1.34 0.12<br />
Qld 19 213 11,126 1.88 0.13 60<br />
SA 14 117 5,546 2.10 0.19 42<br />
Tas 5 25 1,304 1.90 0.39<br />
Vic 39 219 16,214 1.38 0.11<br />
WA 19 123 8,635 1.43 0.15<br />
Other 10 130 4,266 2.71 0.21 58<br />
#per 100 caesareans<br />
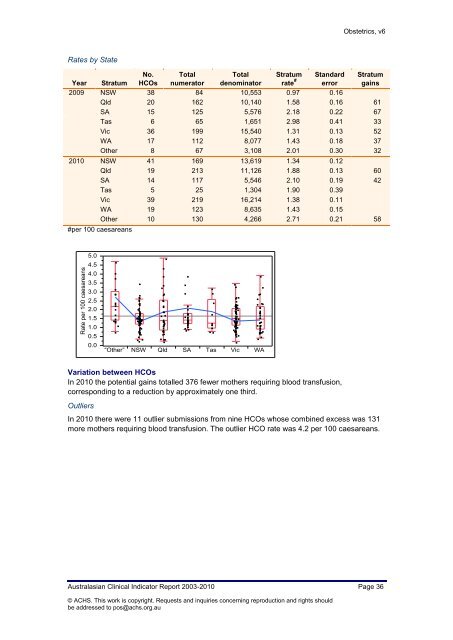
Variation between HCOs<br />
In <strong>2010</strong> the potential gains totalled 376 fewer mothers requiring blood transfusion,<br />
corresponding to a reduction by approximately one third.<br />
Outliers<br />
In <strong>2010</strong> there were 11 outlier submissions from nine HCOs whose combined excess was 131<br />
more mothers requiring blood transfusion. The outlier HCO rate was 4.2 per 100 caesareans.<br />
<strong>Australasian</strong> <strong>Clinical</strong> <strong>Indicator</strong> <strong>Report</strong> <strong>2003</strong>-<strong>2010</strong> Page 36<br />
© ACHS. This work is copyright. Requests and inquiries concerning reproduction and rights should<br />
be addressed to pos@achs.org.au