Australasian Clinical Indicator Report 2003 – 2010 Obstetrics ...
Australasian Clinical Indicator Report 2003 – 2010 Obstetrics ...
Australasian Clinical Indicator Report 2003 – 2010 Obstetrics ...

Create successful ePaper yourself
Turn your PDF publications into a flip-book with our unique Google optimized e-Paper software.
Rates by State<br />
<strong>Obstetrics</strong>, v6<br />
No. Total<br />
Total Stratum<br />
Year Stratum HCOs numerator denominator rate #<br />
Standard Stratum<br />
error gains<br />
2009 NSW 10 167 210 79.7 8.18 37<br />
Qld 8 84 85 97.6 12.9<br />
SA 8 94 545 17.5 5.08 436<br />
Vic 7 51 55 92.0 16.0<br />
Other 9 146 158 92.0 9.44<br />
<strong>2010</strong> NSW 12 165 168 97.7 5.03<br />
Qld 5 120 121 99.0 5.93<br />
SA 7 95 196 48.9 4.66 98<br />
Vic 5 54 57 94.2 8.64<br />
WA 6 70 77 92.6 7.43<br />
Other 6 139 145 95.4 5.42<br />
#per 100 specified adverse events<br />
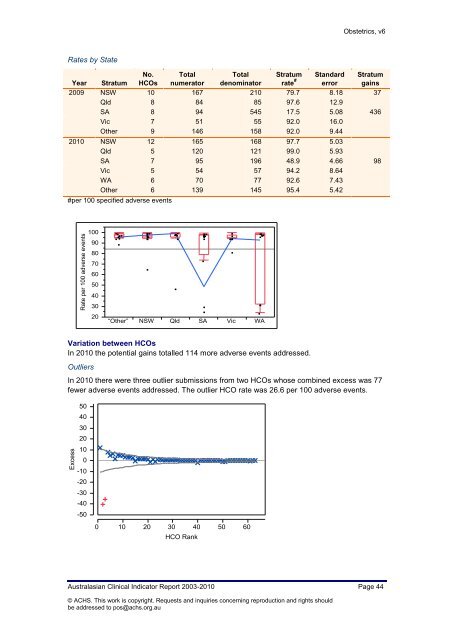
Variation between HCOs<br />
In <strong>2010</strong> the potential gains totalled 114 more adverse events addressed.<br />
Outliers<br />
In <strong>2010</strong> there were three outlier submissions from two HCOs whose combined excess was 77<br />
fewer adverse events addressed. The outlier HCO rate was 26.6 per 100 adverse events.<br />
<strong>Australasian</strong> <strong>Clinical</strong> <strong>Indicator</strong> <strong>Report</strong> <strong>2003</strong>-<strong>2010</strong> Page 44<br />
© ACHS. This work is copyright. Requests and inquiries concerning reproduction and rights should<br />
be addressed to pos@achs.org.au