Download Chapters 3-6 (.PDF) - ODBMS
Download Chapters 3-6 (.PDF) - ODBMS
Download Chapters 3-6 (.PDF) - ODBMS

You also want an ePaper? Increase the reach of your titles
YUMPU automatically turns print PDFs into web optimized ePapers that Google loves.
CHAPTER 3<br />
Patterns in Evolving Graphs<br />
So far we studied static patterns: given a graph, what are the regularities we can observe? Here we<br />
study time evolving graphs, such as patents citing each other (and new patents arriving continuously),<br />
autonomous system connecting to each other (with new or dropped connections, as time passes),<br />
and so on.<br />
3.1 D-1: SHRINKING DIAMETERS<br />
As a graph grows over time, one would intuitively expect that the diameter grows, too. It should be<br />
a slow growth, given the “six degrees” of separation. Does it grow as O(log N)?AsO(log log N)?<br />
Both guesses sound reasonable.<br />
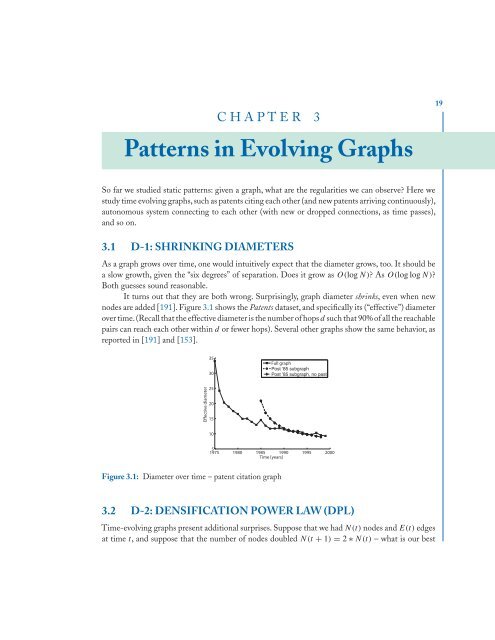
It turns out that they are both wrong. Surprisingly, graph diameter shrinks, even when new<br />
nodes are added [191]. Figure 3.1 shows the Patents dataset, and specifically its (“effective”) diameter<br />
over time.(Recall that the effective diameter is the number of hops d such that 90% of all the reachable<br />
pairs can reach each other within d or fewer hops). Several other graphs show the same behavior, as<br />
reported in [191] and [153].<br />
Effective diameter<br />
35<br />
30<br />
25<br />
20<br />
15<br />
10<br />
Full graph<br />
5<br />
1975 1980 1985 1990 1995 2000<br />
Time [years]<br />
Figure 3.1: Diameter over time – patent citation graph<br />
3.2 D-2: DENSIFICATION POWER LAW (DPL)<br />
Time-evolving graphs present additional surprises. Suppose that we had N(t)nodes and E(t) edges<br />
at time t, and suppose that the number of nodes doubled N(t + 1) = 2 ∗ N(t) – what is our best<br />
19