Download Chapters 3-6 (.PDF) - ODBMS
Download Chapters 3-6 (.PDF) - ODBMS
Download Chapters 3-6 (.PDF) - ODBMS

Create successful ePaper yourself
Turn your PDF publications into a flip-book with our unique Google optimized e-Paper software.
22 3. PATTERNS IN EVOLVING GRAPHS<br />
drop in the size of the 2nd CC. Note that edges are not removed; thus, what is reported as the size<br />
of the 2nd CC is actually the size of yesterday’s 3rd CC, causing the apparent “oscillation.”<br />
|N|<br />
diameter<br />
10 6<br />
10 5<br />
10 4<br />
10 3<br />
10 2<br />
10 1<br />
20<br />
t=31<br />
18<br />
16<br />
14<br />
12<br />
10<br />
8<br />
6<br />
4<br />
2<br />
0<br />
0 10 20 30 40 50<br />
time<br />
60 70 80 90<br />
10 0 10 0<br />
10 1<br />
CC size<br />
600<br />
500<br />
400<br />
300<br />
200<br />
100<br />
CC2<br />
CC3<br />
0 0.5 1 1.5 2 2.5<br />
x 10 5<br />
0<br />
|E|<br />
(a) Diameter(t) (b) CC2 and CC3 sizes<br />
10 2<br />
10 3<br />
|E|<br />
10 4<br />
t=31<br />
10 5<br />
10 6<br />
CC size<br />
10 6<br />
10 5<br />
10 4<br />
10 3<br />
10 2<br />
10 1<br />
t=31<br />
CC1<br />
CC2<br />
CC3<br />
10<br />
0 10 20 30 40 50 60 70 80 90<br />
0<br />
time<br />
(c) N(t) vs E(t) (d) GCC, CC2, and CC3 (log-lin)<br />
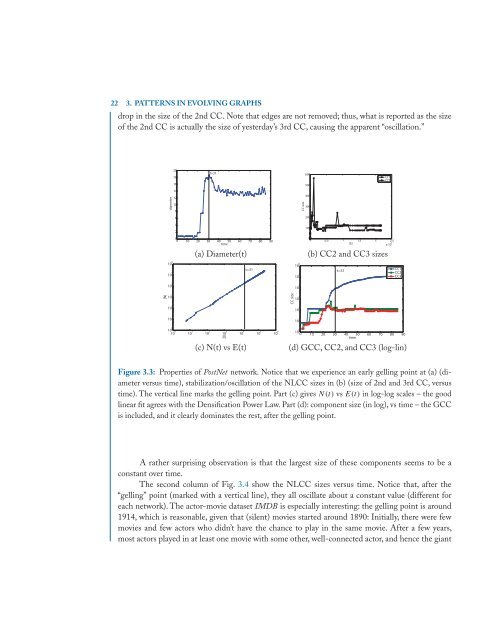
Figure 3.3: Properties of PostNet network. Notice that we experience an early gelling point at (a) (diameter<br />
versus time), stabilization/oscillation of the NLCC sizes in (b) (size of 2nd and 3rd CC, versus<br />
time). The vertical line marks the gelling point. Part (c) gives N(t) vs E(t) in log-log scales – the good<br />
linear fit agrees with the Densification Power Law. Part (d): component size (in log), vs time – the GCC<br />
is included, and it clearly dominates the rest, after the gelling point.<br />
A rather surprising observation is that the largest size of these components seems to be a<br />
constant over time.<br />
The second column of Fig. 3.4 show the NLCC sizes versus time. Notice that, after the<br />
“gelling” point (marked with a vertical line), they all oscillate about a constant value (different for<br />
each network). The actor-movie dataset IMDB is especially interesting: the gelling point is around<br />
1914, which is reasonable, given that (silent) movies started around 1890: Initially, there were few<br />
movies and few actors who didn’t have the chance to play in the same movie. After a few years,<br />
most actors played in at least one movie with some other, well-connected actor, and hence the giant