Download Chapters 3-6 (.PDF) - ODBMS
Download Chapters 3-6 (.PDF) - ODBMS
Download Chapters 3-6 (.PDF) - ODBMS

Create successful ePaper yourself
Turn your PDF publications into a flip-book with our unique Google optimized e-Paper software.
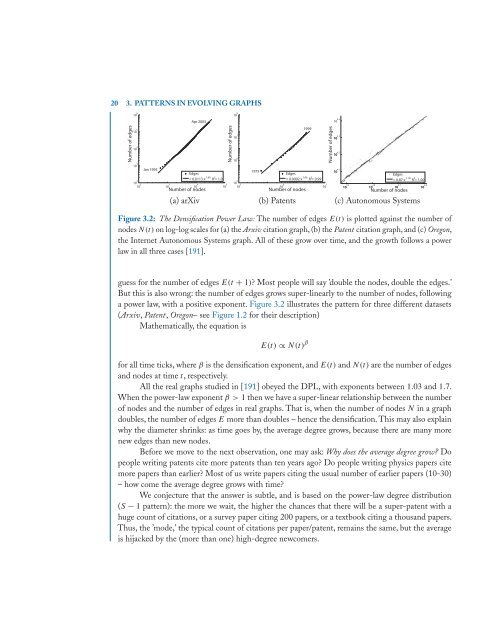
20 3. PATTERNS IN EVOLVING GRAPHS<br />
Number of edges<br />
6<br />
10<br />
10 5<br />
10 4<br />
10 3<br />
10 2<br />
10 2<br />
Jan 1993<br />
10 3<br />
Apr 2003<br />
Edges<br />
1.69 2<br />
= 0.0113 x R = 1.0<br />
10 4<br />
10 5<br />
Number of edges<br />
8<br />
10<br />
10 7<br />
10 6<br />
10 5<br />
10 5<br />
1975<br />
Number of nodes<br />
Number of nodes<br />
Number of nodes<br />
(a) arXiv (b) Patents (c) Autonomous Systems<br />
1999<br />
Edges<br />
1.66 2<br />
= 0.0002 x R = 0.99<br />
10 6<br />
10 7<br />
Number of edges<br />
4.4<br />
10<br />
10 4.3<br />
10<br />
10 4.2<br />
10<br />
10 4.1<br />
10<br />
Edges<br />
1.18 2<br />
= 0.87 x R = 1.00<br />
10 3.5<br />
10 10 3.6<br />
10 10 3.7<br />
10 10 3.8<br />
10<br />
Figure 3.2: The Densification Power Law: The number of edges E(t) is plotted against the number of<br />
nodes N(t)on log-log scales for (a) the Arxiv citation graph, (b) the Patent citation graph, and (c) Oregon,<br />
the Internet Autonomous Systems graph. All of these grow over time, and the growth follows a power<br />
law in all three cases [191].<br />
guess for the number of edges E(t + 1)? Most people will say ’double the nodes, double the edges.’<br />
But this is also wrong: the number of edges grows super-linearly to the number of nodes, following<br />
a power law, with a positive exponent. Figure 3.2 illustrates the pattern for three different datasets<br />
(Arxiv, Patent, Oregon– see Figure 1.2 for their description)<br />
Mathematically, the equation is<br />
E(t) ∝ N(t) β<br />
for all time ticks, where β is the densification exponent, and E(t) and N(t) are the number of edges<br />
and nodes at time t, respectively.<br />
All the real graphs studied in [191] obeyed the DPL, with exponents between 1.03 and 1.7.<br />
When the power-law exponent β>1 then we have a super-linear relationship between the number<br />
of nodes and the number of edges in real graphs. That is, when the number of nodes N inagraph<br />
doubles, the number of edges E more than doubles – hence the densification. This may also explain<br />
why the diameter shrinks: as time goes by, the average degree grows, because there are many more<br />
new edges than new nodes.<br />
Before we move to the next observation, one may ask: Why does the average degree grow? Do<br />
people writing patents cite more patents than ten years ago? Do people writing physics papers cite<br />
more papers than earlier? Most of us write papers citing the usual number of earlier papers (10-30)<br />
– how come the average degree grows with time?<br />
We conjecture that the answer is subtle, and is based on the power-law degree distribution<br />
(S − 1 pattern): the more we wait, the higher the chances that there will be a super-patent with a<br />
huge count of citations, or a survey paper citing 200 papers, or a textbook citing a thousand papers.<br />
Thus, the ’mode,’ the typical count of citations per paper/patent, remains the same, but the average<br />
is hijacked by the (more than one) high-degree newcomers.