Download Chapters 3-6 (.PDF) - ODBMS
Download Chapters 3-6 (.PDF) - ODBMS
Download Chapters 3-6 (.PDF) - ODBMS

You also want an ePaper? Increase the reach of your titles
YUMPU automatically turns print PDFs into web optimized ePapers that Google loves.
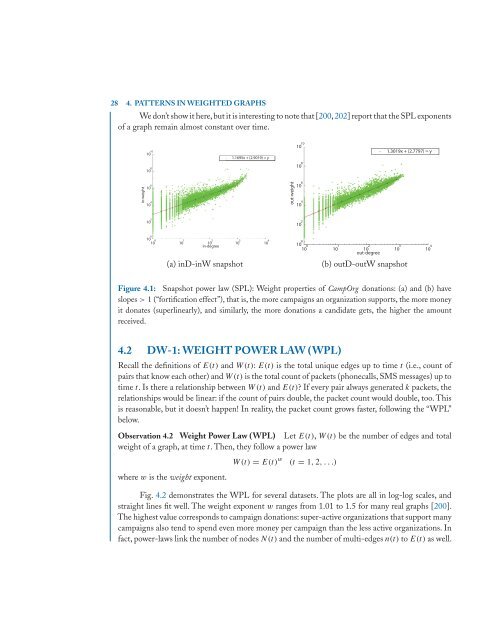
28 4. PATTERNS IN WEIGHTED GRAPHS<br />
We don’t show it here,but it is interesting to note that [200,202] report that the SPL exponents<br />
of a graph remain almost constant over time.<br />
in-weight<br />
10 10<br />
10 8<br />
10 6<br />
10 4<br />
10 2<br />
10 0 10 0<br />
10 1<br />
10<br />
in-degree<br />
2<br />
1.1695x + (2.9019) = y<br />
10 3<br />
10 4<br />
out-weight<br />
10 10<br />
10 8<br />
10 6<br />
10 4<br />
10 2<br />
10 0 10 0<br />
10 1<br />
10<br />
out-degree<br />
2<br />
(a) inD-inW snapshot (b) outD-outW snapshot<br />
1.3019x + (2.7797) = y<br />
Figure 4.1: Snapshot power law (SPL): Weight properties of CampOrg donations: (a) and (b) have<br />
slopes > 1 (“fortification effect”), that is, the more campaigns an organization supports, the more money<br />
it donates (superlinearly), and similarly, the more donations a candidate gets, the higher the amount<br />
received.<br />
4.2 DW-1: WEIGHT POWER LAW (WPL)<br />
Recall the definitions of E(t) and W(t): E(t) is the total unique edges up to time t (i.e., count of<br />
pairs that know each other) and W(t)is the total count of packets (phonecalls, SMS messages) up to<br />
time t. Is there a relationship between W(t)and E(t)? If every pair always generated k packets, the<br />
relationships would be linear: if the count of pairs double, the packet count would double, too. This<br />
is reasonable, but it doesn’t happen! In reality, the packet count grows faster, following the “WPL”<br />
below.<br />
Observation 4.2 Weight Power Law (WPL) Let E(t), W(t) be the number of edges and total<br />
weight of a graph, at time t. Then, they follow a power law<br />
where w is the weight exponent.<br />
W(t) = E(t) w (t = 1, 2,...)<br />
Fig. 4.2 demonstrates the WPL for several datasets. The plots are all in log-log scales, and<br />
straight lines fit well. The weight exponent w ranges from 1.01 to 1.5 for many real graphs [200].<br />
The highest value corresponds to campaign donations: super-active organizations that support many<br />
campaigns also tend to spend even more money per campaign than the less active organizations. In<br />
fact, power-laws link the number of nodes N(t)and the number of multi-edges n(t) to E(t) as well.<br />
10 3<br />
10 4