Squint Free Papers - aioseducation
Squint Free Papers - aioseducation
Squint Free Papers - aioseducation

Create successful ePaper yourself
Turn your PDF publications into a flip-book with our unique Google optimized e-Paper software.
<strong>Squint</strong> <strong>Free</strong> <strong>Papers</strong><br />
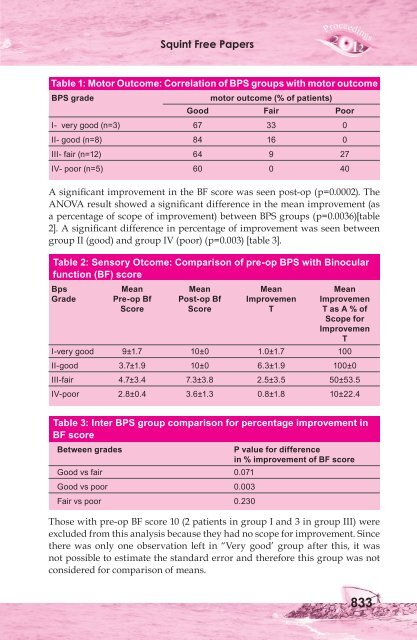
Table 1: Motor Outcome: Correlation of BPS groups with motor outcome<br />
BPS grade motor outcome (% of patients)<br />
Good Fair Poor<br />
I- very good (n=3) 67 33 0<br />
II- good (n=8) 84 16 0<br />
III- fair (n=12) 64 9 27<br />
IV- poor (n=5) 60 0 40<br />
A significant improvement in the BF score was seen post-op (p=0.0002). The<br />
ANOVA result showed a significant difference in the mean improvement (as<br />
a percentage of scope of improvement) between BPS groups (p=0.0036)[table<br />
2]. A significant difference in percentage of improvement was seen between<br />
group II (good) and group IV (poor) (p=0.003) [table 3].<br />
Table 2: Sensory Otcome: Comparison of pre-op BPS with Binocular<br />
function (BF) score<br />
Bps Mean Mean Mean Mean<br />
Grade Pre-op Bf Post-op Bf Improvemen Improvemen<br />
Score Score T T as A % of<br />
Scope for<br />
Improvemen<br />
T<br />
I-very good 9±1.7 10±0 1.0±1.7 100<br />
II-good 3.7±1.9 10±0 6.3±1.9 100±0<br />
III-fair 4.7±3.4 7.3±3.8 2.5±3.5 50±53.5<br />
IV-poor 2.8±0.4 3.6±1.3 0.8±1.8 10±22.4<br />
Table 3: Inter BPS group comparison for percentage improvement in<br />
BF score<br />
Between grades P value for difference<br />
in % improvement of BF score<br />
Good vs fair 0.071<br />
Good vs poor 0.003<br />
Fair vs poor 0.230<br />
Those with pre-op BF score 10 (2 patients in group I and 3 in group III) were<br />
excluded from this analysis because they had no scope for improvement. Since<br />
there was only one observation left in “Very good’ group after this, it was<br />
not possible to estimate the standard error and therefore this group was not<br />
considered for comparison of means.<br />
833