Atmospheric sampling of Supertyphoon Mireille with NASA ...
Atmospheric sampling of Supertyphoon Mireille with NASA ...
Atmospheric sampling of Supertyphoon Mireille with NASA ...

Create successful ePaper yourself
Turn your PDF publications into a flip-book with our unique Google optimized e-Paper software.
JOURNAL OF GEOPHYSICAL RESEARCH, VOL. 101, NO. D1, PAGES 1853-1871, JANUARY 20, 1996<br />
<strong>Atmospheric</strong> <strong>sampling</strong> <strong>of</strong> <strong>Supertyphoon</strong> <strong>Mireille</strong> <strong>with</strong> <strong>NASA</strong><br />
DC-8 aircraft on September 27, 1991, during PEM-West A<br />
R. E. Newell, 1 W. Hu, 1 Z-X. Wu, 1 Y. Zhu, 1 H. Akimoto, 2 B. E. Anderson, 3<br />
E. V. Browell, 3 G. L. Gregory, 3 G. W. Sachse, 3 M. C. Shipham, 3<br />
A. S. Bachmeier, 4 A.R. Bandy, 5 D.C. Thornton, 5 D. R. Blakefi F. S. Rowland, 6<br />
J. D. Bradshaw, 7 J. H. Crawford, 7 D. D. Davis, 7 S. T. Sandholm, 7 W. Brockett, 8<br />
L. DeGreef, 8 D. Lewis, 8 D. McCormick, 8 E. Monitz, 8 J. E. Collins Jr., 9<br />
B. G. Heikes, 1ø J. T. Merrill, 1ø K. K. Kelly, 11 S.C. Liu, 1 y. Kondo, 12<br />
M. Koike, 12 C.-M. Liu, 13 F. Sakamaki, TM H. B. Singh, 15 J. E. Dibb, 16<br />
and R. W. Talbot 16<br />
Abstract. The DC-8 mission <strong>of</strong> September 27, 1991, was designed to sample air flowing<br />
into Typhoon <strong>Mireille</strong> in the boundary layer, air in the upper tropospheric eye region, and<br />
air emerging from the typhoon and ahead <strong>of</strong> the system, also in the upper troposphere.<br />
The objective was to find how a typhoon redistributes trace constituents in the West<br />
Pacific region and whether any such redistribution is important on the global scale. The<br />
boundary layer air (300 m), in a region to the SE <strong>of</strong> the eye, contained low mixing ratios<br />
<strong>of</strong> the tracer species 03, CO, C2H6, C2H2, C3H8, C6H6 and CS2 but high values <strong>of</strong><br />
dimethylsulfide (DMS). The eye region relative to the boundary layer, showed somewhat<br />
elevated levels <strong>of</strong> CO, substantially increased levels <strong>of</strong> 03, CS2 and all nonmethane<br />
hydrocarbons (NMHCs), and somewhat reduced levels <strong>of</strong> DMS. Ahead <strong>of</strong> the eye, CO<br />
and the NMHCs remained unchanged, 03 and CS2 showed a modest decrease, and DMS<br />
showed a substantial decrease. There was no evidence from lidar cross sections <strong>of</strong> ozone<br />
for the downward entrainment <strong>of</strong> stratospheric air into the eye region; these sections show<br />
that low ozone values were measured in the troposphere. The DMS data suggest substantial<br />
entrainment <strong>of</strong> boundary layer air into the system, particularly into the eye wall<br />
region. Estimates <strong>of</strong> the DMS sulphur flux between the boundary layer and the free troposphere,<br />
based on computations <strong>of</strong> velocity potential and divergent winds, gave values<br />
<strong>of</strong> about 69 gg S m -2 d-averaged over a 17.5 ø grid square encompassing the typhoon. A<br />
few hours aer <strong>sampling</strong> <strong>with</strong> the DC-8, <strong>Mireille</strong> passed over Oki Island, just to the north<br />
<strong>of</strong> Japan, producing surface values <strong>of</strong> ozone <strong>of</strong> 5.5 ppbv. These 03 levels are consistent<br />
<strong>with</strong> the low tropospheric values found by lidar and are more typical <strong>of</strong> equatorial<br />
regions. We suggest that the central eye region may act like a Taylor column which has<br />
moved poleward from low latitudes. The high-altitude photochemical environment<br />
<strong>with</strong>in Typhoon <strong>Mireille</strong> was found to be quite active as evidenced by significant levels<br />
<strong>of</strong> measured gas phase H202 and CH300H and model-computed levels <strong>of</strong> OH.<br />
1 Massachusetts Institute <strong>of</strong> Technology, Cambridge.<br />
2University <strong>of</strong> Tokyo, Japan.<br />
3<strong>NASA</strong> Langley Research Center, Hampton, Virginia.<br />
4Lockheed Engineering and Sciences, Co., Hampton,<br />
Virginia.<br />
5 Drexel University, Philadelphia, Pennsylvania.<br />
6University <strong>of</strong> Califomia, Irvine.<br />
7Georgia Institute <strong>of</strong> Technology, Atlanta.<br />
8Ames Science and Applications Aircraft Division, <strong>NASA</strong><br />
Ames Research Center, M<strong>of</strong>fett Field, Califomia.<br />
Copyright 1996 by the American Geophysical Union. 1. Introduction<br />
Paper number 95JD01374.<br />
0148-0227/96/95JD-01374505.00<br />
1853<br />
9Science and Technology Corp., Hampton, Virginia.<br />
løUniversity <strong>of</strong> Rhode Island, Kingston.<br />
INOAA Aeronomy Laboratory, Boulder, Colorado.<br />
2Nagoya University, Nagoya, Japan.<br />
3National Taiwan University, Taipei.<br />
14National Institute for Environmental Studies, Tsukuba,<br />
Japan.<br />
S<strong>NASA</strong> Ames Research Center, M<strong>of</strong>fett Field, Califomia.<br />
16University <strong>of</strong> New Hampshire, Durham.<br />
The Global Tropospheric Experiment (GTE),<br />
undertaken over the past decade by the National
1854 NEWELL ET AL: DC-8 SAMPLING OF TYPHOON MIREILLE<br />
ElI0<br />
N45<br />
4O<br />
35<br />
3O<br />
25<br />
2O<br />
15<br />
10<br />
N5<br />
... ......<br />
115 120 125 130 135 140 145 150 155 160 165 170<br />
BEST TRACK TC-21W !' '<br />
13 SEP- 28 SEP 91<br />
MAX SFC WIND 130KT .... ! ........... +++ : 281 ............ ........... '<br />
MINIMUM SLP<br />
910MB<br />
0ki<br />
.... '::,::::. ':..:."<br />
........... "'5 i ':'": ' Isla ..... : .4..:::% :<br />
10. 2 :<br />
ß<br />
110,<br />
115<br />
. :<br />
115 :!'11<br />
115 ..<br />
.:.<br />
'11<br />
.<br />
:'Keting 1<br />
..<br />
i:25<br />
7125<br />
t :.}':' ':'.. ':::" !25<br />
....... i .................<br />
24 39 85!<br />
..?.i ::;.::..: ..:.i: 130<br />
"' ....<br />
i ......... ...... ::..::7 : 130,<br />
'" :": "<br />
[ .'..:.:.:.'...<br />
i<br />
ß ..<br />
!.<br />
:<br />
..<br />
24<br />
.: :.. 1251<br />
85<br />
20 19.<br />
LEGEND<br />
6-tIR BEST 'IRACK POSITION<br />
SPEED OF MOV 'EMENT (KT)<br />
INTENSITY (KT)<br />
POSITION AT XXAXX)0Z<br />
TROPICAL DISTURBANCE<br />
'IROPICAL DEPRESSION<br />
TROPICAL STORM<br />
TYPI lOON<br />
SUP[]*, TYPIIOON END<br />
EX'IRA'IROPICAL SUPER<br />
SUBTROPICAL TYPIIOON START<br />
DISSIPATING STAGE<br />
FIRST WARNING ISSUED<br />
LAST WARNING ISSUF_.D<br />
65<br />
175E<br />
F- 16/00Z<br />
..TCA ..........................<br />
18 17 16 *""7øøo !ABpw<br />
15 /i øo<br />
................................... ....................<br />
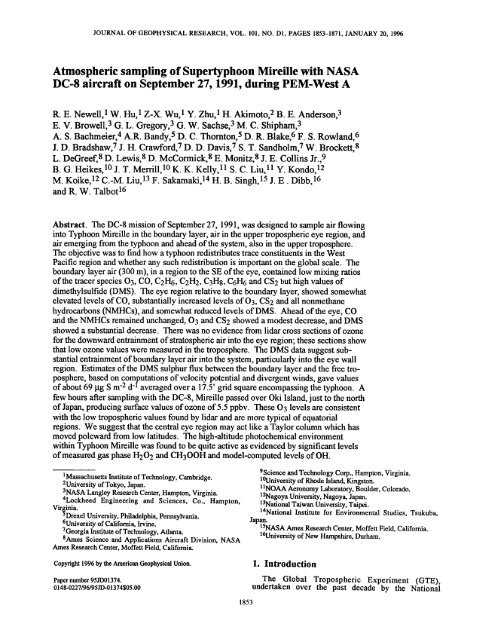
Figure 1. Track <strong>of</strong> Typhoon <strong>Mireille</strong> from September 13-28, 1991 [from Rudolph and Guard, 1992].<br />
Positions <strong>of</strong> ground stations Kenting and Oki Island are noted.<br />
Aeronautics and Space Administration, has carried out<br />
atmospheric <strong>sampling</strong> in various regions <strong>of</strong> the world.<br />
In the typhoon system, there is a substantial lateral<br />
inflow <strong>of</strong> air in the lower troposphere to compensate for<br />
Measurements are used here from flights through a<br />
typhoon during the Pacific Exploratory Mission-West A<br />
(PEM-West A) <strong>NASA</strong> DC-8 deployment to the western<br />
the rising convective motions and outflow al<strong>of</strong>t, and these<br />
quasi-horizontal flows are also important in redistributing<br />
trace constituents. An opportunity to carry out an<br />
Pacific in September-October 1991. The instrumentation experiment to check this redistribution was presented when<br />
carded on the DC-8 is described by Hoe# et al. [this issue] Typhoon <strong>Mireille</strong> approached an area to the south <strong>of</strong> Japan<br />
and the background meteorology by Bachmeier et al. [this which could be accessed from Tokyo. Air emering the<br />
issue]. Sampling was plmmed in two separate seasons: one typhoon in the surface boundary layer, in the eye itself,<br />
toward the end <strong>of</strong> the summer monsoon and the other emerging from the eye and surrounding wall cloud region<br />
toward the end <strong>of</strong> the winter monsoon. The summer in the upper troposphere, was sampled.<br />
monsoon <strong>of</strong> the tropical western Pacific always includes a Typhoon <strong>Mireille</strong> was first noted on the weather maps<br />
number <strong>of</strong> typhoons; five occurred during the 6 weeks <strong>of</strong> as a significant system on September 13, 1991, when<br />
the first PEM-West deployment. The large-scale positioned at 12øN, 172øE moving westward (see Figure 1)<br />
manifestation <strong>of</strong> atmospheric convection that these [from Rudolph and Guard, 1992] and qualified as a<br />
typhoons represent could be important in the redistribution typhoon, <strong>with</strong> 1-min sustained winds exceeding 32 ms 'l,<br />
<strong>of</strong> atmospheric trace constituents. In some previous on September 16 while at 15øN, 157øE. By September 22<br />
it had turned toward the northwest and winds had increased<br />
discussions <strong>of</strong> typhoons, there was debate as to why the air<br />
mass in the eye was apparently different from the to 67 ms -1, qualifying <strong>Mireille</strong> as a "super typhoon." After<br />
surrounding air mass. Bergeron [1954], referring to the September 23, <strong>Mireille</strong> began to slowly weaken, although<br />
work <strong>of</strong> others, noted that "The two air masses are its size, as measured by the diameter <strong>of</strong> its outermost<br />
separated by a boundary zone which sometimes has been closed isobar, continued to increase. On September 26,<br />
taken for the tmpopause itself, sucked down from its <strong>Mireille</strong> turned northward, then northeastward, and made<br />
normal height .... " In Bergeron's view, "It is more land in western Kyushu at about 0600 UT on September<br />
plausible that this boundary zone has been formed by a 27. During the evening <strong>of</strong> September 27 it passed over the<br />
similar process <strong>with</strong>in the tropospheric air itself." In the Sea <strong>of</strong> Japan and gradually lost force, passing over<br />
present experiment, ozone, a good stratospheric tracer, was northern Honshu and southern Hokkaido early on<br />
measured to test these ideas.<br />
September 28.
- q<br />
m ,. mm mmm m<br />
II<br />
Plate 1. Japanese Geostationary Meteorological satellite image for 0200 UT at time <strong>of</strong> DC-8 take-<strong>of</strong>f<br />
(provided by first Weather Wing at Yokota Air Base).<br />
37.00N<br />
./<br />
27 00E 141.00E<br />
Fi.r½ 2. Horizontal projection <strong>of</strong> flight track, DC-8 measured winds, nd dditional commercial<br />
aircraft flight winds at 288 hPa (data from European Centre for Medium-Range Weather Forecasts<br />
(ECMWF) files) for September 27, 1991. Flag, 25 ms-l; a full bar, 5 ms-l; a half bar, 2.5 ms -1. Time<br />
interval between DC-8 winds is 10 min.
1856 NEWELL ET AL' DC-8 SAMPLING OF TYPHOON MIREILLE<br />
12<br />
10<br />
27.90N I<br />
Plate 2. Three-dimensional projection <strong>of</strong> DC-8 flight.<br />
3:10<br />
3:15<br />
2:42<br />
26.70N<br />
135.30E 136.80E<br />
Figure 3. Intensive survey DC-8 flight mutes and winds for September 27, 1991. Flag, 25 ms'l; a full<br />
bar, 5 ms'l; a half bar, 2.5 ms '] . (a) Boundary layer inflow region, 300 m. Time interval between DC-8<br />
winds is 1 min. (b) Eye region, 11360 m. Time interval between DC-8 winds is 1 min. (c) Outflow<br />
region (circles are mdiosonde winds at 200 hPa), 11200 m. Time interval between DC-8 winds is 2<br />
min.<br />
2:50
32.80N<br />
5:<br />
31.70N I<br />
128.40E<br />
37.00N<br />
30.00N<br />
128.00E<br />
NEWELL ET AL' DC-8 SAMPLING OF TYPHOON MIREILLE ! 857<br />
5:30<br />
5:: 13<br />
:1o<br />
/ : 7:10 7:14<br />
__--- -- -- - ..... i,- 7:00 ......<br />
5:32<br />
Figure 3. (continued)<br />
The <strong>NASA</strong> DC-8 left Yokota Air Base, Tokyo, at section <strong>of</strong> Plate 2. The DC-8 entered the eye at about<br />
0105 UT on September 27, 1991, as <strong>Mireille</strong> approached 0457 UT through a gap in the highest clouds and remained<br />
Kyushu from the southwest <strong>with</strong> a central pressure <strong>of</strong> 935 in the eye, which by then was beginning to fill in <strong>with</strong><br />
hPa. A boundary layer mn at 300 rn was made at about clouds, until about 0535 UT, then exited to the northeast.<br />
28øN, 136øE, and the aircraft then climbed to 11.3 km and At 0550 UT the aircraft headed toward the southeast at 12<br />
penetrated the cloud region surrounding the eye (see Plate km and returned along the same path, heading northwest,<br />
1 satellite image) which, according to cloud top at 11 km. The purpose was to sample the atmosphere more<br />
temperatures and vertical temperature pr<strong>of</strong>iles, exceeded or less perpendicular to the outflow from <strong>Mireille</strong>. At<br />
15.5 km in height. The overall aircraft track is summarized 0638 UT, the end <strong>of</strong> this maneuver, the DC-8 turned<br />
in the horizontal projection <strong>of</strong> Figure 2, which includes the toward the east-northeast and returned toward Tokyo,<br />
aircraft-measured wind velocities, and in the vertical cross where it landed at 0739 UT.<br />
.:57<br />
129.70E<br />
138.00E
1858 NEWELL ET AL: DC-8 SAMPLING OF TYPHOON MIREILLE<br />
1700<br />
1650 ,,,1 .... .... i,, ,,t.,,,I .... I .... I,<br />
1.5 2 2.5 3 3.5 4 4.5 5 5.5 6 6.5 7 7.5<br />
Hour CUT)<br />
300f,,,, .... .... .... .... .... .... .... .... .... .... .... .... ,,,<br />
200[<br />
100 j.,,,L '"'""'"',, .......<br />
0 a .... I .... I ....<br />
1.5 2 2.5 3 3.5 4 4.5 5 5.5 6 6.5 7 7.5<br />
Hour (UT)<br />
100.,,, .... .... .... .... .... .... .... .... .... .... .... .... ,,,<br />
75<br />
so<br />
2<br />
1.5 2 2.5 3 3.5 4 4.5 5 5.5 6 6.5 7 7.5<br />
Hour (U'D<br />
30001, ,,, .... .... .... .... .... .... .... .... .... .... .... .... ,,,<br />
=soo<br />
2000-<br />
120<br />
- 100<br />
S0<br />
1000-<br />
soo-<br />
0"' ,I ....... I<br />
1.5 2 2.5 3 3.5 4 4.5 5 5.5 6 6.5 7 7.5<br />
Hour (UT)<br />
14<br />
12<br />
10<br />
0<br />
0<br />
240<br />
,- 200<br />
120<br />
160<br />
0<br />
150<br />
-- 12o<br />
90<br />
o<br />
3o<br />
000<br />
o<br />
1<br />
0<br />
800<br />
600<br />
400<br />
200<br />
0<br />
1<br />
1.5 2 2.5 3 3.5 4 4.5 5 5.5 6 6.5 7 7.5<br />
Hour (UT)<br />
ß ,<br />
ß , ** ..3000<br />
540[<br />
520-<br />
500<br />
E48o[<br />
,sol-<br />
440t<br />
420-<br />
400 ,<br />
ß ß .... ? , *******,, oo<br />
ß ** , , * * ** * * ** ** 2000<br />
ß 1500<br />
2 3 4 5 6 7 8 1000<br />
ß 0 . , ,* ......<br />
, , *****<br />
ß * 50<br />
,, , 4000<br />
3000<br />
2 3 4 5 6 7 8 2000<br />
6 .. .<br />
r 4-<br />
.... , i., ,i .... i,,, i, ,i,,, i ,i i ,i, ,i .... i .... i<br />
1.5 2 2.5 3 3.5 4 4.5 5 5.5 6 6.5 7 7.5<br />
100 Ho )<br />
90 ==<br />
80<br />
70 = =<br />
[ so<br />
50<br />
20 = =<br />
1.5 2 2.5 3 3.5 4 4.5 5 5.5 6 6.5 7 7.5<br />
300 - Hour (UT)<br />
250- = = =<br />
200[:- . .<br />
150 ". ."<br />
O"100. = = === "= = == =<br />
7<br />
== = == =<br />
50,, B E<br />
o "i'g ............... 2' ' i, 3 ., 4 ,I, 515 6 6.5 '" .............. 7 7.5 ' .... '<br />
800<br />
o 600<br />
400<br />
200<br />
ß ** , ***** *,*** 0<br />
1 2 3<br />
Hour (LIT)<br />
ß * * * * 2 3 5<br />
B<br />
,<br />
, ** *** **%<br />
, , *** ,<br />
ß ,<br />
ß ,<br />
2 3 4 5 6 7 8<br />
2 3 4 5 6 7 8<br />
HOUR (UT)<br />
4 5 6 7<br />
4 5 6 7<br />
6 7 8<br />
Figure 4. Time series <strong>of</strong> selected consfituems for the entire flight for September 27, 1991. B represems boundary layer<br />
mn (043242 UT-0315 UT) and E represents time spent in typhoon eye region (4)457 UT-0533 UT). (a) CH4, CO, 03, and<br />
H20 mixing ratio from Lyman-ot instrument (plus flight altitude). Resolution <strong>of</strong> data used: CO and CH4, 5 s; 03, 10 s;<br />
H20, 10 s. Co) OCS, CS2, DMS, and SO2. (c) C6H6 (benzene), C2H2 (ethyne[acetylene]), C3H8 (propane), and C2H6<br />
(ethane). (d) CH3OOH (methyl-hydroperoxide), H202 (hydrogen peroxide), and OH from model by Davis et al. [this<br />
issue]. (e) NO, NOy, peroxyacetyl nitrate (PAN), and ambient temperature (difference between GIT and Kondo discussed<br />
by Crosley [this issue]). (f) Aerosol concentrations. (g) Ratios <strong>of</strong> acetylene/CO and propane/ethane. (h) Detailed (10 s)<br />
temperature, water vapor, aircraft wind speed, and aircraft altitude from 0500 to 0700 UT.
200<br />
180<br />
40<br />
80<br />
0<br />
40<br />
20<br />
800<br />
700<br />
5<br />
4<br />
2<br />
1<br />
loo<br />
90<br />
70<br />
60<br />
"--" 50<br />
1<br />
40<br />
Z 30<br />
20<br />
0<br />
1<br />
lo<br />
- o<br />
o lO<br />
E- 20<br />
50<br />
40<br />
20<br />
10<br />
30<br />
40<br />
50<br />
f I<br />
NEWELL ET AL: DC-8 SAMPLING OF TYPHOON MIREILLE 1859<br />
Crcle GA Inst Tech<br />
Star Kondo oø o ß<br />
o<br />
o<br />
o o<br />
2 3 4 5 6 7 8<br />
Qrele GA Inst Teeh<br />
Star Kondo<br />
o<br />
2 3 4 5 6 7 8<br />
**<br />
**<br />
**<br />
**<br />
*<br />
** *<br />
* ** **,<br />
**<br />
x , ** ,<br />
, ** ** ** ,x ** ** **<br />
2 3 4 5 6 7 8<br />
2 3 4 5 6 7 8<br />
HOUR CUT)<br />
AEROSOL 05 to 20 /<br />
2 3 4 5 E 6 7<br />
HOUR (UT)<br />
.o[<br />
o.o .... ....<br />
HOUR T)<br />
0.20[<br />
0.00 ..... [ .................................................... I<br />
1.5 2 2.5 3 3.5 4 4.5 5 5.5 6 6.5 7 7.5<br />
HOUR CUT)<br />
-25<br />
-30<br />
-35<br />
-48<br />
-45<br />
-50<br />
4 5<br />
3000<br />
1580<br />
1808<br />
580<br />
48<br />
38<br />
lO<br />
14<br />
13<br />
12<br />
11<br />
4 5<br />
Figure 4. (continued)<br />
9<br />
50 55 60 65 70 7 5<br />
50 55 60 65 70 7 5<br />
50 55 60 65 78 75<br />
58 55 00 65 /0 75<br />
HOUR (UT)<br />
Intensive <strong>sampling</strong> was carried out in three regions: the also contains the flight altitude, and Figure 4e includes<br />
boundary layer inflow region at about 300 m between ambient air temperature. Time resolution <strong>of</strong> the data used<br />
0241 UT and 0315 UT; the eye and surrounding wall cloud in Figure 4a is given <strong>with</strong> the Figure 4a caption. For other<br />
region, <strong>sampling</strong> at about 11.3 and 12 km between 0457 constituents the data are collected at variable intervals and<br />
and 0535 UT; and the outflow region (a term used here to are plotted at the midpoint <strong>of</strong> the collection interval. Each<br />
denote the northeast quadrant) between 0550 and 0714 UT. time series set has the boundary layer and eye regions<br />
The aircraft-reported winds are plotted in Figure 3a-3c for marked on the time axis. Constituents having their lowest<br />
these three regions. Where available, radiosonde winds values in the boundary layer included CO, 03, SO2, C2H2,<br />
(see, for example, Figure 3c) and winds from commercial C2H6, C3H8, C6H6, NO, NOy, and PAN. PAN is actually<br />
aircraft flights (AIREPs) are also included (see, for below the detection limit; its concentration is very sensitive<br />
example, Figure 2). Most <strong>of</strong> the body <strong>of</strong> this paper deals to temperature, decreasing at higher temperatures [Singh,<br />
<strong>with</strong> the atmospheric chemistry findings in these three 1987]. Thus indications are that the air entering the<br />
regions and their possible interpretation in terms <strong>of</strong> typhoon from the south in the southeastern sector is clean<br />
atmospheric motions.<br />
marine air. The marine origin <strong>of</strong> the inflow was also<br />
indicated by the fact that the highest DMS values <strong>of</strong> the<br />
mission occurred in the boundary layer. The higher<br />
aerosol concentrations in the boundary layer (Figure 40 are<br />
2. Results <strong>of</strong> Boundary Layer Sampling thought to be associated <strong>with</strong> sea salt.<br />
In addition to the time series <strong>of</strong> constituents themselves,<br />
time series <strong>of</strong> ratios <strong>of</strong> two pairs <strong>of</strong> constituents which can<br />
Time series <strong>of</strong> selected constituents are examined first be interpreted in terms <strong>of</strong> air mass age are presented in<br />
to place the boundary layer inflow region in proper Figure 4g. As discussed elsewhere [Gregory et al., this<br />
perspective. Figure 4 includes time series for the entire issue], an acetylene/CO ratio <strong>of</strong> 1 suggests emissions only a few<br />
(DMS), 802, C2H2, C2H6, C3H8, C6H6, NO, NOy, .days old. These values apply when acetylene is expressed<br />
CH3C(O)OONO 2 (peroxyacetyl nitrate (PAN)), H202, in pptv and CO is in ppbv. The lifetime <strong>of</strong> acetylene<br />
CH3OOH, OH (model calculated), and aerosol. Figure 4a (C2H2) is about 11 days, while that <strong>of</strong> carbon monoxide is
1860 NEWELL ET AL: DC-8 SAMPLING OF TYPHOON MIREILLE<br />
27<br />
27 28 29 '30 31 '32 33<br />
17<br />
14<br />
2 7 2.8 2.9 3.0 3.1 3.2 3.3<br />
HOUR OJT)<br />
Figure 5. Time series <strong>of</strong> DC-8 1-s <strong>sampling</strong> <strong>of</strong><br />
temperature and specific humidity during boundary layer<br />
mn at about 300 m. Units, degrees Celsius and grams per<br />
kilogram.<br />
about 34 days; by contrast, under the same conditions,<br />
DMS would have a lifetime <strong>of</strong> approximately 2 days.<br />
(These lifetime estimates use a diurnally averaged OH<br />
level <strong>of</strong> 1.4 x 106 cm '3 which was based on averaged<br />
atmospheric conditions during PEM-West A centered<br />
around a latitude <strong>of</strong> 30øN [see Davis et al., this issue;<br />
O3 (ppbv)<br />
.o ........ !,9 ....... .,o, ....... ,,o, ....... ,,o, ....... ,,o, ....... ,,o, ....... o, ....... ,¾, ....... ¾, ........ .o<br />
7.0<br />
6.5<br />
6.0<br />
5.0<br />
3.5<br />
2.5<br />
1.5<br />
1.0<br />
0.5<br />
0.0<br />
03<br />
H20<br />
.<br />
7.5<br />
7.0<br />
6.5<br />
6.0<br />
5.5<br />
5.0<br />
4.5<br />
4.0<br />
3.5<br />
3.0<br />
2.5<br />
2.0<br />
1.5<br />
1.0<br />
0.5<br />
).0<br />
Rodriguez et aL, unpublished material, 1995].) The same<br />
general view is given by the propane/ethane ratio; these<br />
two gases have lifetimes <strong>of</strong> 8 and 34 days (see above<br />
comment on OH levels). Using all <strong>of</strong> the above criteria,<br />
the boundary layer air entering from the south can be<br />
considered well aged. Further comments about the<br />
hydrocarbon data are given below.<br />
The water vapor mixing ratios and aircraft temperatures<br />
for the tropical boundary layer are shown together in<br />
Figure 5, from which it can be seen that higher<br />
temperatures are associated <strong>with</strong> drier air; correlation<br />
coefficients between these two variables are about -0.5.<br />
The spatial separation <strong>of</strong> the descending dry plumes is tens<br />
<strong>of</strong> kilometers, as may be seen from a map <strong>of</strong> specific<br />
humidity during the boundary layer <strong>sampling</strong> (not shown).<br />
The higher temperatures at 300 m are produced by<br />
subsidence, implying a downward heat transport by these<br />
motions. Because sinking motions are relatively dry and,<br />
as will be seen later, there is overall convergence into the<br />
typhoon region in the lower levels, rising motions in the<br />
same area will be relatively moist, and the net effect is an<br />
upward transport <strong>of</strong> moisture. 'here is a large vertical<br />
gradient <strong>of</strong> H20 mixing ratio in erie lowest 2 kin, as seen<br />
from vertical pr<strong>of</strong>iles made on descent to and ascent from<br />
the boundary layer (an example is shown in Figure 6, to be<br />
discussed below). This is maintained by the strong winds<br />
(>15 ms -l) and consequem high evaporation from the<br />
surface. The temperature gradient between 850 hPa (1.5<br />
km) and 300 m is about 6.5øC km 'l, close to moist<br />
adiabatic. The subsiding plumes are an important factor in<br />
ventilating the boundary layer <strong>with</strong> air from the free<br />
troposphere.<br />
Other species measured in the boundary layer, but not<br />
illustrated here, include 7Be, which has a concentration <strong>of</strong><br />
46 fCi m '3, relatively low compared <strong>with</strong> values <strong>of</strong> over<br />
200 fCi m -3 in the upper troposphere, and 2]øpb, which has<br />
a value <strong>of</strong> 3.6 fCi m '3, quite similar to two' other<br />
measurements in the upper troposphere made before<br />
penetration <strong>of</strong> the eye and not far from the value measured<br />
in the eye. Well ahead <strong>of</strong> the eye, a final fifth<br />
measurement yielded-0.5 fCi m '3. These data are<br />
obtained from aerosol collection and typically involve<br />
<strong>sampling</strong> times <strong>of</strong> 30-40 min.<br />
-<br />
-<br />
5:33<br />
-<br />
31 70N t I I C I L<br />
128 40E 129 70E<br />
Figure 6. Vertical pr<strong>of</strong>iles <strong>of</strong> specific humidity and ozone<br />
from DC-8 measurements. This pr<strong>of</strong>ile was made during Figure 7. Map <strong>of</strong> DC-8 air temperature in vicinity <strong>of</strong> eye<br />
the descent to the boundary layer between 0223 UT and at about 11.3 km on September 27, 1991. Points are 60 s<br />
0242 UT on September 27, 1991.<br />
apart. Units, degrees Celsius.
32 80N<br />
5:33<br />
_ 13.<br />
_<br />
.,<br />
NEWELL ET AL: DC-8 SAMPLING OF TYPHOON MIREILLE 1861<br />
1 .<br />
_ - 7. ' 3 ' 5:10 i<br />
_ O. 1. ß -<br />
_<br />
31 70N t<br />
128 40E<br />
Figure 8. Map <strong>of</strong> DC-8 water vapor mixing ratio in<br />
vicinity <strong>of</strong> eye at about 11.3 km on September 27, 1991.<br />
Points are 60 s apart. Units, parts per million by volume.<br />
32 80N , , , , , , ,<br />
5:33<br />
/..o<br />
5.7 - 3 1:57<br />
129 70E 128 40E 129 70E<br />
Figure 9. Map <strong>of</strong> ozone in vicinity <strong>of</strong> the eye at about<br />
11.3 km September 27, 1991. Points are 60 s apart. Units,<br />
parts per billion by volme.<br />
3. Results <strong>of</strong> Sampling in Eye and Wall Cloud the eye, compared <strong>with</strong> typical values <strong>of</strong> about 2000<br />
fCi m -3 in the stratosphere. Again the implication is that<br />
Region<br />
stratospheric air is not being drawn down into the eye<br />
region. The lidar cross sections (Plates 3a and 3b) show<br />
very low ozone inside the eye, generally characteristic <strong>of</strong><br />
The aircraft reached the eye at about 0500 UT at 11.3 equatorial boundary layer air, from 5 km to a height <strong>of</strong><br />
km and ascended to about 11.9 km between 0528 and about 16 km. The gap in coverage in the 0511-0513 UT<br />
0530 UT, just before leaving the eye. The DC-8 1-nfin air period in these images occurs when the aircraft was turning<br />
temperatures are mapped in Figure 7; the eye center is into the wall cloud from the north (see Figure 8 water<br />
about 6øC higher than its surroundings (compare 0457, vapor values). It is also worth noting that there is a<br />
0517, and 0520 UT values). Temperature values every negative correlation between H20 and 03 in the time series<br />
10 s are in Figure 4h and show variation <strong>of</strong> up to 6øC in the and generally a positive correlation between H20 and wind<br />
eye. Sinking motion in the eye <strong>with</strong> concomitant speed (cf. Figure 4h). This indicates that moist, highcompression<br />
and adiabatic warming is suggested and velocity air has less ozone than dry slower-moving air; it<br />
would account for the lack <strong>of</strong> cloud there in the GMS can be inferred from the limited radiosonde data available<br />
images at and before 0000 UT. A relevant schematic <strong>of</strong> that wind speeds are decreasing above -12 km, so the latter<br />
this type <strong>of</strong> circulation has been given by IVilloughby air is subsiding. Carbon monoxide is characteristically low<br />
[1988]. The water vapor mixing ratio measured by the in the stratosphere (-50 ppbv) and can also be used as a<br />
Lyman-a instrument showed quite dry patches, 270-500 tracer <strong>of</strong> stratospheric air; but in this case (Figure 4a), the<br />
parts per million by volume (ppmv), in some regions <strong>of</strong> the boundary layer air gave the lowest value (-70 ppbv), and<br />
eye, again suggesting subsidence, mixed <strong>with</strong> values up to the air ahead <strong>of</strong> the typhoon showed 115-120 ppbv (Figure<br />
2580 ppmv, and it appears that cloud particles could also 4a), so the fact that the eye contained a few values in the<br />
be involved in the latter (Figure 8). Patchy clouds were 103-110 ppbv (Figure 10) range could not be interpreted as<br />
quite abundant <strong>with</strong>in the eye region, and these may be indicating stratospheric air; in fact, it could be claimed that<br />
responsible for the high aerosol concentration after some <strong>of</strong> the air originated from the boundary layer. It was<br />
0518 UT. The ozone concentrations in the eye region noted earlier that DMS had its highest values in the<br />
(Figures 9 and 4a) are relatively low (-25-30 pans per boundary layer (-90 parts per trillion by volume (pptv); see<br />
billion by volume (ppbv)), although them are a few spikes Figure 4b). After the DC-8 left the boundary layer, DMS<br />
up to 40-50 ppbv in the central drier region, but them are values returned to their limit <strong>of</strong> detection until 0454 UT,<br />
no high values (>100 ppbv) as might be expected if just before entering the wall cloud convection region; at<br />
stratospheric air was present. Suggestions have been made that point they increased to 80 pptv. In the eye, there were<br />
that stratospheric air could be entrained into the eye, but three observations: 25, 42, and 48 pptv (see Figure 4b). On<br />
these ozone measurements suggest that Bergeron [1954] leaving the eye at 0537 UT, high values (78 pptv) were<br />
provided a more attractive explanation <strong>of</strong> the higher again associated <strong>with</strong> the wall cloud region; values are<br />
temperatures in the eye by arguing, as noted earlier, that considerably lower in the outflow region, as may be seen<br />
the subsidence responsible occurred <strong>with</strong>in the from Figure 4b, adding weight to the interpretation that the<br />
troposphere. Nevertheless, there may be small-scale highest values are transported from the boundary layer into<br />
intrusions <strong>of</strong> stratospheric air into the upper troposphere the upper troposphere in the wall cloud region. Some <strong>of</strong><br />
well above the aircraft, and one possible example is this wall-cloud air sinks into the eye, while the remainder<br />
included in the ozone lidar cross section <strong>of</strong> Plate 3a. The moves away from the typhoon in the upper troposphere.<br />
concomitant aerosol lidar cross section shows cirrus cloud In general, tracer species showed a range <strong>of</strong> mixing<br />
almost completely covering the eye at about 16 kin, thus ratio patterns when viewed in the boundary layer, the free<br />
indicating no large-scale sinking motion at that level. It is troposphere ahead <strong>of</strong> the eye, and the eye itself. For<br />
also worth noting that the highest 7Be concentration is 200 example, the mixing ratios <strong>of</strong> 7Be, 03, C2H2, C2H8, C3H8,<br />
fCi m '3 in the upper troposphere and about 80 fCi m -3 in C6H6, C82, and CO were lowest in the boundary layer,
1862 NEWELL ET AL: DC-8 SAMPLING OF TYPHOON MIREILLE<br />
PEM WEST-A<br />
TYPHOON<br />
FLIGHT 9 27 SEP 91<br />
RELATIVE AEROSOL SCATTERING (IR)<br />
0 400 800 1200 1600 2000<br />
I I I I I I<br />
.J17-<br />
18-<br />
16-<br />
-<br />
u.J 15_<br />
14-<br />
13--<br />
19-<br />
PEM WEST-A<br />
NEWELL ET AL: DC-8 SAMPLING OF TYPHOON MIREILLE 1863<br />
TYPHOON<br />
FLIGHT 9 27 SEP 91<br />
RELATIVE AEROSOL SCATTERING (VS)<br />
0 500 1000 1500 2000 2500<br />
I I I I I I<br />
5<br />
4-<br />
3<br />
2-<br />
1- -<br />
_<br />
0-<br />
5'08 5:12 5'16 UT<br />
, I I I<br />
32.34 32.01 32.25 N LAT<br />
, i , t , !<br />
128.94 129.34 128.92 E LON<br />
OZONE (PPBV)<br />
20 40 60 80 100<br />
I I I I I<br />
5:08 5:12 5'16<br />
, I I i I<br />
32.34<br />
i ,<br />
128.94<br />
32.01<br />
I<br />
129.34<br />
Plate 3. (continued)<br />
32.25<br />
I<br />
128.92<br />
10<br />
9<br />
8<br />
7<br />
6<br />
5<br />
4<br />
3<br />
2<br />
1<br />
0<br />
UT<br />
N LAT<br />
E LON
1864 NEWELL ET AL: DC-8 SAMPLING OF TYPHOON MIREILLE<br />
32 80N<br />
31 70N<br />
128 40E<br />
5:33<br />
_ -,poe<br />
:57<br />
9<br />
,t<br />
129 70E<br />
Figure 10. Map <strong>of</strong> carbon monoxide in eye region at<br />
about 11.3 km on September 27, 1991. The time interval<br />
between closely spaced points is about 60 s. There are a<br />
number <strong>of</strong> missing data points. Units, parts per billion by<br />
volume.<br />
contact <strong>with</strong> the wall cloud region, may have had higher<br />
concentrations <strong>of</strong> some <strong>of</strong> these constituents than were<br />
measured in the boundary layer to the southeast <strong>of</strong> the<br />
storm. In considering the latter hypothesis, it is important<br />
to keep in mind that while the sampled boundary layer was<br />
over the open ocean, the air which fed directly into the wall<br />
cloud was over the southern portion <strong>of</strong> Kyushu at the time<br />
<strong>of</strong> <strong>sampling</strong>, and the shallow bays and coastal waters and<br />
land areas could have had much higher concentrations <strong>of</strong><br />
several <strong>of</strong> the tracer species. The observed relatively high<br />
values <strong>of</strong> SO2 may also have originated from surface<br />
anthropogenic sources in Japan. However, it is also to be<br />
noted that them were two active volcanoes in the area,<br />
Sakura-Jima (31.58øN, 130.67øE, 1360-m elevation) and<br />
Unzen (32.75øN, 130.03øE, 1118-m elevation), and as may<br />
be seen from Plate 2, air from their vicinity could easily<br />
have been entrained into the eye region.<br />
Aerosol values (Fi.ure 4f) show two ranges near the<br />
eye: 5-10 pam,'cles cm- from 0457 to 0518 UT and 15-35<br />
particles cm -a until the end <strong>of</strong> the flight. As for the<br />
hydrocarbons, these aerosols may have originated from the<br />
continent.<br />
4. Upper Troposphere Outflow Region Ahead<br />
<strong>of</strong> <strong>Mireille</strong><br />
whileDMS was highest. Approximate mixing ratio values<br />
for several <strong>of</strong> these species (e.g., 7Be, 03, CS2, and CO) Wind velocities in this region are shown in Figure 3c<br />
for all three regions are shown in Table 1, together <strong>with</strong> the and temperature, H20, DMS, and 03 in Figures 11-14.<br />
deduced fraction <strong>of</strong> boundary layer air that, when mixed The closeness <strong>of</strong> the two legs to the southeast and<br />
<strong>with</strong> air from the free troposphere, accounts for the northwest (0550-0635 UT) enables a vertical lapse rate to<br />
observed mixing milos in the eye. Problems arise from the be found as 7.4øC km -1 at 0610 UT (-48.5øC at 11.95 km<br />
assumption that the eye air is drawn only from two versus -39.5øC at 10.73 km). High water vapor mixing<br />
sources, from the fact that the boundary layer air sampled ratios are encountered between the eye and 34øN, 13 IøE<br />
was far removed from the boundary layer contributing (Figure 12), and these correspond to intense clouds on the<br />
most directly to the wall cloud region and from the fact GMS image (Plate 1). DMS declines after passage through<br />
that the free troposphere contribution came from a variety this cloudy, moist region (Figure 13), again suggesting that<br />
<strong>of</strong> air masses that were entrained horizontally by the the active convection is bringing up material from the<br />
typhoon system. Nevertheless, these results suggest that a boundary layer that has been processed by passage through<br />
significant fraction <strong>of</strong> the air in the eye wall region could the typhoon system. What is termed outflow is therefore a<br />
have originated from the boundary layer.<br />
mixture <strong>of</strong> air that has been advected into the typhoon area<br />
The four hydrocarbons shown in Figure 4c all increased in the upper troposphere and air which has passed through<br />
<strong>with</strong> altitude and were found to be higher in and ahead <strong>of</strong> the rising motion region <strong>of</strong> the typhoon. An aerosol<br />
the eye than in the boundary layer. The hydrocarbons are sample from 0540 to 0638 UT gave a 7Be value <strong>of</strong> 63<br />
only slightly diluted, if at all, in the eye wall region, fCi m -3, which compares <strong>with</strong> 46 fCi m -3 in the boundary<br />
suggesting they may have originated (see comments layer, and therefore gives further evidence for this point.<br />
below) from the continent. Carbon disulfide (CS2) may The ozone values along the sortie to the southeast show a<br />
have had a similar path as the NMHCs. Still another general decrease <strong>with</strong> altitude (Figure 14), whereas carbon<br />
possibility is that the boundary layer which is in direct monoxide shows little change (Figure 4a).<br />
Table 1. Mixing Ratios in Boundary Layer, Free<br />
Troposphere, and Eye Region at 11-12 km<br />
Together With Resulting Fraction <strong>of</strong> Air<br />
in the Eye Derived From the Bounda .ry<br />
Layer<br />
Boundary Free % <strong>of</strong> Eye<br />
Layer (BL) Troposphere Eye From BL<br />
CO, ppbv 70.0 116.0 105.0 24.0<br />
7Be, fCi m -3 46.0 205.0 81.0 78.0<br />
DMS, pptv 94.0 6.0 38.0 36.0<br />
0 3, ppbv 15.0 55.0 30.0 62.0<br />
C2H2, pptv 30.0 185.0 160.0 16.0<br />
CS 2, pptv 1.0 5.8 4.5 27.0<br />
5. Air Mass Sources From Meteorological<br />
Data<br />
Three approaches can be used to examine possible<br />
sources: trajectory analysis, streamline analysis, and<br />
consideration <strong>of</strong> the rotational and irrotational components<br />
<strong>of</strong> the wind. In trajectory analysis, one tries to follow the<br />
motion <strong>of</strong> an individual parcel <strong>of</strong> air; the procedure,<br />
assumptions, caveats, and applications to PEM-West A<br />
case studies are given by Merrill [this issue]. The problem<br />
<strong>with</strong> application <strong>of</strong> trajectory analysis techniques to a<br />
typhoon case is that large vertical displacements occur in<br />
regions <strong>of</strong> strong convection, which invalidate the<br />
assumption that motion follows an isentropic surface at the<br />
large scale. Other problems arise because machine<br />
analyses <strong>of</strong>ten lack the fidelity necessary to reproduce<br />
reality [cf. Danielsen, 1974], and they are based on an
37 00N ,, , ,<br />
- -4 6:6 øa' ::<br />
_<br />
NEWELL ET AL: DC-8 SAMPLING OF TYPHOON MIREILLE 1865<br />
30 00N I ] I I i I<br />
128 00E 138 00E<br />
37 OON<br />
30 00N<br />
128 00E<br />
Figure 11. Map <strong>of</strong> DC-8 air temperature in the outflow Figure 12. Map <strong>of</strong> DC-8 water vapor mixing ratio in the<br />
region on September 27, 1991. Circles are radiosonde outflow region at about 11.2 km on September 27, 1991.<br />
temperatures at 195 hPa. Time interval between data Time interval between data points is 5 min. Units, parts<br />
points is 5 min. Units, degrees Celsius.<br />
per million by volume.<br />
observational network that cannot catch the spatial<br />
variations at the typhoon scale. Streamline analysis too is<br />
limited by the horizontal spacing between radiosondes that<br />
go into it, but streamline analysis can be used qualitatively<br />
to identify the broad-scale air masses in the region.<br />
Streamlines and wind vectors are shown in Figure 15 for a<br />
level <strong>of</strong> 1000 hPa based on grid poim data supplied by the<br />
European Centre for Medium-Range Weather Forecasts<br />
(ECMWF). There is convergence <strong>of</strong> a marine air mass<br />
from the east and a continental air mass from the west in<br />
the vicinity <strong>of</strong> 130øE. Streamlines have been used to<br />
characterize tropical storms in the southern hemisphere and<br />
give patterns which are almost a mirror image <strong>of</strong> Figure 15<br />
[Holland, 1984]. The DC-8 <strong>sampling</strong> <strong>of</strong> the boundary<br />
layer at about 27øN, 136øE was made in the marine air.<br />
According to the trace constituent measurements reported<br />
in section 2, this air is clean and aged.<br />
To estimate the overall mass flux in the typhoon region,<br />
the ECMWF wind velocities were decomposed into two<br />
components: an irrotational part which has no curl and a<br />
rotational part which has no divergence. While the first is<br />
usually smaller than the second, it is the most important for<br />
the mass flux through the system. These parts may be<br />
written in terms <strong>of</strong> a velocity potential Z and a stream<br />
function<br />
37 00N<br />
30 00N<br />
128 00E 138 00E<br />
Figure 13. Map <strong>of</strong> DMS in the outflow region at about<br />
11.2 km on September 27, 1991. Time interval between<br />
data points is 5 min. Units, parts per trillion by volume.<br />
v = vir+ vr =-V Z + k x V (1)<br />
Taking the divergence and curl in mm yields<br />
V. v =-V2z (2)<br />
cud v = V: (3)<br />
From the observed or analyzed wind field, Z and W may be<br />
obtained by solution <strong>of</strong> the Laplacians involved, and<br />
thence, v i, and v, may be found. It was fortunate that the<br />
ECMWF'analysig was chang. ed on September 17, 1991, 10<br />
days before the DC-8 mission to Typhoon <strong>Mireille</strong>, to a<br />
higher resolution, T213, which gives the smallest<br />
wavelength resolved at the equator to be 190 km. While<br />
this analysis cannot resolve the eye region, it is sufficient<br />
so that estimates <strong>of</strong> the irrotational flow over the large area<br />
covered by the typhoon may be made; it is this larger-scale<br />
flow that represents the response to the rising motion in the<br />
eye wall region. Examples <strong>of</strong> the divergent flow<br />
components are given in Figures 16 and 17 for 1000 and<br />
700 hPa. There is a significant drift inward toward the<br />
center <strong>of</strong> up to-8 ms -l, and <strong>Mireille</strong> clearly dominates this<br />
37 00N<br />
30 00N t I I I I I I I<br />
128 00E 138 00E<br />
Figure 14. Map <strong>of</strong> ozone in the outflow region at about<br />
11.2 km on September 27, 1991. Time interval between<br />
data points is 5 min. Units, parts per billion by volume.
1866 NEWELL ET AL: DC-8 SAMPLING OF TYPHOON MIREILLE<br />
60N<br />
50N<br />
40N<br />
30N,<br />
20N<br />
EQ<br />
100E 110E 120E 130E 140E 150E 160E 100E 110E<br />
Figure 15. Streamlines and wind vectors for 0000 UT,<br />
September 27, 1991, based on ECMWF analysis for 1000<br />
hPa. Units, meters per second. Maximum vector (near<br />
eye) is 21 meters per second.<br />
... :., ,c--ee---- -.<br />
-,':," ' ' , : I , z",<br />
-ill -- , , ',k..--?,.ff-:-?<br />
.... -------k--<br />
i;<br />
c ' 'r,' - --',b - -,'<br />
;',," ! ,,'<br />
,<br />
,,:<br />
140E 150E 160E<br />
component <strong>of</strong> the flow over a large area &110ø-150øE at<br />
30øN). At 700 a it appears that a substantial fraction <strong>of</strong> Asian coast from the west. The overall picture is that the<br />
air near the typhoon-influenced region has originated from typhoon boundary layer from a very large area is<br />
the continent; more air enters from the west than from the convergent into the central region, rises in the cloud<br />
east, whereas at 1000 hPa, contributions from east and systems surrounding the eye, and then moves out from the<br />
west are almost the same. By 300 hPa (not shown) there is eye region al<strong>of</strong>t. Trace gases in the boundary layer are<br />
a divergent region in and ahead <strong>of</strong> the typhoon-influenced thus redistributed into the upper troposphere; the<br />
region; the streamlines show a trough approaching the magnitude <strong>of</strong> this process will be examined further below.<br />
In addition, there is substantial inflow in the middle levels,<br />
much <strong>of</strong> it from the continent. From the cloud pattern and<br />
the higher temperatures in the eye it is clear that<br />
subsidence occurs there in the upper troposphere [cf.<br />
l, Villoughby, 1988], but the total mass involved would<br />
50N<br />
40N<br />
30N<br />
/,.4' ,:<br />
20N i[!:']]i]!i?J:L -' ....... ' ...b... ..l._..k ..,...: ......... ,__ ! ................ j._]-:_ r-<br />
I .... :: ..... , .... . .... ,_,,,., , ,_:__<br />
::::::::::::::::::::::::::::::::::::::<br />
[ [,- :::: ..: [ i : ',<br />
ton :::::::::::::::::::::: .... L. Zzz=:L..':::;':.:[.._, ........... .... a--g---o ....... : ......... , ..... , ....<br />
IOOE 1 fOE IEOE 130E 140E 150E 160E<br />
Figure 16. Velocity potential and divergent wind<br />
component at 1000 hPa for 0000 UT, September 27, 1991.<br />
Wind vectors in meters per second. Velocity potential in<br />
10 n m 2 s ']. Maximum vector (near eye) is 9 meters per<br />
second.<br />
Figure 17. Velocity potential and divergent wind<br />
component at 700 hPa for 0000 UT, September 27, 1991.<br />
Wind vectors in meters per second. Velocity potential in<br />
104 m 2 s ']. Maximum vector (near eye) is 6 meters per<br />
second.<br />
100 I/<br />
H<br />
199<br />
150 / .<br />
'' ,' ,',, -- d'-'. -.. .<br />
300 ' ;/" '""'* '[ '" ' "<br />
500 '<br />
'ZOO , ,<br />
1000 ' ' :'.' . i .<br />
EE.0N E6.0N :30.0 34 0 :38.0<br />
127 5E 127 5E 127 5 127 5 127 5 127 5<br />
Figure 18. Cross section <strong>of</strong> vertical motion through<br />
Mirefile (located at about 30øN, 127.5øE) from ECMWF<br />
analysis at 0000 UT, September 27, 1991 based on<br />
divergent wind calculated from ECMWF data. Units,<br />
Pascals per second. Contour interval is 0.2.
NEWELL ET AL' DC-8 SAMPLING OF TYPHOON MIREILLE<br />
net income flux net income flux<br />
-0.137<br />
-0.338 -0.201 5.576<br />
1.451<br />
-4.124<br />
lflO hPa lot hPa<br />
II<br />
-5.032 -<br />
150 hPa<br />
- -5.309<br />
+<br />
-1.202<br />
+<br />
-<br />
15fl hPa<br />
= -2.253<br />
+<br />
-7.424 -<br />
2fit hPa<br />
- -10.224<br />
+<br />
-1.726<br />
+<br />
-<br />
200 hPa<br />
-- -5.329<br />
+<br />
-6.155 -<br />
258 hPa.<br />
- -4.167<br />
+<br />
-0.679<br />
+<br />
-<br />
25fl hPa<br />
-- -5.928<br />
+<br />
-4.096<br />
+<br />
-<br />
3Off hPa<br />
- 0.471<br />
+<br />
0.230<br />
+<br />
-<br />
300 hPa<br />
-- -3.377<br />
+<br />
-3.894<br />
q-<br />
-<br />
4tO hPa<br />
- 0.299<br />
+<br />
-0.685<br />
+<br />
-<br />
4fir hPa<br />
-- -3.187<br />
+<br />
0.710 -<br />
5fit hPa<br />
- 0.872<br />
+<br />
-0.578<br />
+<br />
-<br />
5fit hPa<br />
-- -0.360<br />
q-<br />
7.730 -<br />
7fit hPa<br />
- 4.894<br />
+<br />
3.296<br />
+<br />
-<br />
' 7fit hPa<br />
-+- 4.703<br />
7.722 -<br />
850 hPa<br />
- 4.372<br />
+<br />
3.149<br />
+<br />
-<br />
850 hPa<br />
-- 5.231<br />
+<br />
10.302 -<br />
1 tilt hPa<br />
- 8.591 3.771 -<br />
1 tilt hPa<br />
-.- 6.375<br />
W E S N<br />
Figure 19. Example <strong>of</strong> mass flux components across the walls <strong>of</strong> the box in Figure 16 for September<br />
27, 1991, based on divergent wind calculated from ECMWF data. Units, 10 9 kg s -1 .<br />
appear to be only a small fraction <strong>of</strong> that carded upward in<br />
the cloud regions. In an effort to estimate the vertical<br />
motion in central core, it is assumed that the heat balance<br />
<strong>with</strong>in the core is between adiabatic compression and<br />
radiative cooling. The relationship is<br />
to 3p<br />
RT Q<br />
pCp = p = W[Fd- F]<br />
(4)<br />
1867<br />
The ECMWF cross section <strong>of</strong> vertical motion through<br />
the storm (Figure 18) is not inconsistent <strong>with</strong> these low<br />
values. In fact, the subsidence in the eye is rather limited,<br />
and the cylindrical volume shown could be regarded as a<br />
Taylor column, as outlined further below. These<br />
conclusions do not agree <strong>with</strong> the relatively large sinking<br />
motion at 5 km in the core suggested by Willoughby<br />
[19881.<br />
6. Large-Scale Mass Flux<br />
where F 4 is the dry adiabatic lapse rate (= g/Cv, about<br />
10øC km 4) and F = - 3T/3z. Q was calculated from the<br />
nearest radiosonde to the eye <strong>with</strong> good data. Station A 17 1/2 ø x 17 1/2 ø latitude-longitude box was drawn<br />
47807 at 33.5øN, 130.4øE at 0600 UT was used. To surrounding the typhoon (Figure 16), and flow into and out<br />
simulate conditions in the eye, air temperature was <strong>of</strong> the box was evaluated each day from the divergem wind<br />
increased by 6øC at 250 hPa between the environment and component. An example appears in Figure 19 where it is<br />
the eye, tapering to IøC at 100 hPa and 3øC at 700 hPa. evident that the majority <strong>of</strong> the ifflow occurs below 500<br />
Specific humidity was taken directly from the sounding. hPa. We are interested here in the mass flux passing<br />
Cooling rates calculated for the upper troposphere were between the boundary layer and the free troposphere and<br />
about 3.3øC d 'l. The local lapse rate was 7.7øC km 'l. The have therefore calculated the vertical flux through 850 hPa.<br />
value for w was thus -1.7 cm s-l, a small subsidence. Values in Table 2 show that <strong>Mireille</strong> was sampled on the<br />
day <strong>of</strong> maximum mass flux, 29 x 109 kg s -1 These values<br />
Table 2. Mass Flux From Lower to Upper Troposphere<br />
are compared <strong>with</strong> Typhoon Orchid sampled on October 8,<br />
in Table 2; <strong>Mireille</strong> has about double the flux by Orchid<br />
but clearly a larger sample needs to be studied and<br />
1991<br />
Flux per Unit Area<br />
10 -3 kg m '2 s '1<br />
Total Flux<br />
10 9 kg s 4<br />
compared <strong>with</strong> the flux by middle-latitude cyclones before<br />
the overall significance <strong>of</strong> these values from <strong>Mireille</strong> can<br />
be assessed. It would also be valuable to make an estimate<br />
September 24<br />
<strong>Supertyphoon</strong> Mirei lle<br />
5 20<br />
<strong>of</strong> the actual area involved in the rising motion, perhaps by<br />
using weather radar. It is also worth noting from Figure 19<br />
that as well as the boundary layer, the next two layers<br />
September 25<br />
September 26<br />
September 27<br />
September 28<br />
September 29<br />
6<br />
6<br />
9<br />
5<br />
3<br />
21<br />
27<br />
29<br />
19<br />
13<br />
above also contribute substantially to the mass flux through<br />
the system. For example, the 700- to 500-hPa layer<br />
contributes about 20 x 10 v kg s - <strong>with</strong> at least one third <strong>of</strong><br />
this material coming in from the adjacent Asian continent<br />
to the west, as may be seen from Figure 17.<br />
Typhoon Orchid<br />
Is the typhoon important in the general circulation in<br />
carrying trace constituents into the upper troposphere?<br />
October 5<br />
October 6<br />
October 7<br />
October 8<br />
October 9<br />
October 10<br />
3<br />
4<br />
5<br />
5<br />
4<br />
5<br />
14<br />
17<br />
20<br />
18<br />
15<br />
16<br />
This question is examined below for the case <strong>of</strong> DMS.<br />
The PEM-West missions showed that DMS only<br />
reached the free troposphere from the boundary layer on<br />
three occasions: on September 16 over the North Pacific on<br />
a day <strong>of</strong> very strong convection as seen from the cloud<br />
videos; on September 27 in association <strong>with</strong> typhoon<br />
<strong>Mireille</strong>; and on October 8 in association <strong>with</strong> typhoon
1868 NEWELL ET AL: DC-8 SAMPLING OF TYPHOON MIREILLE<br />
100<br />
90<br />
80<br />
70<br />
60<br />
50<br />
40<br />
30<br />
20<br />
10<br />
0<br />
OKI<br />
DATE<br />
Figure 20a. Surface ozone variation at Oki Island<br />
(36.3øN, 133.2øE) in the period September 17 to October<br />
23, 1991 (provided by H. Akimoto). Units, parts per<br />
billion by volume.<br />
z<br />
o<br />
lOO<br />
90<br />
80<br />
70<br />
60<br />
50<br />
40<br />
30<br />
20<br />
lO<br />
o<br />
KENTING<br />
DATE<br />
Figure 20b. Surface ozone variation at Kenting, Taiwan<br />
(22øN, 120øE), in the period September 5 to October 3,<br />
1991 (provided by C.M. Liu). Units, parts per billion by<br />
volume.<br />
Orchid (Table 3). For typhoon <strong>Mireille</strong> the mass <strong>of</strong><br />
sulphur carried as DMS to the free troposphere from the<br />
Where 30½/3z > 0 and the system is stable, the air spreads<br />
out horizontally, forming the layers noted. A summary <strong>of</strong><br />
boundary layer can be estimated from the values for total the properties <strong>of</strong> these layers is given elsewhere in this<br />
mass flux derived above in conjunction <strong>with</strong> the mass issue [Newell et al., this issue], where it can be seen that<br />
mixing ratio <strong>of</strong> DMS. The molecular weight <strong>of</strong> DMS is<br />
62, and the conversion to equivalent mass <strong>of</strong> sulphur from<br />
the characteristics <strong>of</strong> Figure 6 are fairly typical.<br />
volume mixing ratio <strong>of</strong> DMS is therefore (ppv) x (62/28.9) 8. Ozone From Surface Stations<br />
x (32/62) = 1.11. For a boundary layer mixing ratio <strong>of</strong> 80<br />
pptv and a mass flux from Table 1 <strong>of</strong> 9 x 10-*kg m -2 s 'l, The only surface station <strong>sampling</strong> trace constituems<br />
the flux <strong>of</strong> sulphur to the free troposphere is 80 x 1.11 x which was close to the path <strong>of</strong> <strong>Mireille</strong> was Oki Island<br />
10 -12 x9x 10 -3kgS m '2 s 'l, or69 gSm '2d 'l. This (36.3øN, 133.2øE), which was in operation as part <strong>of</strong> the<br />
compares <strong>with</strong> recent estimates <strong>of</strong> surface oceanic DMS experimem "Perturbation by East Asian Continental Air<br />
sulphur flux which have yielded 96 g S m '2 d 'l at 30øN in Mass to Pacific Oceanic Troposphere" (PEACAMPOT). It<br />
the central Pacific [Quinn et al., 1990], 227 g S m -2 d 'l in is noteworthy that ozone mixing ratios as the eye passed<br />
the equatorial Pacific [Bates et al., 1993], and 27 gg S m '2 over Oki at-4200 UT were down to 5.5 ppbv (Figure 20a).<br />
d -I in the Northeast Pacific [Bates et al., 1994]. Typhoon The station at Kenting, Taiwan (22øN, 120.9øE) reported a<br />
<strong>Mireille</strong> therefore generated a DMS sulphur flux into the value <strong>of</strong> about 3 ppbv on September 27 (Figure 20b), when<br />
upper free troposphere comparable to that normally the surface pressure in the Kenting area was about 1007<br />
associated <strong>with</strong> the flux from the ocean into the boundary hPa. At 0600 UT on September 26, <strong>Mireille</strong> was about<br />
layer.<br />
550 km to the northeast <strong>of</strong> Kerning, and there was a trough<br />
The use <strong>of</strong> machine analysis may underestimate the<br />
mass flux circulating through the typhoon system, as the<br />
radiosonde wind fields may be smoothed excessively. Table 3. Mixing Ratios <strong>of</strong> Dimethylsulfide (DMS) in the<br />
There are relatively few estimates <strong>of</strong> the mass flux in the<br />
literature. McBride [ 1981] used about 800 rawinsondes to<br />
Boundary Layer and the Upper Troposphere<br />
make a composite <strong>of</strong> Pacific typhoons and computed<br />
,,.,,,.:oence from the surface to 350 hPa as 28 x 10 -3 kg<br />
m -2 s -I evaluated over an 8 ø diameter circle, while our<br />
value from Figure l0 for the surface to 400 hPa is 21<br />
x 10 -3 kg m -2 s -I evaluated over an area about 6 times as<br />
large.<br />
Mission 1991<br />
4 September 16<br />
5 September 18<br />
6 September 22<br />
7 September 24<br />
Boundary Layer<br />
320,260<br />
170<br />
30, 40<br />
35, 12<br />
>8 km<br />
0<br />
90<br />
3-6<br />
4<br />
8 September 25 90, 110, 80 2<br />
7. Small-Scale Features<br />
9 September 27 95 80<br />
10 October 1 120 2<br />
During the descent to the boundary layer at 0228 UT<br />
near 28øN, 136øE the aircraft measured the vertical pr<strong>of</strong>iles<br />
<strong>of</strong> ozone and water vapor shown in Figure 6. The layered<br />
structure between about 5 and 6 km shows that watervapor-rich<br />
air is associated <strong>with</strong> lower ozone than watervapor-poor<br />
air. These layers seem to be about 400 m thick;<br />
similar layers show in the lidar echoes near to the center <strong>of</strong><br />
the eye (Plate 3b). They appear to provide evidence <strong>of</strong> air<br />
from the boundary layer folded into higher levels, probably<br />
by convective processes. It is noteworthy that for this to<br />
11<br />
12<br />
13<br />
14<br />
15<br />
16<br />
17<br />
18<br />
19<br />
20<br />
October 2<br />
October 4<br />
October 6<br />
October 8<br />
October 12<br />
October 13<br />
October 15<br />
October 18<br />
October 19<br />
October 20<br />
11, 8<br />
45, 48<br />
34<br />
65<br />
30<br />
22, 27, 30/38<br />
35<br />
23<br />
24, 30<br />
2<br />
2<br />
45<br />
5<br />
2<br />
6<br />
6<br />
3<br />
2<br />
occur, there must be substantial instability; that is, 30e/3Z <<br />
0. (0½ is equivalent potemial temperature and z is altitude.) Units: Parts Per Trillion by Volume
NEWELL ET AL: DC-8 SAMPLING OF TYPHOON MIREILLE 1869<br />
in the direction <strong>of</strong> Kenting associated <strong>with</strong> the imerplay observations were not taken in the maximum velocity<br />
that had been taking place between Typhoon <strong>Mireille</strong> and region gives a reasonable time <strong>of</strong> about 4 days, well <strong>with</strong>in<br />
Typhoon Nat which had previously passed over Kenting. the C2H6 lifetime. It is clear that convection anywhere<br />
The low ozone values at Kenting (Figure 20b) may have along the back trajectory could have introduced the<br />
been associated <strong>with</strong> air which had been brought up from material into the upper troposphere and that the vertical<br />
the lower latitudes by the typhoons. Unfortunately, the<br />
station power was turned <strong>of</strong>f during the passage <strong>of</strong><br />
Typhoon Nat on September 23. In the case <strong>of</strong> Oki the<br />
transfer is more easily understood, as the eye passed over<br />
shear could have produced a vertical gradient <strong>of</strong> C2H6,<br />
such as was observed landing at Tokyo, where values at<br />
7.5 km were about double those in the boundary layer.<br />
the station (see Figure 1). The low (5 ppbv) ozone values<br />
here are in general agreement <strong>with</strong> those reported by lidar<br />
11. Photochemical Environment<br />
in the tropospheric region <strong>of</strong> the eye (see Plate 3). We<br />
speculate that the eye region is a cylindrical sample <strong>of</strong> Although a detailed description <strong>of</strong> the photochemical<br />
tropical air "packaged" by the circulation which has a environment <strong>of</strong> typhoon <strong>Mireille</strong> is not the main focus <strong>of</strong><br />
continuity rather like that <strong>of</strong> a classical Taylor column. this paper, for purposes <strong>of</strong> completeness the authors have<br />
Taylor [1923] performed some experiments to check an summarized some <strong>of</strong> the general photochemical features <strong>of</strong><br />
analysis by Proudman [1916] which showed that all slow this system and have then comrasted these to air parcels<br />
steady motions <strong>of</strong> a rotating liquid must be two sampled in the same geographical region under<br />
dimensional. Taylor showed that when a sphere or nontyphoon conditions. For example, in Figure 4d the<br />
cylinder is pulled across a rotating tank <strong>of</strong> water, it is observed mixing ratios for the photochemical products<br />
accompanied by a cylinder <strong>of</strong> water above it having the H202 and CH3OOH are reported as a time series, together<br />
same diameter. He did this by ejecting dye into the water <strong>with</strong> model-calculated pr<strong>of</strong>iles <strong>of</strong> the centrally important<br />
above the sphere or cylinder and noting that it diverged oxidizing species, the hydroxyl radical. If the midday time<br />
around an imaginary cylinder above the sphere or cylinder. period <strong>of</strong> 0330 UT to 0540 UT is examined, it can be<br />
If dye was ejected into the imaginary cylinder, it stayed shown that the median level <strong>of</strong> H20 2 (based on 3-min<br />
inside the cylinder and moved across the tank <strong>with</strong> it. It is averaged data) is 1032 pptv, whereas that for CH3OOH is<br />
this imaginary cylinder which is called a Taylor column. considerably lower, being 193 pptv. Model-estimated OH<br />
Yih [1977] reports that Taylor also experimemed <strong>with</strong> fish concentrations for this same time period ranged from 1.6 x<br />
in the tank, and they would try to avoid the cylinder as if 106 to 8.1 x 10⁶ molecules cm -3, giving a median value <strong>of</strong><br />
sensing the presence <strong>of</strong> a solid obstacle. Low mixing 3.6 x 10⁶ molecules cm '3. Some <strong>of</strong> the highest estimated<br />
ratios <strong>of</strong> tropical ozone found in both the laser images OH values are seen for those times when the aircraft was<br />
(Plate 3) and in the Oki surface station data (Figure 20a) approaching or passing through the eye wall region; it was<br />
are thought to correspond to the dye in the experiment. at these times when highly elevated levels <strong>of</strong> NO were<br />
The equivalent potential temperature computed from the observed by the Georgia Tech instrument. By way <strong>of</strong><br />
ECMWF data (Figure 21) shows neutral stabili .ty near the contrast to the typhoon environment, clear air observations<br />
typhoon center, but again the linfited horizontal resolution over a similar altitude range and geographical location as<br />
must be borne in mind.<br />
9. Total Ozone Relationships<br />
typhoon <strong>Mireille</strong> gave midday median mixing ratios for<br />
H202 and CH3OOH <strong>of</strong> 412 and 125 pptv, respectively; and<br />
the av, erage midday median OH level was estimated at 2.1<br />
x 10 ø molecules cm '3. Thus one might tentatively<br />
There have been several studies <strong>of</strong> the association<br />
between total ozone and tropical cyclones, including those<br />
in the western North Pacific. Some rather complex<br />
relationships were found which depended on whether the<br />
systems were intensifying or not intensifying [e.g., Stout<br />
and Rodgers, 1992]. We were provided <strong>with</strong> Total Ozone<br />
conclude that the typhoon environment on average had an<br />
enhanced photochemical environment relative to the<br />
background upper troposphere. For further details on the<br />
photochemistry <strong>of</strong> this system, the reader is referred to<br />
other papers in this issue [e.g., Davis et al. and Heikes et<br />
Measurements Satellite (TOMS) data each day in the field,<br />
and after the mission we obtained digital data. The maps<br />
12. Conclusions<br />
for September 26-27 showed no special relationship<br />
between <strong>Mireille</strong> and total ozone in accord <strong>with</strong> the lidar As noted in the introduction, typhoons were sometimes<br />
and cirrus cross sections discussed earlier. These thought to draw stmtospheric air down into the upper<br />
comments apply to the region we could measure directly. troposphere. Ostlund [1968] found experimemal evidence<br />
The question concerning stratosphere to troposphere for such transfer from aircraft measurements <strong>of</strong> tritium<br />
exchange outside the eye cannot be examined which, like ozone, is higher in the stratosphere than in the<br />
experimentally <strong>with</strong> our measurements. However, it was troposphere. The DC-8 exploration <strong>of</strong> <strong>Mireille</strong> found no<br />
noted that high potential vorticity (PV) values were experimental evidence for this process in the lidar<br />
indicated on the ECMWF 315K analysis drawn up for this measurements <strong>of</strong> ozone; in fact, lidar measurements in the<br />
experiment.<br />
middle troposphere were very low. Them was evidence,<br />
particularly from DMS, that boundary layer air was carded<br />
into the upper troposphere. The maximum vertical<br />
10. Possible Remote Sources<br />
transport seems to occur in the wall cloud region; some <strong>of</strong><br />
the DMS-rich air which reaches the upper troposphere<br />
A cross section along the Asian coast <strong>of</strong> the zonal flow moves into the eye and subsides, while the majority is in<br />
(not shown; see Bachmeier et al. [this issue] for related the divergent flow that spreads out in the upper<br />
data) illustrates that material may have entered the region<br />
from the west. This material could have reached the Asian<br />
troposphere. There is therefore a net transport <strong>of</strong> sulphur<br />
from the boundary layer to the upper free troposphere.<br />
west coast from Europe in a few days. Even allowing for<br />
meridional meandering and the fact that aircraft<br />
Computations <strong>of</strong> the irrotational component <strong>of</strong> the flow<br />
suggest that the boundary layer from a large area is drawn
1870 NEWELL ET AL' DC-8 SAMPLING OF TYPHOON MIREILLE<br />
lOO<br />
15o<br />
200<br />
250<br />
300<br />
400<br />
5OO<br />
600<br />
700<br />
850<br />
lOOO<br />
30 N<br />
126.5 E<br />
ß , J<br />
320 360 400<br />
lOO<br />
150<br />
200<br />
250<br />
300<br />
400<br />
5OO<br />
600<br />
700<br />
lOO<br />
15o<br />
200<br />
250<br />
300<br />
400<br />
500<br />
600<br />
70O<br />
850<br />
1000<br />
280<br />
30 N 100<br />
127.5 E<br />
328 360 488<br />
29 N lOO<br />
127.5 E<br />
850 850<br />
, a , , , , \, ' , , , i<br />
K<br />
150<br />
200<br />
a 250<br />
300<br />
400<br />
500<br />
60O<br />
700<br />
850<br />
1000<br />
280<br />
1000 1000<br />
ß<br />
'<br />
288 320 360 400<br />
288 328 368<br />
488<br />
150<br />
2OO<br />
a 250<br />
300<br />
400<br />
500<br />
60O<br />
70O<br />
31 N<br />
127.5 E<br />
K K<br />
30 N<br />
128.5 E<br />
, ,t , , , ! '1' , i ,<br />
320 360 400<br />
Figure 21. Potential temperature (solid lines) and equivalent potemial temperature (dashed lines) for<br />
points near the eye center on September 27, 1995 at 0000 UT, based on ECMWF analysis.<br />
into the central region. The mass flux from the boundaN<br />
layer to the free troposphere by <strong>Mireille</strong> reaches 3 x 10 lø<br />
kg s -1, peaking on the day the typhoon was sampled by the<br />
DC-8. This is about 50% greater than the flux from<br />
typhoon Orchid, which the DC-8 passed through on<br />
October 8, and almost triple the flux from an active<br />
cyclone in the Noah Pacific on September 6, 1991 (values<br />
not shown). The flux <strong>of</strong> sulphur as DMS transported into<br />
the upper free troposphere is approximately 69 gg S m '2<br />
d 'l, which is estimated to be nearly half the mean flux<br />
from the ocean into the boundary layer. To assess the<br />
importance <strong>of</strong> typhoons in the global sulphur budget, more<br />
samples are required and these, in turn, will need to be<br />
incorporated into a global model to form an assessment.<br />
Boundary layer marine air was found to be low in the<br />
tracer species 03, CO, CS2, C2H2, C2H6 C3H8, and C2H6,<br />
and rich in DMS. In the upper levels <strong>of</strong> ihe eye region and<br />
in the outflow region, NMHCs, 03, and CS2 were found to<br />
be far more abundant, and modest increases in CO were<br />
also observed. These enhancements may have arisen if<br />
some <strong>of</strong> the air involved entered the system in the lower or<br />
middle troposphere from the continent. The trace gas NO<br />
was in some cases nearly 2 orders <strong>of</strong> magnitude higher<br />
than in the boundary layer, and them is evidence that one<br />
<strong>of</strong> the important sources <strong>of</strong> this NO was in situ production<br />
from lightning [see Davis et al., this issue]. The DMS<br />
appears to have originated from the marine boundary layer,<br />
although some <strong>of</strong> this may have entered the system from<br />
the coastal regions, as suggested by Plate 2. The trace gas<br />
SO2 may have been entrained from the vicinity <strong>of</strong> Japan as<br />
a result <strong>of</strong> volcanic activity.<br />
In <strong>sampling</strong> Typhoon <strong>Mireille</strong>, it is important to<br />
recognize that both continental and marine boundary layers<br />
were mixed together by the typhoon's circulation patterns.<br />
Thus in view <strong>of</strong> the fact that the continental boundary layer<br />
was not sampled directly, it is difficult to distinguish<br />
contributions from the continental boundary layer and the<br />
continental free troposphere.<br />
K
NEWELL ET AL' DC-8 SAMPLING OF TYPHOON M! REILLE 1871<br />
The low ozone in the eye region, shown by the lidar<br />
measurements and by Oki Island station, may have been<br />
transported directly from low latitudes in a process akin to<br />
a Taylor column. Low ozone values al<strong>of</strong>t would also fit<br />
<strong>with</strong> an ultimate low-latitude source for the air in the eye<br />
region. Ostlund (1968) also mentioned that some <strong>of</strong> his<br />
tritium results could be explained if the eye contained old<br />
air which had been trapped since the formation <strong>of</strong> the<br />
circulation. Finally, the NMHC data suggest the<br />
possibility that distant sources to the west may contribute<br />
to material found in the typhoon.<br />
Acknowledgments. The work was supported under the<br />
<strong>NASA</strong> GTE program grant NAG-l-1252. We acknowledge help<br />
in the field <strong>with</strong> real-time trajectory analyses and afterward <strong>with</strong><br />
data from ECMWF. The meteorological staff at Yokota Air Base<br />
kindly helped throughout the <strong>Mireille</strong> flight and provided<br />
analyzed synoptic maps afterward.<br />
Quinn, P. K., T. S. Bates, and J. E. Johnson, Interactions between<br />
the sulphur and the reduced nitrogen cycles over the central<br />
Pacific Ocean, J. Geophys. Res., 95, 16,405-16,416, 1990.<br />
Rudolph, D. K., and C. P. Guard, 1991 Annual Tropical Cyclone<br />
Report, pp. 108-111, Joint Typhoon Warning Cent.,<br />
COMNAVMARIANAS, Guam, Mariana Islands, 1992.<br />
Singh, H. B., Reactive nitrogen in the troposphere, Environ. $ci.<br />
Technol., 21,320-327, 1987.<br />
Stout, J., and E. B. Rodgers, Nimbus-7 total ozone observations<br />
<strong>of</strong> western North Pacific tropical cyclones, J. Appl. Meteorol.,<br />
31,758-783, 1992.<br />
Taylor, G.I., Experiments on the motion <strong>of</strong> solid bodies in<br />
rotating fluids, Proc. R. $oc. London, A, 104, 213-218, 1923.<br />
Willoughby, H. E., The dynamics <strong>of</strong> the tropical cyclone core,<br />
Aust. Meteorol. Mag., 36, 183-191, 1988.<br />
Yih, C. S., Fluid Mechanics, p. 82, West River Press, Ann Arbor,<br />
Mich., 1977.<br />
References<br />
H. Akimoto, University <strong>of</strong> Tokyo, 4-6-1 Komaba Meguro-ku,<br />
Tokyo 153 305, Japan. (e-mail: akimotothj@tansei.cc.u-<br />
Bachmeier, A. S., R. E. Newell, M. C. Shiphain, Y. Zhu, D. R. tokyo.ac.jp)<br />
Blake, and E. V. Browell, PEM-West A meteorological B. E. Anderson, E. V. Browell, G. L. Gregory, G. W. Sachse<br />
overview, d. Geophys. Res., this issue.<br />
and M. C. Shipham, <strong>NASA</strong> Langley Research Center, Hampton,<br />
Bates, T. S., K. C. Kelly, and J. E. Johnson, Concentrations and VA 23681. (e-mail' b.e.anderson@larc.nasa.gov'<br />
fluxes <strong>of</strong> dissolved biogenic gas (DMS, CH4, CO, CO2) in<br />
the equatorial Pacific during the SAGA 3 experiment, d.<br />
Geophys. Res., 98, 16,969-16,977, 1993.<br />
Bates, T. S., R. P. Kiene, G. V. Wolfe, P. A. Matrai, F. P. Chavez,<br />
K.R. Buck, B.W. Blomquist, and L. Cuhel, The cycling <strong>of</strong><br />
sulphur in surface seawater <strong>of</strong> the Northeast Pacific, d.<br />
Geophys. Res., 99, 7835-7843, 1994.<br />
Bergeron, T., Reviexvs <strong>of</strong> Modem Meteorology, 12, The problem<br />
<strong>of</strong> tropical hurricanes, Q. d. R. Meteorol. Soc., 80, 131-164,<br />
1954.<br />
e.v.browelllarc.nasa.gov; g.l.gregory@larc.nasa.gov'<br />
g.w. sachselarc.nasa. gov; shiphamweathennan. larc.nasa.gov)<br />
A. S. Bachmeier, Lockheed Engineering and Sciences, Co.,<br />
Hampton, VA 23681. (e-mail: a.s.bachmeier@larc.nasa.gov)<br />
A. R. Bandy and D.C. Thornton, Drexel University,<br />
Philadelphia, PA 19104. (e-lnail: arb@ac 1.chemistry.drexel.edu;<br />
dctac 2. chemistry. drexel.edu)<br />
D. R. Blake and F. S. Rowland, University <strong>of</strong> California at<br />
Irvine, Irvine, CA 92717. (e-mail: dblakeorion.oac.uci.edu;<br />
rowlanduci. edu)<br />
Crosley, D. R., NOy Blue Ribbon panel, d. Geophys. Res., this<br />
issue.<br />
J. D. Bradshaw, J. H. Crawford, D. D. Davis and S. T.<br />
Sandholm, Georgia Institute <strong>of</strong> Technology, Atlanta, GA 30332.<br />
Danielsen, E. F., Review <strong>of</strong> trajectory methods, Adv. Geophys., (e-mail' jb57prism.gatech.edu; crawford@montreal.eas.<br />
18(B), 73-94, 1974.<br />
gatech.edu; dd 16@acme.gatech.edu; ss27@ prism.gatech.edu)<br />
Davis, D. D., et al., Assessment <strong>of</strong> ozone photochemistry in the<br />
W. Brockett, L. DeGreef, D. Lewis, D. McComfick, and E.<br />
western North Pacific as inferred from PEM-West A Monitz, Ames Science and Applications Aircraft Division, <strong>NASA</strong><br />
observations during fall 1991, d. Geophys. Res., this issue.<br />
Ames Research Center, M<strong>of</strong>fett Field, CA 94035.<br />
Gregory, G. L., A. S. Bachmeier, D. R. Blake, B. G. Heikes, D. J. E. Collins Jr., Science and Technology Corp., Hampton,<br />
C. Thornton, A. R. Bandy, J. D. Bradshaw, and Y. Kondo, V^ 23681. (e-mail: j.e. collinslarc.nasa. gov)<br />
Chemical signatures <strong>of</strong> aged Pacific narine air: Mixed layer J. E. Dibb and R. W. Talbot, University <strong>of</strong> New Hampshire,<br />
and free troposphere as measured during PEM-West A, J. Durham, NH 03824. (e-mail: rwt@christa.unh.edu)<br />
Geophys. Res., this issue.<br />
B. G. Heikes and J. T. Merrill, University <strong>of</strong> Rhode Island,<br />
Heikes, B. G., et al., Hydrogen peroxide and peroxide Kingston, RI 02881. (e-mail: zagarnotos.gso.uri.edu;<br />
distributions related to ozone and odd hydrogen over the jm errillboreas.gso. uri. edu)<br />
North Pacific in the fall <strong>of</strong> 1991, d. Geophys. Res., this issue. R. E. Newell (corresponding author), W. Hu, Z-X. Wu, and Y.<br />
Hoell, J. M., D. D. Davis, S.C. Liu, R. E. Newell, M. C. Zhu, Massachusetts Institute <strong>of</strong> Technology, 54-1824, 77<br />
Shipham, H. Akimoto, R. J. McNeal, R. J. Bendura, and J. W. Massachusetts Avenue, Cambridge, N 02 o r .... .<br />
Drewry, Pacific Exploratory Mission-West A (PEM-West A): newell(}newell 1. mit. edu)<br />
September-October, 1991, d. Geophys. Res., this issue.<br />
K. K. Kelly and S.C. Liu, NOAA Aeronomy Laboratory,<br />
Holland, G. J., On the climatology and structure <strong>of</strong> tropical<br />
R/E/AL-4, 325 Broadway, Boulder, CO 80303. (e-mail:<br />
cyclones in the Australian/southwest Pacific region, I, Data liual.noaa.gov)<br />
and tropical stonns, Aust. Meteorol. Mag., 32, 10-15, 1984. Y. Kondo and M. Koike, Nagoya University, Japan. (e-mail:<br />
McBride, J. L., Observational analysis <strong>of</strong> tropical cyclone kondostelab.nagoya-u.ac.jp; koikestelab.nagoya-u.ac.jp)<br />
formation, 1, Basic description <strong>of</strong> data sets, J. Atmos. Sci., 38, C.-M. Liu, Department <strong>of</strong> <strong>Atmospheric</strong> Science, National<br />
1117-1131, 1981.<br />
Taiwan University, Taipei, Taiwan. (e-mail'<br />
Merrill, J. T., Trajectory results and interpretation for PEM-West hucm@ccms.ntu. edu.tw)<br />
A, J. Geophys. Res., this issue.<br />
F. Sakamaki, National Institute for Environmental Studies,<br />
Newell, R. E., et al., Vertical fine-scale atmospheric structure Tsukuba, Japan.<br />
measured from the <strong>NASA</strong> DC-8 during PEM-West A, d. H. B. Singh, <strong>NASA</strong> Ames Research Center, M<strong>of</strong>fett Field,<br />
Geophys. Res., this issue.<br />
CA 94035. (e-mail: hanwant_singhqmgate.arc.nasa.gov)<br />
Ostlund, H. G., Hurricane tritium, II, Air-sea exchange <strong>of</strong> water<br />
in Betsy 1965, Tellus, 20, 577-594, 1968.<br />
Proudman, J., On the motion <strong>of</strong> solids in a liquid possessing (Received June 23, 1994; revised March 11, 1995;<br />
vorticity, Proc. R. Soc. London, A, 100, 114-121, 1916. accepted March 30, 1995.)