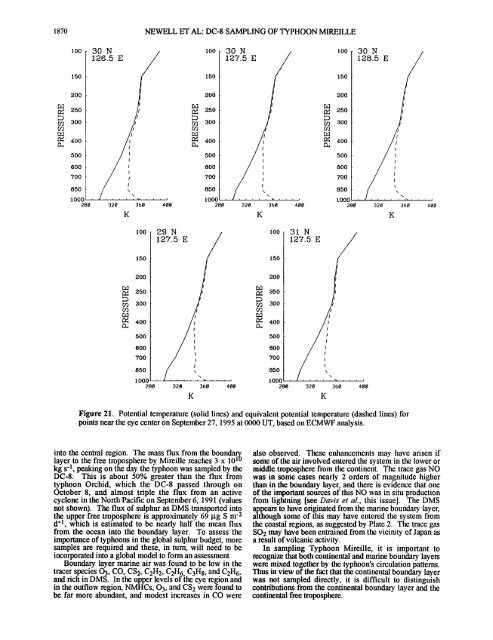
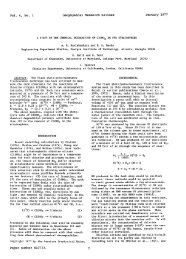
1870 NEWELL ET AL' DC-8 SAMPLING OF TYPHOON MIREILLE lOO 15o 200 250 300 400 5OO 600 700 850 lOOO 30 N 126.5 E ß , J 320 360 400 lOO 150 200 250 300 400 5OO 600 700 lOO 15o 200 250 300 400 500 600 70O 850 1000 280 30 N 100 127.5 E 328 360 488 29 N lOO 127.5 E 850 850 , a , , , , \, ' , , , i K 150 200 a 250 300 400 500 60O 700 850 1000 280 1000 1000 ß ' 288 320 360 400 288 328 368 488 150 2OO a 250 300 400 500 60O 70O 31 N 127.5 E K K 30 N 128.5 E , ,t , , , ! '1' , i , 320 360 400 Figure 21. Potential temperature (solid lines) and equivalent potemial temperature (dashed lines) for points near the eye center on September 27, 1995 at 0000 UT, based on ECMWF analysis. into the central region. The mass flux from the boundaN layer to the free troposphere by <strong>Mireille</strong> reaches 3 x 10 lø kg s -1, peaking on the day the typhoon was sampled by the DC-8. This is about 50% greater than the flux from typhoon Orchid, which the DC-8 passed through on October 8, and almost triple the flux from an active cyclone in the Noah Pacific on September 6, 1991 (values not shown). The flux <strong>of</strong> sulphur as DMS transported into the upper free troposphere is approximately 69 gg S m '2 d 'l, which is estimated to be nearly half the mean flux from the ocean into the boundary layer. To assess the importance <strong>of</strong> typhoons in the global sulphur budget, more samples are required and these, in turn, will need to be incorporated into a global model to form an assessment. Boundary layer marine air was found to be low in the tracer species 03, CO, CS2, C2H2, C2H6 C3H8, and C2H6, and rich in DMS. In the upper levels <strong>of</strong> ihe eye region and in the outflow region, NMHCs, 03, and CS2 were found to be far more abundant, and modest increases in CO were also observed. These enhancements may have arisen if some <strong>of</strong> the air involved entered the system in the lower or middle troposphere from the continent. The trace gas NO was in some cases nearly 2 orders <strong>of</strong> magnitude higher than in the boundary layer, and them is evidence that one <strong>of</strong> the important sources <strong>of</strong> this NO was in situ production from lightning [see Davis et al., this issue]. The DMS appears to have originated from the marine boundary layer, although some <strong>of</strong> this may have entered the system from the coastal regions, as suggested by Plate 2. The trace gas SO2 may have been entrained from the vicinity <strong>of</strong> Japan as a result <strong>of</strong> volcanic activity. In <strong>sampling</strong> Typhoon <strong>Mireille</strong>, it is important to recognize that both continental and marine boundary layers were mixed together by the typhoon's circulation patterns. Thus in view <strong>of</strong> the fact that the continental boundary layer was not sampled directly, it is difficult to distinguish contributions from the continental boundary layer and the continental free troposphere. K
NEWELL ET AL' DC-8 SAMPLING OF TYPHOON M! REILLE 1871 The low ozone in the eye region, shown by the lidar measurements and by Oki Island station, may have been transported directly from low latitudes in a process akin to a Taylor column. Low ozone values al<strong>of</strong>t would also fit <strong>with</strong> an ultimate low-latitude source for the air in the eye region. Ostlund (1968) also mentioned that some <strong>of</strong> his tritium results could be explained if the eye contained old air which had been trapped since the formation <strong>of</strong> the circulation. Finally, the NMHC data suggest the possibility that distant sources to the west may contribute to material found in the typhoon. Acknowledgments. The work was supported under the <strong>NASA</strong> GTE program grant NAG-l-1252. We acknowledge help in the field <strong>with</strong> real-time trajectory analyses and afterward <strong>with</strong> data from ECMWF. The meteorological staff at Yokota Air Base kindly helped throughout the <strong>Mireille</strong> flight and provided analyzed synoptic maps afterward. Quinn, P. K., T. S. Bates, and J. E. Johnson, Interactions between the sulphur and the reduced nitrogen cycles over the central Pacific Ocean, J. Geophys. Res., 95, 16,405-16,416, 1990. Rudolph, D. K., and C. P. Guard, 1991 Annual Tropical Cyclone Report, pp. 108-111, Joint Typhoon Warning Cent., COMNAVMARIANAS, Guam, Mariana Islands, 1992. Singh, H. B., Reactive nitrogen in the troposphere, Environ. $ci. Technol., 21,320-327, 1987. Stout, J., and E. B. Rodgers, Nimbus-7 total ozone observations <strong>of</strong> western North Pacific tropical cyclones, J. Appl. Meteorol., 31,758-783, 1992. Taylor, G.I., Experiments on the motion <strong>of</strong> solid bodies in rotating fluids, Proc. R. $oc. London, A, 104, 213-218, 1923. Willoughby, H. E., The dynamics <strong>of</strong> the tropical cyclone core, Aust. Meteorol. Mag., 36, 183-191, 1988. Yih, C. S., Fluid Mechanics, p. 82, West River Press, Ann Arbor, Mich., 1977. References H. Akimoto, University <strong>of</strong> Tokyo, 4-6-1 Komaba Meguro-ku, Tokyo 153 305, Japan. (e-mail: akimotothj@tansei.cc.u- Bachmeier, A. S., R. E. Newell, M. C. Shiphain, Y. Zhu, D. R. tokyo.ac.jp) Blake, and E. V. Browell, PEM-West A meteorological B. E. Anderson, E. V. Browell, G. L. Gregory, G. W. Sachse overview, d. Geophys. Res., this issue. and M. C. Shipham, <strong>NASA</strong> Langley Research Center, Hampton, Bates, T. S., K. C. Kelly, and J. E. Johnson, Concentrations and VA 23681. (e-mail' b.e.anderson@larc.nasa.gov' fluxes <strong>of</strong> dissolved biogenic gas (DMS, CH4, CO, CO2) in the equatorial Pacific during the SAGA 3 experiment, d. Geophys. Res., 98, 16,969-16,977, 1993. Bates, T. S., R. P. Kiene, G. V. Wolfe, P. A. Matrai, F. P. Chavez, K.R. Buck, B.W. Blomquist, and L. Cuhel, The cycling <strong>of</strong> sulphur in surface seawater <strong>of</strong> the Northeast Pacific, d. Geophys. Res., 99, 7835-7843, 1994. Bergeron, T., Reviexvs <strong>of</strong> Modem Meteorology, 12, The problem <strong>of</strong> tropical hurricanes, Q. d. R. Meteorol. Soc., 80, 131-164, 1954. e.v.browelllarc.nasa.gov; g.l.gregory@larc.nasa.gov' g.w. sachselarc.nasa. gov; shiphamweathennan. larc.nasa.gov) A. S. Bachmeier, Lockheed Engineering and Sciences, Co., Hampton, VA 23681. (e-mail: a.s.bachmeier@larc.nasa.gov) A. R. Bandy and D.C. Thornton, Drexel University, Philadelphia, PA 19104. (e-lnail: arb@ac 1.chemistry.drexel.edu; dctac 2. chemistry. drexel.edu) D. R. Blake and F. S. Rowland, University <strong>of</strong> California at Irvine, Irvine, CA 92717. (e-mail: dblakeorion.oac.uci.edu; rowlanduci. edu) Crosley, D. R., NOy Blue Ribbon panel, d. Geophys. Res., this issue. J. D. Bradshaw, J. H. Crawford, D. D. Davis and S. T. Sandholm, Georgia Institute <strong>of</strong> Technology, Atlanta, GA 30332. Danielsen, E. F., Review <strong>of</strong> trajectory methods, Adv. Geophys., (e-mail' jb57prism.gatech.edu; crawford@montreal.eas. 18(B), 73-94, 1974. gatech.edu; dd 16@acme.gatech.edu; ss27@ prism.gatech.edu) Davis, D. D., et al., Assessment <strong>of</strong> ozone photochemistry in the W. Brockett, L. DeGreef, D. Lewis, D. McComfick, and E. western North Pacific as inferred from PEM-West A Monitz, Ames Science and Applications Aircraft Division, <strong>NASA</strong> observations during fall 1991, d. Geophys. Res., this issue. Ames Research Center, M<strong>of</strong>fett Field, CA 94035. Gregory, G. L., A. S. Bachmeier, D. R. Blake, B. G. Heikes, D. J. E. Collins Jr., Science and Technology Corp., Hampton, C. Thornton, A. R. Bandy, J. D. Bradshaw, and Y. Kondo, V^ 23681. (e-mail: j.e. collinslarc.nasa. gov) Chemical signatures <strong>of</strong> aged Pacific narine air: Mixed layer J. E. Dibb and R. W. Talbot, University <strong>of</strong> New Hampshire, and free troposphere as measured during PEM-West A, J. Durham, NH 03824. (e-mail: rwt@christa.unh.edu) Geophys. Res., this issue. B. G. Heikes and J. T. Merrill, University <strong>of</strong> Rhode Island, Heikes, B. G., et al., Hydrogen peroxide and peroxide Kingston, RI 02881. (e-mail: zagarnotos.gso.uri.edu; distributions related to ozone and odd hydrogen over the jm errillboreas.gso. uri. edu) North Pacific in the fall <strong>of</strong> 1991, d. Geophys. Res., this issue. R. E. Newell (corresponding author), W. Hu, Z-X. Wu, and Y. Hoell, J. M., D. D. Davis, S.C. Liu, R. E. Newell, M. C. Zhu, Massachusetts Institute <strong>of</strong> Technology, 54-1824, 77 Shipham, H. Akimoto, R. J. McNeal, R. J. Bendura, and J. W. Massachusetts Avenue, Cambridge, N 02 o r .... . Drewry, Pacific Exploratory Mission-West A (PEM-West A): newell(}newell 1. mit. edu) September-October, 1991, d. Geophys. Res., this issue. K. K. Kelly and S.C. Liu, NOAA Aeronomy Laboratory, Holland, G. J., On the climatology and structure <strong>of</strong> tropical R/E/AL-4, 325 Broadway, Boulder, CO 80303. (e-mail: cyclones in the Australian/southwest Pacific region, I, Data liual.noaa.gov) and tropical stonns, Aust. Meteorol. Mag., 32, 10-15, 1984. Y. Kondo and M. Koike, Nagoya University, Japan. (e-mail: McBride, J. L., Observational analysis <strong>of</strong> tropical cyclone kondostelab.nagoya-u.ac.jp; koikestelab.nagoya-u.ac.jp) formation, 1, Basic description <strong>of</strong> data sets, J. Atmos. Sci., 38, C.-M. Liu, Department <strong>of</strong> <strong>Atmospheric</strong> Science, National 1117-1131, 1981. Taiwan University, Taipei, Taiwan. (e-mail' Merrill, J. T., Trajectory results and interpretation for PEM-West hucm@ccms.ntu. edu.tw) A, J. Geophys. Res., this issue. F. Sakamaki, National Institute for Environmental Studies, Newell, R. E., et al., Vertical fine-scale atmospheric structure Tsukuba, Japan. measured from the <strong>NASA</strong> DC-8 during PEM-West A, d. H. B. Singh, <strong>NASA</strong> Ames Research Center, M<strong>of</strong>fett Field, Geophys. Res., this issue. CA 94035. (e-mail: hanwant_singhqmgate.arc.nasa.gov) Ostlund, H. G., Hurricane tritium, II, Air-sea exchange <strong>of</strong> water in Betsy 1965, Tellus, 20, 577-594, 1968. Proudman, J., On the motion <strong>of</strong> solids in a liquid possessing (Received June 23, 1994; revised March 11, 1995; vorticity, Proc. R. Soc. London, A, 100, 114-121, 1916. accepted March 30, 1995.)