Atmospheric sampling of Supertyphoon Mireille with NASA ...
Atmospheric sampling of Supertyphoon Mireille with NASA ...
Atmospheric sampling of Supertyphoon Mireille with NASA ...

Create successful ePaper yourself
Turn your PDF publications into a flip-book with our unique Google optimized e-Paper software.
200<br />
180<br />
40<br />
80<br />
0<br />
40<br />
20<br />
800<br />
700<br />
5<br />
4<br />
2<br />
1<br />
loo<br />
90<br />
70<br />
60<br />
"--" 50<br />
1<br />
40<br />
Z 30<br />
20<br />
0<br />
1<br />
lo<br />
- o<br />
o lO<br />
E- 20<br />
50<br />
40<br />
20<br />
10<br />
30<br />
40<br />
50<br />
f I<br />
NEWELL ET AL: DC-8 SAMPLING OF TYPHOON MIREILLE 1859<br />
Crcle GA Inst Tech<br />
Star Kondo oø o ß<br />
o<br />
o<br />
o o<br />
2 3 4 5 6 7 8<br />
Qrele GA Inst Teeh<br />
Star Kondo<br />
o<br />
2 3 4 5 6 7 8<br />
**<br />
**<br />
**<br />
**<br />
*<br />
** *<br />
* ** **,<br />
**<br />
x , ** ,<br />
, ** ** ** ,x ** ** **<br />
2 3 4 5 6 7 8<br />
2 3 4 5 6 7 8<br />
HOUR CUT)<br />
AEROSOL 05 to 20 /<br />
2 3 4 5 E 6 7<br />
HOUR (UT)<br />
.o[<br />
o.o .... ....<br />
HOUR T)<br />
0.20[<br />
0.00 ..... [ .................................................... I<br />
1.5 2 2.5 3 3.5 4 4.5 5 5.5 6 6.5 7 7.5<br />
HOUR CUT)<br />
-25<br />
-30<br />
-35<br />
-48<br />
-45<br />
-50<br />
4 5<br />
3000<br />
1580<br />
1808<br />
580<br />
48<br />
38<br />
lO<br />
14<br />
13<br />
12<br />
11<br />
4 5<br />
Figure 4. (continued)<br />
9<br />
50 55 60 65 70 7 5<br />
50 55 60 65 70 7 5<br />
50 55 60 65 78 75<br />
58 55 00 65 /0 75<br />
HOUR (UT)<br />
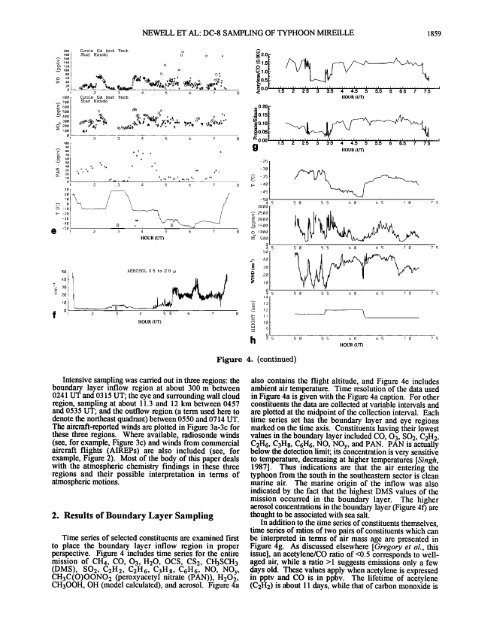
Intensive <strong>sampling</strong> was carried out in three regions: the also contains the flight altitude, and Figure 4e includes<br />
boundary layer inflow region at about 300 m between ambient air temperature. Time resolution <strong>of</strong> the data used<br />
0241 UT and 0315 UT; the eye and surrounding wall cloud in Figure 4a is given <strong>with</strong> the Figure 4a caption. For other<br />
region, <strong>sampling</strong> at about 11.3 and 12 km between 0457 constituents the data are collected at variable intervals and<br />
and 0535 UT; and the outflow region (a term used here to are plotted at the midpoint <strong>of</strong> the collection interval. Each<br />
denote the northeast quadrant) between 0550 and 0714 UT. time series set has the boundary layer and eye regions<br />
The aircraft-reported winds are plotted in Figure 3a-3c for marked on the time axis. Constituents having their lowest<br />
these three regions. Where available, radiosonde winds values in the boundary layer included CO, 03, SO2, C2H2,<br />
(see, for example, Figure 3c) and winds from commercial C2H6, C3H8, C6H6, NO, NOy, and PAN. PAN is actually<br />
aircraft flights (AIREPs) are also included (see, for below the detection limit; its concentration is very sensitive<br />
example, Figure 2). Most <strong>of</strong> the body <strong>of</strong> this paper deals to temperature, decreasing at higher temperatures [Singh,<br />
<strong>with</strong> the atmospheric chemistry findings in these three 1987]. Thus indications are that the air entering the<br />
regions and their possible interpretation in terms <strong>of</strong> typhoon from the south in the southeastern sector is clean<br />
atmospheric motions.<br />
marine air. The marine origin <strong>of</strong> the inflow was also<br />
indicated by the fact that the highest DMS values <strong>of</strong> the<br />
mission occurred in the boundary layer. The higher<br />
aerosol concentrations in the boundary layer (Figure 40 are<br />
2. Results <strong>of</strong> Boundary Layer Sampling thought to be associated <strong>with</strong> sea salt.<br />
In addition to the time series <strong>of</strong> constituents themselves,<br />
time series <strong>of</strong> ratios <strong>of</strong> two pairs <strong>of</strong> constituents which can<br />
Time series <strong>of</strong> selected constituents are examined first be interpreted in terms <strong>of</strong> air mass age are presented in<br />
to place the boundary layer inflow region in proper Figure 4g. As discussed elsewhere [Gregory et al., this<br />
perspective. Figure 4 includes time series for the entire issue], an acetylene/CO ratio <strong>of</strong> 1 suggests emissions only a few<br />
(DMS), 802, C2H2, C2H6, C3H8, C6H6, NO, NOy, .days old. These values apply when acetylene is expressed<br />
CH3C(O)OONO 2 (peroxyacetyl nitrate (PAN)), H202, in pptv and CO is in ppbv. The lifetime <strong>of</strong> acetylene<br />
CH3OOH, OH (model calculated), and aerosol. Figure 4a (C2H2) is about 11 days, while that <strong>of</strong> carbon monoxide is