Atmospheric sampling of Supertyphoon Mireille with NASA ...
Atmospheric sampling of Supertyphoon Mireille with NASA ...
Atmospheric sampling of Supertyphoon Mireille with NASA ...

You also want an ePaper? Increase the reach of your titles
YUMPU automatically turns print PDFs into web optimized ePapers that Google loves.
1860 NEWELL ET AL: DC-8 SAMPLING OF TYPHOON MIREILLE<br />
27<br />
27 28 29 '30 31 '32 33<br />
17<br />
14<br />
2 7 2.8 2.9 3.0 3.1 3.2 3.3<br />
HOUR OJT)<br />
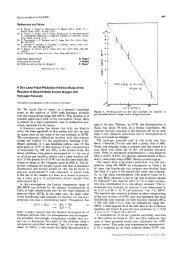
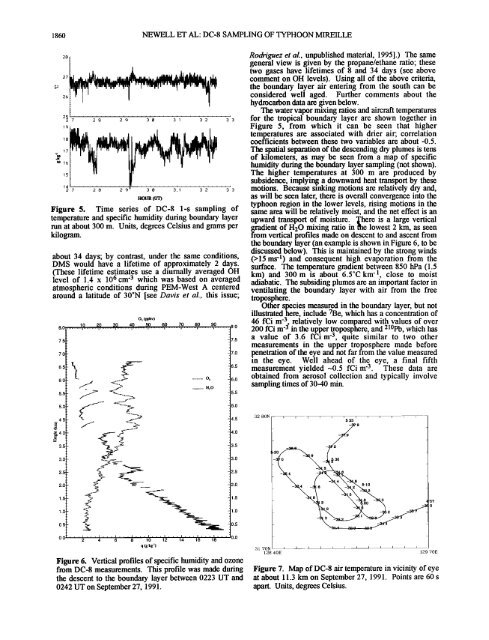
Figure 5. Time series <strong>of</strong> DC-8 1-s <strong>sampling</strong> <strong>of</strong><br />
temperature and specific humidity during boundary layer<br />
mn at about 300 m. Units, degrees Celsius and grams per<br />
kilogram.<br />
about 34 days; by contrast, under the same conditions,<br />
DMS would have a lifetime <strong>of</strong> approximately 2 days.<br />
(These lifetime estimates use a diurnally averaged OH<br />
level <strong>of</strong> 1.4 x 106 cm '3 which was based on averaged<br />
atmospheric conditions during PEM-West A centered<br />
around a latitude <strong>of</strong> 30øN [see Davis et al., this issue;<br />
O3 (ppbv)<br />
.o ........ !,9 ....... .,o, ....... ,,o, ....... ,,o, ....... ,,o, ....... ,,o, ....... o, ....... ,¾, ....... ¾, ........ .o<br />
7.0<br />
6.5<br />
6.0<br />
5.0<br />
3.5<br />
2.5<br />
1.5<br />
1.0<br />
0.5<br />
0.0<br />
03<br />
H20<br />
.<br />
7.5<br />
7.0<br />
6.5<br />
6.0<br />
5.5<br />
5.0<br />
4.5<br />
4.0<br />
3.5<br />
3.0<br />
2.5<br />
2.0<br />
1.5<br />
1.0<br />
0.5<br />
).0<br />
Rodriguez et aL, unpublished material, 1995].) The same<br />
general view is given by the propane/ethane ratio; these<br />
two gases have lifetimes <strong>of</strong> 8 and 34 days (see above<br />
comment on OH levels). Using all <strong>of</strong> the above criteria,<br />
the boundary layer air entering from the south can be<br />
considered well aged. Further comments about the<br />
hydrocarbon data are given below.<br />
The water vapor mixing ratios and aircraft temperatures<br />
for the tropical boundary layer are shown together in<br />
Figure 5, from which it can be seen that higher<br />
temperatures are associated <strong>with</strong> drier air; correlation<br />
coefficients between these two variables are about -0.5.<br />
The spatial separation <strong>of</strong> the descending dry plumes is tens<br />
<strong>of</strong> kilometers, as may be seen from a map <strong>of</strong> specific<br />
humidity during the boundary layer <strong>sampling</strong> (not shown).<br />
The higher temperatures at 300 m are produced by<br />
subsidence, implying a downward heat transport by these<br />
motions. Because sinking motions are relatively dry and,<br />
as will be seen later, there is overall convergence into the<br />
typhoon region in the lower levels, rising motions in the<br />
same area will be relatively moist, and the net effect is an<br />
upward transport <strong>of</strong> moisture. 'here is a large vertical<br />
gradient <strong>of</strong> H20 mixing ratio in erie lowest 2 kin, as seen<br />
from vertical pr<strong>of</strong>iles made on descent to and ascent from<br />
the boundary layer (an example is shown in Figure 6, to be<br />
discussed below). This is maintained by the strong winds<br />
(>15 ms -l) and consequem high evaporation from the<br />
surface. The temperature gradient between 850 hPa (1.5<br />
km) and 300 m is about 6.5øC km 'l, close to moist<br />
adiabatic. The subsiding plumes are an important factor in<br />
ventilating the boundary layer <strong>with</strong> air from the free<br />
troposphere.<br />
Other species measured in the boundary layer, but not<br />
illustrated here, include 7Be, which has a concentration <strong>of</strong><br />
46 fCi m '3, relatively low compared <strong>with</strong> values <strong>of</strong> over<br />
200 fCi m -3 in the upper troposphere, and 2]øpb, which has<br />
a value <strong>of</strong> 3.6 fCi m '3, quite similar to two' other<br />
measurements in the upper troposphere made before<br />
penetration <strong>of</strong> the eye and not far from the value measured<br />
in the eye. Well ahead <strong>of</strong> the eye, a final fifth<br />
measurement yielded-0.5 fCi m '3. These data are<br />
obtained from aerosol collection and typically involve<br />
<strong>sampling</strong> times <strong>of</strong> 30-40 min.<br />
-<br />
-<br />
5:33<br />
-<br />
31 70N t I I C I L<br />
128 40E 129 70E<br />
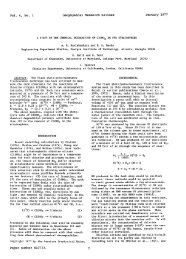
Figure 6. Vertical pr<strong>of</strong>iles <strong>of</strong> specific humidity and ozone<br />
from DC-8 measurements. This pr<strong>of</strong>ile was made during Figure 7. Map <strong>of</strong> DC-8 air temperature in vicinity <strong>of</strong> eye<br />
the descent to the boundary layer between 0223 UT and at about 11.3 km on September 27, 1991. Points are 60 s<br />
0242 UT on September 27, 1991.<br />
apart. Units, degrees Celsius.