Atmospheric sampling of Supertyphoon Mireille with NASA ...
Atmospheric sampling of Supertyphoon Mireille with NASA ...
Atmospheric sampling of Supertyphoon Mireille with NASA ...

You also want an ePaper? Increase the reach of your titles
YUMPU automatically turns print PDFs into web optimized ePapers that Google loves.
37 00N ,, , ,<br />
- -4 6:6 øa' ::<br />
_<br />
NEWELL ET AL: DC-8 SAMPLING OF TYPHOON MIREILLE 1865<br />
30 00N I ] I I i I<br />
128 00E 138 00E<br />
37 OON<br />
30 00N<br />
128 00E<br />
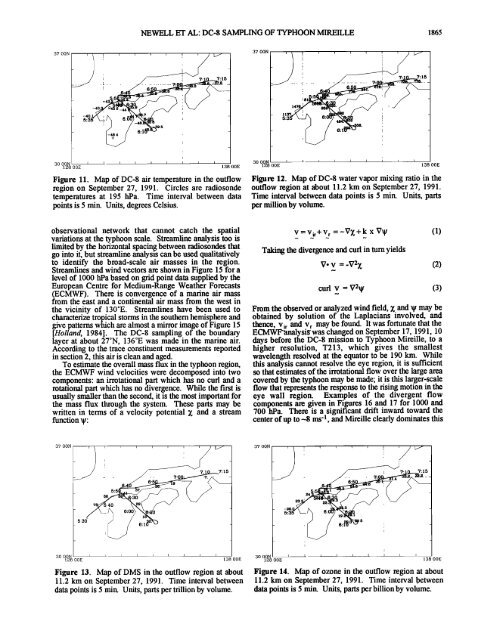
Figure 11. Map <strong>of</strong> DC-8 air temperature in the outflow Figure 12. Map <strong>of</strong> DC-8 water vapor mixing ratio in the<br />
region on September 27, 1991. Circles are radiosonde outflow region at about 11.2 km on September 27, 1991.<br />
temperatures at 195 hPa. Time interval between data Time interval between data points is 5 min. Units, parts<br />
points is 5 min. Units, degrees Celsius.<br />
per million by volume.<br />
observational network that cannot catch the spatial<br />
variations at the typhoon scale. Streamline analysis too is<br />
limited by the horizontal spacing between radiosondes that<br />
go into it, but streamline analysis can be used qualitatively<br />
to identify the broad-scale air masses in the region.<br />
Streamlines and wind vectors are shown in Figure 15 for a<br />
level <strong>of</strong> 1000 hPa based on grid poim data supplied by the<br />
European Centre for Medium-Range Weather Forecasts<br />
(ECMWF). There is convergence <strong>of</strong> a marine air mass<br />
from the east and a continental air mass from the west in<br />
the vicinity <strong>of</strong> 130øE. Streamlines have been used to<br />
characterize tropical storms in the southern hemisphere and<br />
give patterns which are almost a mirror image <strong>of</strong> Figure 15<br />
[Holland, 1984]. The DC-8 <strong>sampling</strong> <strong>of</strong> the boundary<br />
layer at about 27øN, 136øE was made in the marine air.<br />
According to the trace constituent measurements reported<br />
in section 2, this air is clean and aged.<br />
To estimate the overall mass flux in the typhoon region,<br />
the ECMWF wind velocities were decomposed into two<br />
components: an irrotational part which has no curl and a<br />
rotational part which has no divergence. While the first is<br />
usually smaller than the second, it is the most important for<br />
the mass flux through the system. These parts may be<br />
written in terms <strong>of</strong> a velocity potential Z and a stream<br />
function<br />
37 00N<br />
30 00N<br />
128 00E 138 00E<br />
Figure 13. Map <strong>of</strong> DMS in the outflow region at about<br />
11.2 km on September 27, 1991. Time interval between<br />
data points is 5 min. Units, parts per trillion by volume.<br />
v = vir+ vr =-V Z + k x V (1)<br />
Taking the divergence and curl in mm yields<br />
V. v =-V2z (2)<br />
cud v = V: (3)<br />
From the observed or analyzed wind field, Z and W may be<br />
obtained by solution <strong>of</strong> the Laplacians involved, and<br />
thence, v i, and v, may be found. It was fortunate that the<br />
ECMWF'analysig was chang. ed on September 17, 1991, 10<br />
days before the DC-8 mission to Typhoon <strong>Mireille</strong>, to a<br />
higher resolution, T213, which gives the smallest<br />
wavelength resolved at the equator to be 190 km. While<br />
this analysis cannot resolve the eye region, it is sufficient<br />
so that estimates <strong>of</strong> the irrotational flow over the large area<br />
covered by the typhoon may be made; it is this larger-scale<br />
flow that represents the response to the rising motion in the<br />
eye wall region. Examples <strong>of</strong> the divergent flow<br />
components are given in Figures 16 and 17 for 1000 and<br />
700 hPa. There is a significant drift inward toward the<br />
center <strong>of</strong> up to-8 ms -l, and <strong>Mireille</strong> clearly dominates this<br />
37 00N<br />
30 00N t I I I I I I I<br />
128 00E 138 00E<br />
Figure 14. Map <strong>of</strong> ozone in the outflow region at about<br />
11.2 km on September 27, 1991. Time interval between<br />
data points is 5 min. Units, parts per billion by volume.