Atmospheric sampling of Supertyphoon Mireille with NASA ...
Atmospheric sampling of Supertyphoon Mireille with NASA ...
Atmospheric sampling of Supertyphoon Mireille with NASA ...

You also want an ePaper? Increase the reach of your titles
YUMPU automatically turns print PDFs into web optimized ePapers that Google loves.
NEWELL ET AL' DC-8 SAMPLING OF TYPHOON MIREILLE<br />
net income flux net income flux<br />
-0.137<br />
-0.338 -0.201 5.576<br />
1.451<br />
-4.124<br />
lflO hPa lot hPa<br />
II<br />
-5.032 -<br />
150 hPa<br />
- -5.309<br />
+<br />
-1.202<br />
+<br />
-<br />
15fl hPa<br />
= -2.253<br />
+<br />
-7.424 -<br />
2fit hPa<br />
- -10.224<br />
+<br />
-1.726<br />
+<br />
-<br />
200 hPa<br />
-- -5.329<br />
+<br />
-6.155 -<br />
258 hPa.<br />
- -4.167<br />
+<br />
-0.679<br />
+<br />
-<br />
25fl hPa<br />
-- -5.928<br />
+<br />
-4.096<br />
+<br />
-<br />
3Off hPa<br />
- 0.471<br />
+<br />
0.230<br />
+<br />
-<br />
300 hPa<br />
-- -3.377<br />
+<br />
-3.894<br />
q-<br />
-<br />
4tO hPa<br />
- 0.299<br />
+<br />
-0.685<br />
+<br />
-<br />
4fir hPa<br />
-- -3.187<br />
+<br />
0.710 -<br />
5fit hPa<br />
- 0.872<br />
+<br />
-0.578<br />
+<br />
-<br />
5fit hPa<br />
-- -0.360<br />
q-<br />
7.730 -<br />
7fit hPa<br />
- 4.894<br />
+<br />
3.296<br />
+<br />
-<br />
' 7fit hPa<br />
-+- 4.703<br />
7.722 -<br />
850 hPa<br />
- 4.372<br />
+<br />
3.149<br />
+<br />
-<br />
850 hPa<br />
-- 5.231<br />
+<br />
10.302 -<br />
1 tilt hPa<br />
- 8.591 3.771 -<br />
1 tilt hPa<br />
-.- 6.375<br />
W E S N<br />
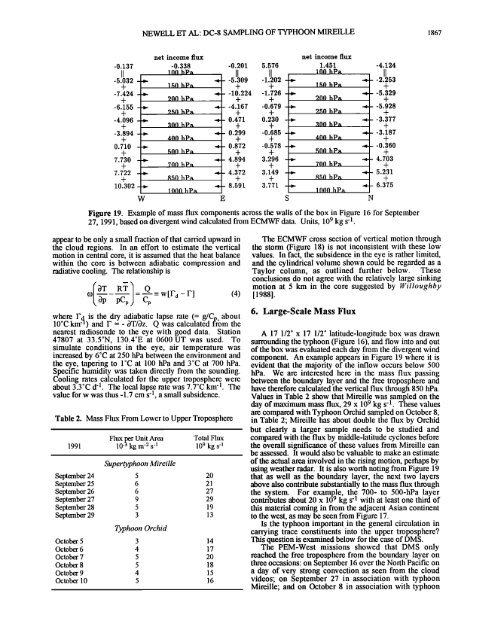
Figure 19. Example <strong>of</strong> mass flux components across the walls <strong>of</strong> the box in Figure 16 for September<br />
27, 1991, based on divergent wind calculated from ECMWF data. Units, 10 9 kg s -1 .<br />
appear to be only a small fraction <strong>of</strong> that carded upward in<br />
the cloud regions. In an effort to estimate the vertical<br />
motion in central core, it is assumed that the heat balance<br />
<strong>with</strong>in the core is between adiabatic compression and<br />
radiative cooling. The relationship is<br />
to 3p<br />
RT Q<br />
pCp = p = W[Fd- F]<br />
(4)<br />
1867<br />
The ECMWF cross section <strong>of</strong> vertical motion through<br />
the storm (Figure 18) is not inconsistent <strong>with</strong> these low<br />
values. In fact, the subsidence in the eye is rather limited,<br />
and the cylindrical volume shown could be regarded as a<br />
Taylor column, as outlined further below. These<br />
conclusions do not agree <strong>with</strong> the relatively large sinking<br />
motion at 5 km in the core suggested by Willoughby<br />
[19881.<br />
6. Large-Scale Mass Flux<br />
where F 4 is the dry adiabatic lapse rate (= g/Cv, about<br />
10øC km 4) and F = - 3T/3z. Q was calculated from the<br />
nearest radiosonde to the eye <strong>with</strong> good data. Station A 17 1/2 ø x 17 1/2 ø latitude-longitude box was drawn<br />
47807 at 33.5øN, 130.4øE at 0600 UT was used. To surrounding the typhoon (Figure 16), and flow into and out<br />
simulate conditions in the eye, air temperature was <strong>of</strong> the box was evaluated each day from the divergem wind<br />
increased by 6øC at 250 hPa between the environment and component. An example appears in Figure 19 where it is<br />
the eye, tapering to IøC at 100 hPa and 3øC at 700 hPa. evident that the majority <strong>of</strong> the ifflow occurs below 500<br />
Specific humidity was taken directly from the sounding. hPa. We are interested here in the mass flux passing<br />
Cooling rates calculated for the upper troposphere were between the boundary layer and the free troposphere and<br />
about 3.3øC d 'l. The local lapse rate was 7.7øC km 'l. The have therefore calculated the vertical flux through 850 hPa.<br />
value for w was thus -1.7 cm s-l, a small subsidence. Values in Table 2 show that <strong>Mireille</strong> was sampled on the<br />
day <strong>of</strong> maximum mass flux, 29 x 109 kg s -1 These values<br />
Table 2. Mass Flux From Lower to Upper Troposphere<br />
are compared <strong>with</strong> Typhoon Orchid sampled on October 8,<br />
in Table 2; <strong>Mireille</strong> has about double the flux by Orchid<br />
but clearly a larger sample needs to be studied and<br />
1991<br />
Flux per Unit Area<br />
10 -3 kg m '2 s '1<br />
Total Flux<br />
10 9 kg s 4<br />
compared <strong>with</strong> the flux by middle-latitude cyclones before<br />
the overall significance <strong>of</strong> these values from <strong>Mireille</strong> can<br />
be assessed. It would also be valuable to make an estimate<br />
September 24<br />
<strong>Supertyphoon</strong> Mirei lle<br />
5 20<br />
<strong>of</strong> the actual area involved in the rising motion, perhaps by<br />
using weather radar. It is also worth noting from Figure 19<br />
that as well as the boundary layer, the next two layers<br />
September 25<br />
September 26<br />
September 27<br />
September 28<br />
September 29<br />
6<br />
6<br />
9<br />
5<br />
3<br />
21<br />
27<br />
29<br />
19<br />
13<br />
above also contribute substantially to the mass flux through<br />
the system. For example, the 700- to 500-hPa layer<br />
contributes about 20 x 10 v kg s - <strong>with</strong> at least one third <strong>of</strong><br />
this material coming in from the adjacent Asian continent<br />
to the west, as may be seen from Figure 17.<br />
Typhoon Orchid<br />
Is the typhoon important in the general circulation in<br />
carrying trace constituents into the upper troposphere?<br />
October 5<br />
October 6<br />
October 7<br />
October 8<br />
October 9<br />
October 10<br />
3<br />
4<br />
5<br />
5<br />
4<br />
5<br />
14<br />
17<br />
20<br />
18<br />
15<br />
16<br />
This question is examined below for the case <strong>of</strong> DMS.<br />
The PEM-West missions showed that DMS only<br />
reached the free troposphere from the boundary layer on<br />
three occasions: on September 16 over the North Pacific on<br />
a day <strong>of</strong> very strong convection as seen from the cloud<br />
videos; on September 27 in association <strong>with</strong> typhoon<br />
<strong>Mireille</strong>; and on October 8 in association <strong>with</strong> typhoon