Atmospheric sampling of Supertyphoon Mireille with NASA ...
Atmospheric sampling of Supertyphoon Mireille with NASA ...
Atmospheric sampling of Supertyphoon Mireille with NASA ...

You also want an ePaper? Increase the reach of your titles
YUMPU automatically turns print PDFs into web optimized ePapers that Google loves.
1864 NEWELL ET AL: DC-8 SAMPLING OF TYPHOON MIREILLE<br />
32 80N<br />
31 70N<br />
128 40E<br />
5:33<br />
_ -,poe<br />
:57<br />
9<br />
,t<br />
129 70E<br />
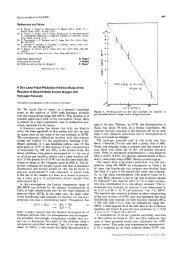
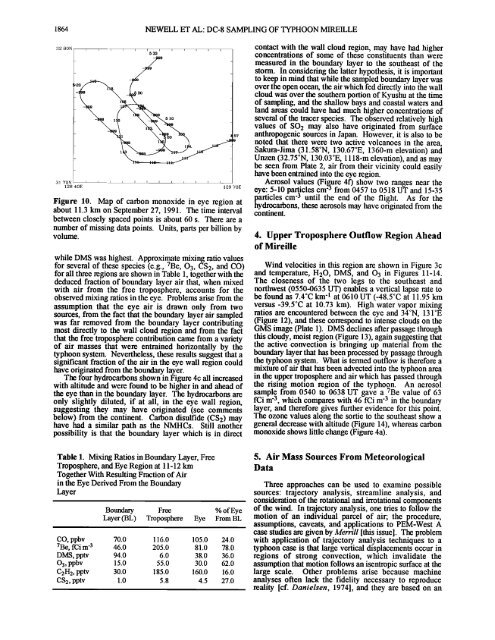
Figure 10. Map <strong>of</strong> carbon monoxide in eye region at<br />
about 11.3 km on September 27, 1991. The time interval<br />
between closely spaced points is about 60 s. There are a<br />
number <strong>of</strong> missing data points. Units, parts per billion by<br />
volume.<br />
contact <strong>with</strong> the wall cloud region, may have had higher<br />
concentrations <strong>of</strong> some <strong>of</strong> these constituents than were<br />
measured in the boundary layer to the southeast <strong>of</strong> the<br />
storm. In considering the latter hypothesis, it is important<br />
to keep in mind that while the sampled boundary layer was<br />
over the open ocean, the air which fed directly into the wall<br />
cloud was over the southern portion <strong>of</strong> Kyushu at the time<br />
<strong>of</strong> <strong>sampling</strong>, and the shallow bays and coastal waters and<br />
land areas could have had much higher concentrations <strong>of</strong><br />
several <strong>of</strong> the tracer species. The observed relatively high<br />
values <strong>of</strong> SO2 may also have originated from surface<br />
anthropogenic sources in Japan. However, it is also to be<br />
noted that them were two active volcanoes in the area,<br />
Sakura-Jima (31.58øN, 130.67øE, 1360-m elevation) and<br />
Unzen (32.75øN, 130.03øE, 1118-m elevation), and as may<br />
be seen from Plate 2, air from their vicinity could easily<br />
have been entrained into the eye region.<br />
Aerosol values (Fi.ure 4f) show two ranges near the<br />
eye: 5-10 pam,'cles cm- from 0457 to 0518 UT and 15-35<br />
particles cm -a until the end <strong>of</strong> the flight. As for the<br />
hydrocarbons, these aerosols may have originated from the<br />
continent.<br />
4. Upper Troposphere Outflow Region Ahead<br />
<strong>of</strong> <strong>Mireille</strong><br />
whileDMS was highest. Approximate mixing ratio values<br />
for several <strong>of</strong> these species (e.g., 7Be, 03, CS2, and CO) Wind velocities in this region are shown in Figure 3c<br />
for all three regions are shown in Table 1, together <strong>with</strong> the and temperature, H20, DMS, and 03 in Figures 11-14.<br />
deduced fraction <strong>of</strong> boundary layer air that, when mixed The closeness <strong>of</strong> the two legs to the southeast and<br />
<strong>with</strong> air from the free troposphere, accounts for the northwest (0550-0635 UT) enables a vertical lapse rate to<br />
observed mixing milos in the eye. Problems arise from the be found as 7.4øC km -1 at 0610 UT (-48.5øC at 11.95 km<br />
assumption that the eye air is drawn only from two versus -39.5øC at 10.73 km). High water vapor mixing<br />
sources, from the fact that the boundary layer air sampled ratios are encountered between the eye and 34øN, 13 IøE<br />
was far removed from the boundary layer contributing (Figure 12), and these correspond to intense clouds on the<br />
most directly to the wall cloud region and from the fact GMS image (Plate 1). DMS declines after passage through<br />
that the free troposphere contribution came from a variety this cloudy, moist region (Figure 13), again suggesting that<br />
<strong>of</strong> air masses that were entrained horizontally by the the active convection is bringing up material from the<br />
typhoon system. Nevertheless, these results suggest that a boundary layer that has been processed by passage through<br />
significant fraction <strong>of</strong> the air in the eye wall region could the typhoon system. What is termed outflow is therefore a<br />
have originated from the boundary layer.<br />
mixture <strong>of</strong> air that has been advected into the typhoon area<br />
The four hydrocarbons shown in Figure 4c all increased in the upper troposphere and air which has passed through<br />
<strong>with</strong> altitude and were found to be higher in and ahead <strong>of</strong> the rising motion region <strong>of</strong> the typhoon. An aerosol<br />
the eye than in the boundary layer. The hydrocarbons are sample from 0540 to 0638 UT gave a 7Be value <strong>of</strong> 63<br />
only slightly diluted, if at all, in the eye wall region, fCi m -3, which compares <strong>with</strong> 46 fCi m -3 in the boundary<br />
suggesting they may have originated (see comments layer, and therefore gives further evidence for this point.<br />
below) from the continent. Carbon disulfide (CS2) may The ozone values along the sortie to the southeast show a<br />
have had a similar path as the NMHCs. Still another general decrease <strong>with</strong> altitude (Figure 14), whereas carbon<br />
possibility is that the boundary layer which is in direct monoxide shows little change (Figure 4a).<br />
Table 1. Mixing Ratios in Boundary Layer, Free<br />
Troposphere, and Eye Region at 11-12 km<br />
Together With Resulting Fraction <strong>of</strong> Air<br />
in the Eye Derived From the Bounda .ry<br />
Layer<br />
Boundary Free % <strong>of</strong> Eye<br />
Layer (BL) Troposphere Eye From BL<br />
CO, ppbv 70.0 116.0 105.0 24.0<br />
7Be, fCi m -3 46.0 205.0 81.0 78.0<br />
DMS, pptv 94.0 6.0 38.0 36.0<br />
0 3, ppbv 15.0 55.0 30.0 62.0<br />
C2H2, pptv 30.0 185.0 160.0 16.0<br />
CS 2, pptv 1.0 5.8 4.5 27.0<br />
5. Air Mass Sources From Meteorological<br />
Data<br />
Three approaches can be used to examine possible<br />
sources: trajectory analysis, streamline analysis, and<br />
consideration <strong>of</strong> the rotational and irrotational components<br />
<strong>of</strong> the wind. In trajectory analysis, one tries to follow the<br />
motion <strong>of</strong> an individual parcel <strong>of</strong> air; the procedure,<br />
assumptions, caveats, and applications to PEM-West A<br />
case studies are given by Merrill [this issue]. The problem<br />
<strong>with</strong> application <strong>of</strong> trajectory analysis techniques to a<br />
typhoon case is that large vertical displacements occur in<br />
regions <strong>of</strong> strong convection, which invalidate the<br />
assumption that motion follows an isentropic surface at the<br />
large scale. Other problems arise because machine<br />
analyses <strong>of</strong>ten lack the fidelity necessary to reproduce<br />
reality [cf. Danielsen, 1974], and they are based on an