Atmospheric sampling of Supertyphoon Mireille with NASA ...
Atmospheric sampling of Supertyphoon Mireille with NASA ...
Atmospheric sampling of Supertyphoon Mireille with NASA ...

Create successful ePaper yourself
Turn your PDF publications into a flip-book with our unique Google optimized e-Paper software.
32 80N<br />
5:33<br />
_ 13.<br />
_<br />
.,<br />
NEWELL ET AL: DC-8 SAMPLING OF TYPHOON MIREILLE 1861<br />
1 .<br />
_ - 7. ' 3 ' 5:10 i<br />
_ O. 1. ß -<br />
_<br />
31 70N t<br />
128 40E<br />
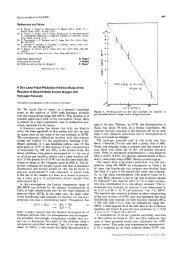
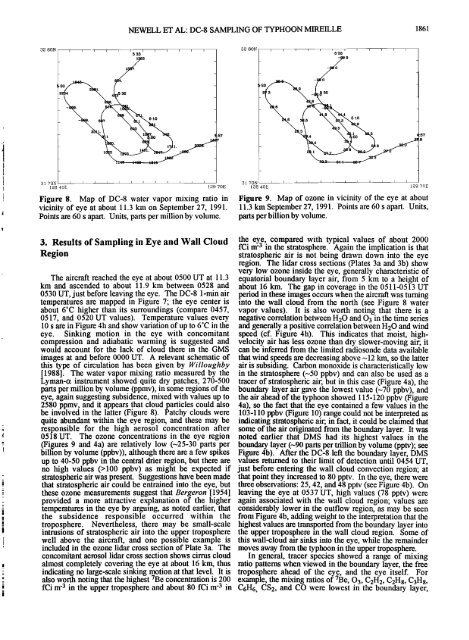
Figure 8. Map <strong>of</strong> DC-8 water vapor mixing ratio in<br />
vicinity <strong>of</strong> eye at about 11.3 km on September 27, 1991.<br />
Points are 60 s apart. Units, parts per million by volume.<br />
32 80N , , , , , , ,<br />
5:33<br />
/..o<br />
5.7 - 3 1:57<br />
129 70E 128 40E 129 70E<br />
Figure 9. Map <strong>of</strong> ozone in vicinity <strong>of</strong> the eye at about<br />
11.3 km September 27, 1991. Points are 60 s apart. Units,<br />
parts per billion by volme.<br />
3. Results <strong>of</strong> Sampling in Eye and Wall Cloud the eye, compared <strong>with</strong> typical values <strong>of</strong> about 2000<br />
fCi m -3 in the stratosphere. Again the implication is that<br />
Region<br />
stratospheric air is not being drawn down into the eye<br />
region. The lidar cross sections (Plates 3a and 3b) show<br />
very low ozone inside the eye, generally characteristic <strong>of</strong><br />
The aircraft reached the eye at about 0500 UT at 11.3 equatorial boundary layer air, from 5 km to a height <strong>of</strong><br />
km and ascended to about 11.9 km between 0528 and about 16 km. The gap in coverage in the 0511-0513 UT<br />
0530 UT, just before leaving the eye. The DC-8 1-nfin air period in these images occurs when the aircraft was turning<br />
temperatures are mapped in Figure 7; the eye center is into the wall cloud from the north (see Figure 8 water<br />
about 6øC higher than its surroundings (compare 0457, vapor values). It is also worth noting that there is a<br />
0517, and 0520 UT values). Temperature values every negative correlation between H20 and 03 in the time series<br />
10 s are in Figure 4h and show variation <strong>of</strong> up to 6øC in the and generally a positive correlation between H20 and wind<br />
eye. Sinking motion in the eye <strong>with</strong> concomitant speed (cf. Figure 4h). This indicates that moist, highcompression<br />
and adiabatic warming is suggested and velocity air has less ozone than dry slower-moving air; it<br />
would account for the lack <strong>of</strong> cloud there in the GMS can be inferred from the limited radiosonde data available<br />
images at and before 0000 UT. A relevant schematic <strong>of</strong> that wind speeds are decreasing above -12 km, so the latter<br />
this type <strong>of</strong> circulation has been given by IVilloughby air is subsiding. Carbon monoxide is characteristically low<br />
[1988]. The water vapor mixing ratio measured by the in the stratosphere (-50 ppbv) and can also be used as a<br />
Lyman-a instrument showed quite dry patches, 270-500 tracer <strong>of</strong> stratospheric air; but in this case (Figure 4a), the<br />
parts per million by volume (ppmv), in some regions <strong>of</strong> the boundary layer air gave the lowest value (-70 ppbv), and<br />
eye, again suggesting subsidence, mixed <strong>with</strong> values up to the air ahead <strong>of</strong> the typhoon showed 115-120 ppbv (Figure<br />
2580 ppmv, and it appears that cloud particles could also 4a), so the fact that the eye contained a few values in the<br />
be involved in the latter (Figure 8). Patchy clouds were 103-110 ppbv (Figure 10) range could not be interpreted as<br />
quite abundant <strong>with</strong>in the eye region, and these may be indicating stratospheric air; in fact, it could be claimed that<br />
responsible for the high aerosol concentration after some <strong>of</strong> the air originated from the boundary layer. It was<br />
0518 UT. The ozone concentrations in the eye region noted earlier that DMS had its highest values in the<br />
(Figures 9 and 4a) are relatively low (-25-30 pans per boundary layer (-90 parts per trillion by volume (pptv); see<br />
billion by volume (ppbv)), although them are a few spikes Figure 4b). After the DC-8 left the boundary layer, DMS<br />
up to 40-50 ppbv in the central drier region, but them are values returned to their limit <strong>of</strong> detection until 0454 UT,<br />
no high values (>100 ppbv) as might be expected if just before entering the wall cloud convection region; at<br />
stratospheric air was present. Suggestions have been made that point they increased to 80 pptv. In the eye, there were<br />
that stratospheric air could be entrained into the eye, but three observations: 25, 42, and 48 pptv (see Figure 4b). On<br />
these ozone measurements suggest that Bergeron [1954] leaving the eye at 0537 UT, high values (78 pptv) were<br />
provided a more attractive explanation <strong>of</strong> the higher again associated <strong>with</strong> the wall cloud region; values are<br />
temperatures in the eye by arguing, as noted earlier, that considerably lower in the outflow region, as may be seen<br />
the subsidence responsible occurred <strong>with</strong>in the from Figure 4b, adding weight to the interpretation that the<br />
troposphere. Nevertheless, there may be small-scale highest values are transported from the boundary layer into<br />
intrusions <strong>of</strong> stratospheric air into the upper troposphere the upper troposphere in the wall cloud region. Some <strong>of</strong><br />
well above the aircraft, and one possible example is this wall-cloud air sinks into the eye, while the remainder<br />
included in the ozone lidar cross section <strong>of</strong> Plate 3a. The moves away from the typhoon in the upper troposphere.<br />
concomitant aerosol lidar cross section shows cirrus cloud In general, tracer species showed a range <strong>of</strong> mixing<br />
almost completely covering the eye at about 16 kin, thus ratio patterns when viewed in the boundary layer, the free<br />
indicating no large-scale sinking motion at that level. It is troposphere ahead <strong>of</strong> the eye, and the eye itself. For<br />
also worth noting that the highest 7Be concentration is 200 example, the mixing ratios <strong>of</strong> 7Be, 03, C2H2, C2H8, C3H8,<br />
fCi m '3 in the upper troposphere and about 80 fCi m -3 in C6H6, C82, and CO were lowest in the boundary layer,