Chapter -1 final last new font final - petrofed.winwinho...
Chapter -1 final last new font final - petrofed.winwinho...
Chapter -1 final last new font final - petrofed.winwinho...

Create successful ePaper yourself
Turn your PDF publications into a flip-book with our unique Google optimized e-Paper software.
www.<strong>petrofed</strong>.org<br />
like ONGC, GAIL and OIL. The remaining losses investment sentiment and this could lead to a very<br />
on account of under-recoveries were borne by the negative situation for a growing economy like<br />
OMCs themselves 20.9 percent. India.<br />
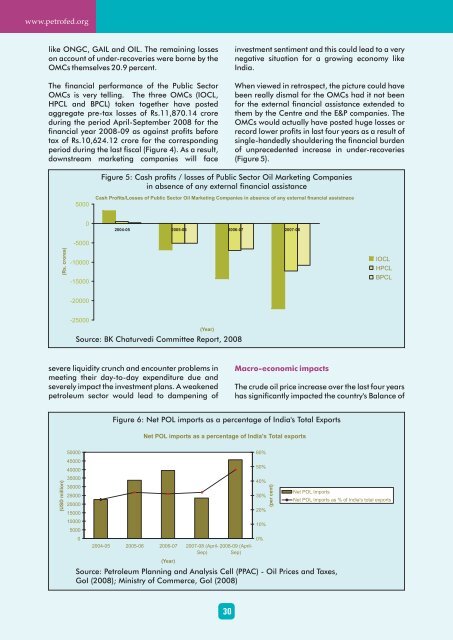
The financial performance of the Public Sector When viewed in retrospect, the picture could have<br />
OMCs is very telling. The three OMCs (IOCL, been really dismal for the OMCs had it not been<br />
HPCL and BPCL) taken together have posted for the external financial assistance extended to<br />
aggregate pre-tax losses of Rs.11,870.14 crore them by the Centre and the E&P companies. The<br />
during the period April-September 2008 for the OMCs would actually have posted huge losses or<br />
financial year 2008-09 as against profits before record lower profits in <strong>last</strong> four years as a result of<br />
tax of Rs.10,624.12 crore for the corresponding single-handedly shouldering the financial burden<br />
period during the <strong>last</strong> fiscal (Figure 4). As a result, of unprecedented increase in under-recoveries<br />
downstream marketing companies will face (Figure 5).<br />
(Rs. crores)<br />
severe liquidity crunch and encounter problems in<br />
meeting their day-to-day expenditure due and<br />
severely impact the investment plans. A weakened<br />
petroleum sector would lead to dampening of<br />
(USD million)<br />
-5000<br />
-10000<br />
-15000<br />
-20000<br />
-25000<br />
50000<br />
45000<br />
40000<br />
35000<br />
30000<br />
25000<br />
20000<br />
15000<br />
10000<br />
5000<br />
5000<br />
0<br />
Figure 5: Cash profits / losses of Public Sector Oil Marketing Companies<br />
in absence of any external financial assistance<br />
Cash Profits/Losses of Public Sector Oil Marketing Companies in absence of any external financial assistnace<br />
2004-05 2005-06 2006-07 2007-08<br />
(Year)<br />
Source: BK Chaturvedi Committee Report, 2008<br />
0<br />
30<br />
Macro-economic impacts<br />
IOCL<br />
HPCL<br />
BPCL<br />
The crude oil price increase over the <strong>last</strong> four years<br />
has significantly impacted the country's Balance of<br />
Figure 6: Net POL imports as a percentage of India's Total Exports<br />
Net POL imports as a percentage of India's Total exports<br />
2004-05 2005-06 2006-07 2007-08 (April- 2008-09 (April-<br />
Sep) Sep)<br />
(Year)<br />
Source: Petroleum Planning and Analysis Cell (PPAC) - Oil Prices and Taxes,<br />
GoI (2008); Ministry of Commerce, GoI (2008)<br />
60%<br />
50%<br />
40%<br />
30%<br />
20%<br />
10%<br />
0%<br />
(per cent)<br />
Net POL Imports<br />
Net POL Imports as % of India's total exports