Truscott Research Fax Pro forma - City of Norwood Payneham and ...
Truscott Research Fax Pro forma - City of Norwood Payneham and ...
Truscott Research Fax Pro forma - City of Norwood Payneham and ...

Create successful ePaper yourself
Turn your PDF publications into a flip-book with our unique Google optimized e-Paper software.
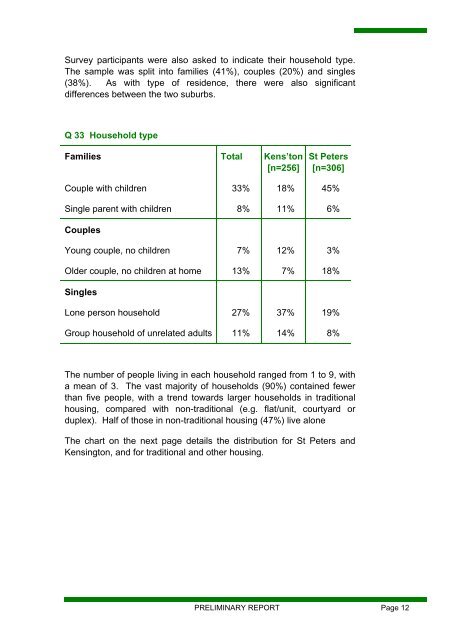
Survey participants were also asked to indicate their household type.<br />
The sample was split into families (41%), couples (20%) <strong>and</strong> singles<br />
(38%). As with type <strong>of</strong> residence, there were also significant<br />
differences between the two suburbs.<br />
Q 33 Household type<br />
Families Total Kens’ton<br />
[n=256]<br />
St Peters<br />
[n=306]<br />
Couple with children 33% 18% 45%<br />
Single parent with children 8% 11% 6%<br />
Couples<br />
Young couple, no children 7% 12% 3%<br />
Older couple, no children at home 13% 7% 18%<br />
Singles<br />
Lone person household 27% 37% 19%<br />
Group household <strong>of</strong> unrelated adults 11% 14% 8%<br />
The number <strong>of</strong> people living in each household ranged from 1 to 9, with<br />
a mean <strong>of</strong> 3. The vast majority <strong>of</strong> households (90%) contained fewer<br />
than five people, with a trend towards larger households in traditional<br />
housing, compared with non-traditional (e.g. flat/unit, courtyard or<br />
duplex). Half <strong>of</strong> those in non-traditional housing (47%) live alone<br />
The chart on the next page details the distribution for St Peters <strong>and</strong><br />
Kensington, <strong>and</strong> for traditional <strong>and</strong> other housing.<br />
PRELIMINARY REPORT Page 12