WAIS –IV ReportWriter - Pearson
WAIS –IV ReportWriter - Pearson
WAIS –IV ReportWriter - Pearson

You also want an ePaper? Increase the reach of your titles
YUMPU automatically turns print PDFs into web optimized ePapers that Google loves.
PsychCorp.com<br />
800.211.8378<br />
<strong>WAIS</strong> ® <strong>–IV</strong><br />
Report Writer<br />
sample report
Test Session Behavior<br />
John arrived on time for the test session unaccompanied. John has experienced recent<br />
weight loss and his appearance was neat. He was oriented to person, place, time and<br />
situation. John exhibited notable motor difficulties during testing. In particular, he had a<br />
central nervous system problem. John’s observed difficulties due to his physical disorder<br />
during testing may have moderately interfered with his capability to fully express his<br />
nonverbal reasoning abilities, as many of the nonverbal tasks require manipulation of<br />
small materials such as blocks. It is important to note that John’s observed difficulties<br />
resulting from pain or discomfort experienced during testing may have had a minimal<br />
effect on his capability to fully express his true intellectual ability.<br />
Interpretation of <strong>WAIS</strong><strong>–IV</strong> Results<br />
General Intellectual Ability<br />
John performed much better on the verbal than on the nonverbal tasks of the Wechsler<br />
Adult Intelligence Scale–Fourth Edition (<strong>WAIS</strong><strong>–IV</strong>). John’s motor difficulties may have<br />
moderately interfered with his capability to fully express his nonverbal reasoning abilities.<br />
Many of the nonverbal tasks require the observation and manipulation of small materials<br />
such as blocks. John’s general cognitive ability, therefore, is best estimated by his<br />
performance on the verbal tasks. His verbal reasoning ability is high average range and<br />
above that of approximately 79% of his peers (VCI = 112; 95% confidence interval = 106-<br />
117).<br />
Verbal Comprehension<br />
John’s verbal reasoning abilities as measured by the Verbal Comprehension Index (VCI)<br />
are in the high average range and above those of approximately 79% of his peers (VCI =<br />
112; 95% confidence interval = 106-117). The VCI is designed to measure verbal<br />
reasoning and concept formation. John performed comparably on the verbal subtests<br />
contributing to the VCI, suggesting that the various verbal cognitive abilities measured by<br />
these subtests are similarly developed. Furthermore, he may experience little or no<br />
difficulty in keeping up with his peers in situations that require verbal skills.<br />
John achieved his best performance among the verbal reasoning tasks on the Information<br />
and Vocabulary subtests. His strong performances on the Information and Vocabulary<br />
subtests were better than that of most of his peers.<br />
The Vocabulary subtest required John to explain the meaning of words presented in<br />
isolation. As a direct assessment of word knowledge, the subtest is one indication of his<br />
overall verbal comprehension. Performance on this subtest also requires abilities to<br />
verbalize meaningful concepts as well as to retrieve information from long-term memory<br />
(Vocabulary scaled score = 12). The Information subtest required John to respond orally to<br />
questions about common events, objects, places, and people. The subtest is primarily a<br />
measure of his fund of general knowledge. Performance on this subtest also may be<br />
Version 1.0.0 Scores based on U.S. normative data copyright © 2008 by NCS <strong>Pearson</strong>, Inc.<br />
All rights reserved. Produced in the United States of America.<br />
John Q Smithson<br />
Page 2 of 9
influenced by cultural experience and quality of education, as well as his ability to retrieve<br />
information from long-term memory (Information scaled score = 13).<br />
Perceptual Reasoning<br />
John’s nonverbal reasoning abilities as measured by the Perceptual Reasoning Index<br />
(PRI) are in the low average range and above those of only 14% of his peers (PRI =84;<br />
95% confidence interval = 79-91). The PRI is designed to measure fluid reasoning in the<br />
perceptual domain with tasks that assess nonverbal concept formation, visual perception<br />
and organization, visual-motor coordination, learning, and the ability to separate figure and<br />
ground in visual stimuli. John’s performance on the perceptual reasoning subtests<br />
contributing to the PRI is somewhat variable, although the magnitude of this difference in<br />
performance is not unusual among individuals his age. Examination of John’s<br />
performance on individual subtests provides additional information regarding his specific<br />
nonverbal abilities.<br />
Working Memory<br />
John’s ability to sustain attention, concentrate, and exert mental control is in the low<br />
average range. He performed better than approximately 18% of his peers in this area<br />
(Working Memory Index (WMI) = 86; 95% confidence interval 80-94). John’s abilities to<br />
sustain attention, concentrate, and exert mental control are a weakness relative to his<br />
verbal reasoning abilities. A weakness in mental control may make the processing of<br />
complex information more time-consuming for John, draining his mental energies more<br />
quickly as compared to others at his level of ability, and perhaps result in more frequent<br />
errors on a variety of learning or complex work tasks.<br />
Processing Speed<br />
John’s ability in processing simple or routine visual material without making errors is in<br />
the average range when compared to his peers. He performed better than approximately<br />
50% of his peers on the processing speed tasks (Processing Speed Index [PSI] = 100;<br />
95% confidence interval 92-108). John’s performance on the subtests that compose the<br />
PSI is quite variable; therefore, the PSI score should be interpreted with caution. He<br />
performed much better on Symbol Search (Scaled score = 12), which is more demanding<br />
of attention to detail and visual discrimination, than on Coding (scaled score = 8), which is<br />
more demanding of fine-motor skills, short-term memory, and learning ability.<br />
Summary<br />
John was referred for an evaluation by Jack Mills, his physician, secondary to Physical<br />
difficulties (motor function) and Neurological difficulties (traumatic head injury). John is a<br />
45-year-old white male who completed the <strong>WAIS</strong><strong>–IV</strong>.His motor difficulty may have impeded<br />
his performance on the nonverbal tasks, and thus his verbal abilities may be the best<br />
estimate of John’s overall intellectual functioning. John’s verbal reasoning abilities are in<br />
Version 1.0.0 Scores based on U.S. normative data copyright © 2008 by NCS <strong>Pearson</strong>, Inc.<br />
All rights reserved. Produced in the United States of America.<br />
John Q Smithson<br />
Page 3 of 9
the high average range when compared to his peers (VCI = 112). John’s ability to sustain<br />
attention, concentrate, and exert mental control is in the low average range (WMI = 86).<br />
John’s ability in processing simple or routine visual material without making errors is in<br />
the average range when compared to his peers PSI = 100). However, due to variability<br />
between the two subtests that compose the PSI, caution is warranted when interpreting<br />
scores and a closer look at the individual subtests is recommended.<br />
Recommendations<br />
Prior to commencing a task, John should be reminded to think about what will be<br />
necessary in order to complete it, including all materials and steps required for task<br />
completion.<br />
It is important that more structure be implemented in John’s life. Specific household<br />
responsibilities and routines are often helpful in this effort. These endeavors must be<br />
perceived by the individual as attempts to increase his involvement in the home and sense<br />
of self worth. The goal is to make him feel more valuable and significant within the home<br />
and family unit.<br />
Version 1.0.0 Scores based on U.S. normative data copyright © 2008 by NCS <strong>Pearson</strong>, Inc.<br />
All rights reserved. Produced in the United States of America.<br />
John Q Smithson<br />
Page 4 of 9
<strong>WAIS</strong><strong>–IV</strong> Score Summary<br />
Composite Score Summary<br />
Sum of Composite Percentile<br />
95%<br />
Confidence Qualitative<br />
Scale<br />
Scaled Scores Score<br />
Rank<br />
Interval<br />
Description<br />
Verbal Comprehension 37 VCI 112 79 106-117 High Average<br />
Perceptual Reasoning 22 PRI 84 14 79-91 Low Average<br />
Working Memory 15 WMI 86 18 80-94 Low Average<br />
Processing Speed 20 PSI 100 50 92-108 Average<br />
Full Scale 94 FSIQ 96 39 92-100 Average<br />
General Ability 59 GAI 99 47 94-104 Average<br />
Confidence Intervals are based on the Overall Average SEMs. Values reported in the SEM column are based on the<br />
examinee’s age.<br />
The GAI is an optional composite summary score that is less sensitive to the influence of working memory and processing<br />
speed. Because working memory and processing speed are vital to a comprehensive evaluation of cognitive ability, it should be<br />
noted that the GAI does not have the breadth of construct coverage as the FSIQ.<br />
Version 1.0.0 Scores based on U.S. normative data copyright © 2008 by NCS <strong>Pearson</strong>, Inc.<br />
All rights reserved. Produced in the United States of America.<br />
John Q Smithson<br />
Page 5 of 9
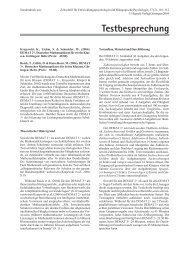
Composite Score Profile<br />
The vertical bars represent the standard error of measurement (SEM).<br />
Analysis<br />
Index Level Discrepancy Comparisons<br />
Critical Significant<br />
Value Difference Base Rate<br />
Comparison Score 1 Score 2 Difference .05 Y / N Overall Sample<br />
VCI - PRI 112 84 28 7.78 Y 2.3<br />
VCI - WMI 112 86 26 8.31 Y 2.3<br />
VCI - PSI 112 100 12 11.76 Y 22.2<br />
PRI - WMI 84 86 -2 8.81 N 45<br />
PRI - PSI 84 100 -16 12.12 Y 14.2<br />
WMI - PSI 86 100 -14 12.47 Y 17.7<br />
FSIQ - GAI 96 99 -3 3.29 N 30.3<br />
Base rate by overall sample.<br />
Version 1.0.0 Scores based on U.S. normative data copyright © 2008 by NCS <strong>Pearson</strong>, Inc.<br />
All rights reserved. Produced in the United States of America.<br />
Composite Scores and<br />
Standard Error<br />
of Measurement<br />
Composite Score SEM<br />
VCI 112 2.6<br />
PRI 84 3<br />
WMI 86 3.35<br />
PSI 100 5.41<br />
FSIQ 96 2.12<br />
GAI 99 2.12<br />
John Q Smithson<br />
Page 6 of 9
Statistical significance (critical value) at the .05 level.<br />
Verbal Comprehension Subtests Summary<br />
Subtest<br />
Raw<br />
Score<br />
Scaled<br />
Score<br />
Percentile<br />
Rank<br />
Version 1.0.0 Scores based on U.S. normative data copyright © 2008 by NCS <strong>Pearson</strong>, Inc.<br />
All rights reserved. Produced in the United States of America.<br />
Reference Group<br />
Scaled Score SEM<br />
Similarities 30 12 75 13 1.04<br />
Vocabulary 45 12 75 13 0.73<br />
Information 20 13 84 14 0.73<br />
(Comprehension) 25 10 50 11 1.16<br />
Perceptual Reasoning Subtests Summary<br />
Raw Scaled Percentile Reference Group<br />
Subtest<br />
Score Score Rank Scaled Score SEM<br />
Block Design 19 5 5 5 0.95<br />
Matrix Reasoning 14 8 25 7 0.95<br />
Visual Puzzles 12 9 37 8 0.85<br />
Working Memory Subtests Summary<br />
Raw Scaled Percentile Reference Group<br />
Subtest<br />
Score Score Rank Scaled Score SEM<br />
Digit Span 21 7 16 6 0.73<br />
Arithmetic 12 8 25 9 0.9<br />
Processing Speed Subtests Summary<br />
Raw Scaled Percentile Reference Group<br />
Subtest<br />
Score Score Rank Scaled Score SEM<br />
Symbol Search 36 12 75 11 1.56<br />
Coding 54 8 25 7 1.2<br />
Subtest Level Discrepancy Comparisons<br />
Critical Value<br />
Significant<br />
Difference Base<br />
Subtest Comparison Score 1 Score 2 Difference .05<br />
Y / N<br />
Rate<br />
Digit Span - Arithmetic 7 8 -1 2.57 N 42.2<br />
Symbol Search - Coding 12 8 4 3.41 Y 8<br />
Statistical significance (critical value) at the .05 level.<br />
John Q Smithson<br />
Page 7 of 9
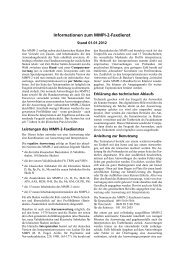
Subtest Scaled Score Profile<br />
The vertical bars represent the standard error of measurement (SEM)<br />
Determining Strengths and Weaknesses<br />
Differences Between Subtest and Overall Mean of Subtest Scores<br />
Subtest Mean<br />
Scaled Scaled<br />
Critical Value Strength or Base<br />
Subtest<br />
Score Score Difference .05 Weakness Rate<br />
Block Design 5 9.40 -4.4 2.85 W 2-5%<br />
Similarities 12 9.40 2.6 2.82 15-25%<br />
Digit Span 7 9.40 -2.4 2.22 W 25%<br />
Matrix Reasoning 8 9.40 -1.4 2.54 >25%<br />
Vocabulary 12 9.40 2.6 2.03 S 15-25%<br />
Arithmetic 8 9.40 -1.4 2.73 >25%<br />
Symbol Search 12 9.40 2.6 3.42 >25%<br />
Visual Puzzles 9 9.40 -0.4 2.71 >25%<br />
Information 13 9.40 3.6 2.19 S 5-10%<br />
Coding 8 9.40 -1.4 2.97 >25%<br />
Overall: Mean = 9.4, Scatter = 8, Base rate = 30.2.<br />
Base Rate for Intersubtest Scatter is reported for 10 Full Scale Subtests.<br />
Statistical significance (critical value) at the .05 level.<br />
Version 1.0.0 Scores based on U.S. normative data copyright © 2008 by NCS <strong>Pearson</strong>, Inc.<br />
All rights reserved. Produced in the United States of America.<br />
John Q Smithson<br />
Page 8 of 9
Process Analysis<br />
Perceptual Reasoning Process Score Summary<br />
Process Score<br />
Raw<br />
Score<br />
Scaled<br />
Score<br />
Version 1.0.0 Scores based on U.S. normative data copyright © 2008 by NCS <strong>Pearson</strong>, Inc.<br />
All rights reserved. Produced in the United States of America.<br />
Percentile<br />
Rank SEM<br />
Block Design No Time<br />
Bonus 45 13 84 1.08<br />
Working Memory Process Score Summary<br />
Raw Scaled Percentile Base<br />
Process Score<br />
Score Score Rank Rate SEM<br />
Digit Span Forward 11 11 63 -- 1.24<br />
Digit Span Backward 6 7 16 -- 1.12<br />
Digit Span Sequencing 4 5 5 -- 1.27<br />
Longest Digit Span Forward 6 -- -- 79 --<br />
Longest Digit Span Backward 3 -- -- 96 --<br />
Longest Digit Span Sequence 3 -- -- 97.5 --<br />
Process Level Discrepancy Comparisons<br />
Process Comparison Score 1 Score 2 Difference<br />
Critical<br />
Value<br />
.05<br />
Significant<br />
Difference<br />
Y / N<br />
Block Design - Block Design No Time Bonus 5 13 -8 3.08 Y 0<br />
Digit Span Forward - Digit Span Backward 11 7 4 3.65 Y 10.3<br />
Digit Span Forward - Digit Span Sequencing 11 5 6 3.6 Y 4.7<br />
Digit Span Backward - Digit Span Sequencing 7 5 2 3.56 N 29.9<br />
Longest DS Forward - Longest DS Backward 6 3 3 -- -- 33.5<br />
Longest DS Forward - Longest DS Sequence 6 3 3 -- -- 17<br />
Longest DS Backward - Longest DS Sequence 3 3 0 -- --<br />
Statistical significance (critical value) at the .05 level.<br />
Base<br />
Rate<br />
John Q Smithson<br />
Page 9 of 9
Clinical Assessment Group<br />
19500 Bulverde Road<br />
San Antonio, Texas 78259-3701<br />
800.211.8378<br />
PsychCorp.com<br />
<strong>WAIS</strong>-IV.com<br />
PsychCorp products are now part of <strong>Pearson</strong>.<br />
Copyright © 2009 <strong>Pearson</strong> Education, Inc. or its affiliate(s). All rights reserved. 80660<br />
PsychCorp is a trademark in the U.S. and/or other countries, of <strong>Pearson</strong> Education, Inc. or its affiliate(s).<br />
Wechsler Adult Intelligence Scale, and <strong>WAIS</strong> are registered trademarks in the U.S.<br />
and/or other countries, of <strong>Pearson</strong> Education, Inc. or its affiliate(s)