Annual Report 2009 in PDF - GKN
Annual Report 2009 in PDF - GKN
Annual Report 2009 in PDF - GKN

You also want an ePaper? Increase the reach of your titles
YUMPU automatically turns print PDFs into web optimized ePapers that Google loves.
112<br />
<strong>GKN</strong> plc <strong>Annual</strong> <strong>Report</strong> <strong>2009</strong><br />
Notes to the F<strong>in</strong>ancial Statements<br />
For the year ended 31 December <strong>2009</strong><br />
24 Acquisitions cont<strong>in</strong>ued<br />
Fair value adjustments to ÔP rovisions Ñ otherÕ relate to non-beneficial lease rentals. The Group was apportioned floor area for the w<strong>in</strong>g<br />
component manufactur<strong>in</strong>g and assembly operation out of the larger Airbus headlease. The freeholder is a third party and the full above<br />
market rental cost of the apportioned Airbus headlease rental is required by covenant with the freeholder to be passed from Airbus to the<br />
Group. The Group is committed to the lease for the rema<strong>in</strong><strong>in</strong>g seventeen year term of the headlease. The provision has been discounted.<br />
The fair value of deferred and cont<strong>in</strong>gent consideration recognised upon acquisition <strong>in</strong>cludes £8 million (£9 million undiscounted) of<br />
consideration cont<strong>in</strong>gent upon Filton achiev<strong>in</strong>g certa<strong>in</strong> levels of sales <strong>in</strong> 2013, 2014 and 2015. The undiscounted cont<strong>in</strong>gent consideration<br />
payable ranges from nil to £9 million.<br />
The acquisition date co<strong>in</strong>cided with the first day of operations <strong>in</strong> <strong>2009</strong>. Dur<strong>in</strong>g the year Filton contributed sales of £330 million and trad<strong>in</strong>g<br />
profit of £40 million.<br />
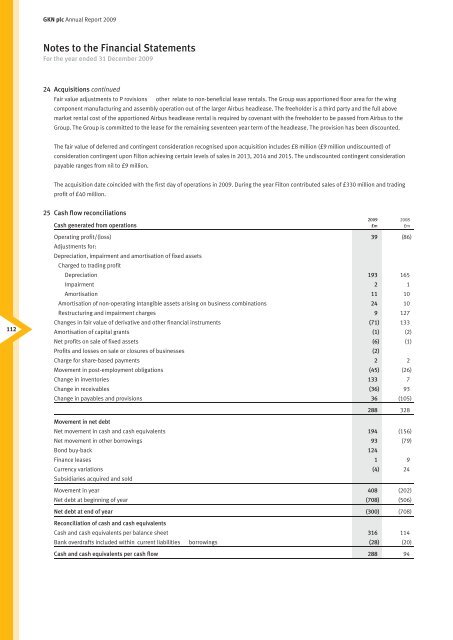
25 Cash flow reconciliations<br />
<strong>2009</strong> 2008<br />
Cash generated from operations £m £m<br />
Ñ<br />
Operat<strong>in</strong>g profit/(loss)<br />
Adjustments for:<br />
39 (86)<br />
Depreciation, impairment and amortisation of fixed assets<br />
Charged to trad<strong>in</strong>g profit<br />
Depreciation 193 165<br />
Impairment 2 1<br />
Amortisation 11 10<br />
Amortisation of non-operat<strong>in</strong>g <strong>in</strong>tangible assets aris<strong>in</strong>g on bus<strong>in</strong>ess comb<strong>in</strong>ations 24 10<br />
Restructur<strong>in</strong>g and impairment charges 9 127<br />
Changes <strong>in</strong> fair value of derivative and other f<strong>in</strong>ancial <strong>in</strong>struments (71) 133<br />
Amortisation of capital grants (1) (2)<br />
Net profits on sale of fixed assets (6) (1)<br />
Profits and losses on sale or closures of bus<strong>in</strong>esses (2)<br />
Charge for share-based payments 2 2<br />
Movement <strong>in</strong> post-employment obligations (45) (26)<br />
Change <strong>in</strong> <strong>in</strong>ventories 133 7<br />
Change <strong>in</strong> receivables (36) 93<br />
Change <strong>in</strong> payables and provisions 36 (105)<br />
288 328<br />
Ñ<br />
Ñ<br />
Movement <strong>in</strong> net debt<br />
Net movement <strong>in</strong> cash and cash equivalents 194 (156)<br />
Net movement <strong>in</strong> other borrow<strong>in</strong>gs 93 (79)<br />
Bond buy-back 124<br />
F<strong>in</strong>ance leases 1 9<br />
Currency variations (4) 24<br />
Subsidiaries acquired and sold Ñ<br />
Movement <strong>in</strong> year 408 (202)<br />
Net debt at beg<strong>in</strong>n<strong>in</strong>g of year (708) (506)<br />
Net debt at end of year (300) (708)<br />
Ô Ñ<br />
Reconciliation of cash and cash equivalents<br />
Cash and cash equivalents per balance sheet 316 114<br />
Bank overdrafts <strong>in</strong>cluded with<strong>in</strong> current liabilities borrow<strong>in</strong>gsÕ (28) (20)<br />
Cash and cash equivalents per cash flow 288 94