Annual Report 2009 in PDF - GKN
Annual Report 2009 in PDF - GKN
Annual Report 2009 in PDF - GKN

You also want an ePaper? Increase the reach of your titles
YUMPU automatically turns print PDFs into web optimized ePapers that Google loves.
www.gkn.com<br />
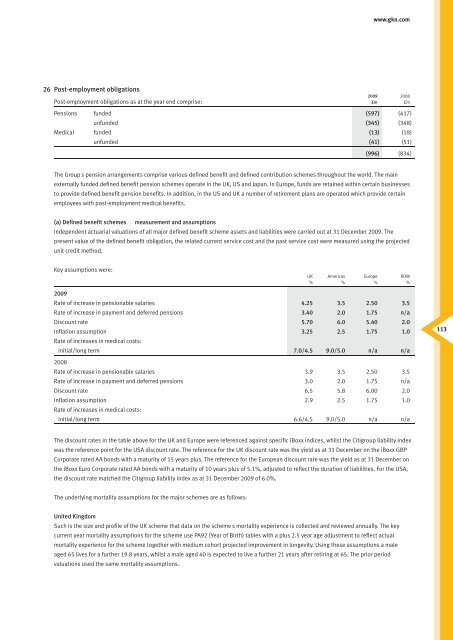
26 Post-employment obligations<br />
<strong>2009</strong> 2008<br />
Post-employment obligations as at the year end comprise: £m £m<br />
Pensions Ñ funded (597) (417)<br />
Ñ unfunded (345) (348)<br />
Medical Ñ funded (13) (18)<br />
Ñ unfunded (41) (51)<br />
(996) (834)<br />
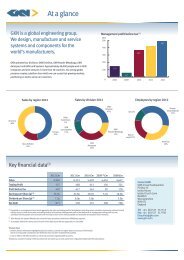
The GroupÕ s pension arrangements comprise various def<strong>in</strong>ed benefit and def<strong>in</strong>ed contribution schemes throughout the world. The ma<strong>in</strong><br />
externally funded def<strong>in</strong>ed benefit pension schemes operate <strong>in</strong> the UK, US and Japan. In Europe, funds are reta<strong>in</strong>ed with<strong>in</strong> certa<strong>in</strong> bus<strong>in</strong>esses<br />
to provide def<strong>in</strong>ed benefit pension benefits. In addition, <strong>in</strong> the US and UK a number of retirement plans are operated which provide certa<strong>in</strong><br />
employees with post-employment medical benefits.<br />
(a) Def<strong>in</strong>ed benefit schemes Ñ measurement and assumptions<br />
Independent actuarial valuations of all major def<strong>in</strong>ed benefit scheme assets and liabilities were carried out at 31 December <strong>2009</strong>. The<br />
present value of the def<strong>in</strong>ed benefit obligation, the related current service cost and the past service cost were measured us<strong>in</strong>g the projected<br />
unit credit method.<br />
Key assumptions were:<br />
UK Americas Europe ROW<br />
% % % %<br />
<strong>2009</strong><br />
Rate of <strong>in</strong>crease <strong>in</strong> pensionable salaries 4.25 3.5 2.50 3.5<br />
Rate of <strong>in</strong>crease <strong>in</strong> payment and deferred pensions 3.40 2.0 1.75 n/a<br />
Discount rate 5.70 6.0 5.40 2.0<br />
Inflation assumption<br />
Rate of <strong>in</strong>creases <strong>in</strong> medical costs:<br />
3.25 2.5 1.75 1.0<br />
<strong>in</strong>itial/long term 7.0/4.5 9.0/5.0 n/a n/a<br />
2008<br />
Rate of <strong>in</strong>crease <strong>in</strong> pensionable salaries 3.9 3.5 2.50 3.5<br />
Rate of <strong>in</strong>crease <strong>in</strong> payment and deferred pensions 3.0 2.0 1.75 n/a<br />
Discount rate 6.5 5.8 6.00 2.0<br />
Inflation assumption<br />
Rate of <strong>in</strong>creases <strong>in</strong> medical costs:<br />
2.9 2.5 1.75 1.0<br />
<strong>in</strong>itial/long term 6.6/4.5 9.0/5.0 n/a n/a<br />
The discount rates <strong>in</strong> the table above for the UK and Europe were referenced aga<strong>in</strong>st specific iBoxx <strong>in</strong>dices, whilst the Citigroup liability <strong>in</strong>dex<br />
was the reference po<strong>in</strong>t for the USA discount rate. The reference for the UK discount rate was the yield as at 31 December on the iBoxx GBP<br />
Corporate rated AA bonds with a maturity of 15 years plus. The reference for the European discount rate was the yield as at 31 December on<br />
the iBoxx Euro Corporate rated AA bonds with a maturity of 10 years plus of 5.1%, adjusted to reflect the duration of liabilities. For the USA,<br />
the discount rate matched the Citigroup liability <strong>in</strong>dex as at 31 December <strong>2009</strong> of 6.0%.<br />
The underly<strong>in</strong>g mortality assumptions for the major schemes are as follows:<br />
United K<strong>in</strong>gdom<br />
Such is the size and profile of the UK scheme that data on the schemeÕ s mortality experience is collected and reviewed annually. The key<br />
current year mortality assumptions for the scheme use PA92 (Year of Birth) tables with a plus 2.5 year age adjustment to reflect actual<br />
mortality experience for the scheme together with medium cohort projected improvement <strong>in</strong> longevity. Us<strong>in</strong>g these assumptions a male<br />
aged 65 lives for a further 19.8 years, whilst a male aged 40 is expected to live a further 21 years after retir<strong>in</strong>g at 65. The prior period<br />
valuations used the same mortality assumptions.<br />
113