Predictors of Bullying and Victimization in Childhood and Adolescence
Predictors of Bullying and Victimization in Childhood and Adolescence
Predictors of Bullying and Victimization in Childhood and Adolescence

You also want an ePaper? Increase the reach of your titles
YUMPU automatically turns print PDFs into web optimized ePapers that Google loves.
72 COOK, WILLIAMS, GUERRA, KIM, AND SADEK<br />
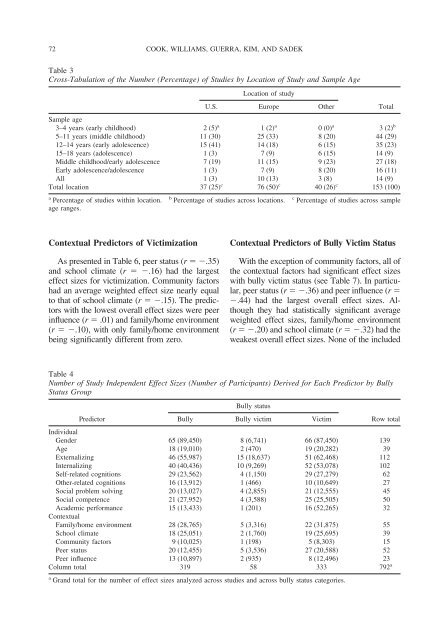
Table 3<br />
Cross-Tabulation <strong>of</strong> the Number (Percentage) <strong>of</strong> Studies by Location <strong>of</strong> Study <strong>and</strong> Sample Age<br />
Location <strong>of</strong> study<br />
U.S. Europe Other<br />
Total<br />
Sample age<br />
3–4 years (early childhood) 2 (5) a<br />
1 (2) a<br />
0 (0) a<br />
3 (2) b<br />
5–11 years (middle childhood) 11 (30) 25 (33) 8 (20) 44 (29)<br />
12–14 years (early adolescence) 15 (41) 14 (18) 6 (15) 35 (23)<br />
15–18 years (adolescence) 1 (3) 7 (9) 6 (15) 14 (9)<br />
Middle childhood/early adolescence 7 (19) 11 (15) 9 (23) 27 (18)<br />
Early adolescence/adolescence 1 (3) 7 (9) 8 (20) 16 (11)<br />
All 1 (3) 10 (13) 3 (8) 14 (9)<br />
Total location 37 (25) c<br />
76 (50) c<br />
40 (26) c<br />
153 (100)<br />
a<br />
Percentage <strong>of</strong> studies with<strong>in</strong> location.<br />
age ranges.<br />
Contextual <strong>Predictors</strong> <strong>of</strong> <strong>Victimization</strong><br />
As presented <strong>in</strong> Table 6, peer status (r .35)<br />
<strong>and</strong> school climate (r .16) had the largest<br />
effect sizes for victimization. Community factors<br />
had an average weighted effect size nearly equal<br />
to that <strong>of</strong> school climate (r .15). The predictors<br />
with the lowest overall effect sizes were peer<br />
<strong>in</strong>fluence (r .01) <strong>and</strong> family/home environment<br />
(r .10), with only family/home environment<br />
be<strong>in</strong>g significantly different from zero.<br />
b Percentage <strong>of</strong> studies across locations.<br />
c Percentage <strong>of</strong> studies across sample<br />
Contextual <strong>Predictors</strong> <strong>of</strong> Bully Victim Status<br />
With the exception <strong>of</strong> community factors, all <strong>of</strong><br />
the contextual factors had significant effect sizes<br />
with bully victim status (see Table 7). In particular,<br />
peer status (r .36) <strong>and</strong> peer <strong>in</strong>fluence (r <br />
.44) had the largest overall effect sizes. Although<br />
they had statistically significant average<br />
weighted effect sizes, family/home environment<br />
(r .20) <strong>and</strong> school climate (r .32) had the<br />
weakest overall effect sizes. None <strong>of</strong> the <strong>in</strong>cluded<br />
Table 4<br />
Number <strong>of</strong> Study Independent Effect Sizes (Number <strong>of</strong> Participants) Derived for Each Predictor by Bully<br />
Status Group<br />
Bully status<br />
Predictor<br />
Bully Bully victim Victim<br />
Row total<br />
Individual<br />
Gender 65 (89,450) 8 (6,741) 66 (87,450) 139<br />
Age 18 (19,010) 2 (470) 19 (20,282) 39<br />
Externaliz<strong>in</strong>g 46 (55,987) 15 (18,637) 51 (62,468) 112<br />
Internaliz<strong>in</strong>g 40 (40,436) 10 (9,269) 52 (53,078) 102<br />
Self-related cognitions 29 (23,562) 4 (1,150) 29 (27,279) 62<br />
Other-related cognitions 16 (13,912) 1 (466) 10 (10,649) 27<br />
Social problem solv<strong>in</strong>g 20 (13,027) 4 (2,855) 21 (12,555) 45<br />
Social competence 21 (27,952) 4 (3,588) 25 (25,505) 50<br />
Academic performance<br />
Contextual<br />
15 (13,433) 1 (201) 16 (52,265) 32<br />
Family/home environment 28 (28,765) 5 (3,316) 22 (31,875) 55<br />
School climate 18 (25,051) 2 (1,760) 19 (25,695) 39<br />
Community factors 9 (10,025) 1 (198) 5 (8,303) 15<br />
Peer status 20 (12,455) 5 (3,536) 27 (20,588) 52<br />
Peer <strong>in</strong>fluence 13 (10,897) 2 (935) 8 (12,496) 23<br />
Column total 319 58 333 792 a<br />
a<br />
Gr<strong>and</strong> total for the number <strong>of</strong> effect sizes analyzed across studies <strong>and</strong> across bully status categories.