Predictors of Bullying and Victimization in Childhood and Adolescence
Predictors of Bullying and Victimization in Childhood and Adolescence
Predictors of Bullying and Victimization in Childhood and Adolescence
Create successful ePaper yourself
Turn your PDF publications into a flip-book with our unique Google optimized e-Paper software.
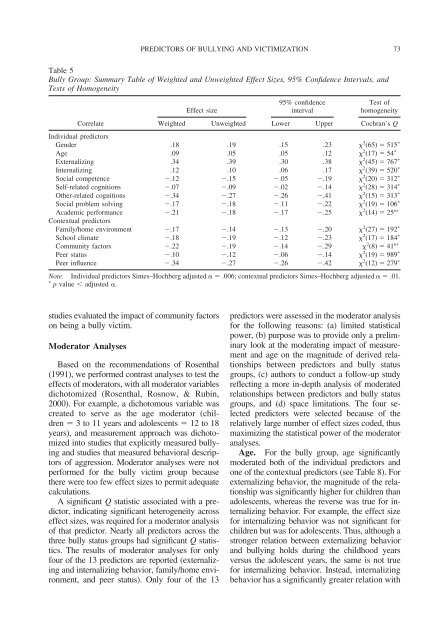
Table 5<br />
Bully Group: Summary Table <strong>of</strong> Weighted <strong>and</strong> Unweighted Effect Sizes, 95% Confidence Intervals, <strong>and</strong><br />
Tests <strong>of</strong> Homogeneity<br />
Correlate<br />
studies evaluated the impact <strong>of</strong> community factors<br />
on be<strong>in</strong>g a bully victim.<br />
Moderator Analyses<br />
Based on the recommendations <strong>of</strong> Rosenthal<br />
(1991), we performed contrast analyses to test the<br />
effects <strong>of</strong> moderators, with all moderator variables<br />
dichotomized (Rosenthal, Rosnow, & Rub<strong>in</strong>,<br />
2000). For example, a dichotomous variable was<br />
created to serve as the age moderator (children<br />
3 to 11 years <strong>and</strong> adolescents 12 to 18<br />
years), <strong>and</strong> measurement approach was dichotomized<br />
<strong>in</strong>to studies that explicitly measured bully<strong>in</strong>g<br />
<strong>and</strong> studies that measured behavioral descriptors<br />
<strong>of</strong> aggression. Moderator analyses were not<br />
performed for the bully victim group because<br />
there were too few effect sizes to permit adequate<br />
calculations.<br />
A significant Q statistic associated with a predictor,<br />
<strong>in</strong>dicat<strong>in</strong>g significant heterogeneity across<br />
effect sizes, was required for a moderator analysis<br />
<strong>of</strong> that predictor. Nearly all predictors across the<br />
three bully status groups had significant Q statistics.<br />
The results <strong>of</strong> moderator analyses for only<br />
four <strong>of</strong> the 13 predictors are reported (externaliz<strong>in</strong>g<br />
<strong>and</strong> <strong>in</strong>ternaliz<strong>in</strong>g behavior, family/home environment,<br />
<strong>and</strong> peer status). Only four <strong>of</strong> the 13<br />
PREDICTORS OF BULLYING AND VICTIMIZATION<br />
95% confidence<br />
Test <strong>of</strong><br />
Effect size<br />
<strong>in</strong>terval<br />
homogeneity<br />
Weighted Unweighted Lower Upper Cochran’s Q<br />
Individual predictors<br />
Gender .18 .19 .15 .23 2 (65) 515 <br />
Age .09 .05 .05 .12 2 (17) 54 <br />
Externaliz<strong>in</strong>g .34 .39 .30 .38 2 (45) 767 <br />
Internaliz<strong>in</strong>g .12 .10 .06 .17 2 (39) 520 <br />
Social competence .12 .15 .05 .19 2 (20) 312 <br />
Self-related cognitions .07 .09 .02 .14 2 (28) 314 <br />
Other-related cognitions .34 .27 .26 .41 2 (15) 313 <br />
Social problem solv<strong>in</strong>g .17 .18 .11 .22 2 (19) 106 <br />
Academic performance .21 .18 .17 .25 2 (14) 25 ns<br />
Contextual predictors<br />
Family/home environment .17 .14 .13 .20 2 (27) 192 <br />
School climate .18 .19 .12 .23 2 (17) 184 <br />
Community factors .22 .19 .14 .29 2 (8) 41 ns<br />
Peer status .10 .12 .06 .14 2 (19) 989 <br />
Peer <strong>in</strong>fluence .34 .27 .26 .42 2 (12) 279 <br />
Note. Individual predictors Simes–Hochberg adjusted .006; contextual predictors Simes–Hochberg adjusted .01.<br />
p value adjusted .<br />
predictors were assessed <strong>in</strong> the moderator analysis<br />
for the follow<strong>in</strong>g reasons: (a) limited statistical<br />
power, (b) purpose was to provide only a prelim<strong>in</strong>ary<br />
look at the moderat<strong>in</strong>g impact <strong>of</strong> measurement<br />
<strong>and</strong> age on the magnitude <strong>of</strong> derived relationships<br />
between predictors <strong>and</strong> bully status<br />
groups, (c) authors to conduct a follow-up study<br />
reflect<strong>in</strong>g a more <strong>in</strong>-depth analysis <strong>of</strong> moderated<br />
relationships between predictors <strong>and</strong> bully status<br />
groups, <strong>and</strong> (d) space limitations. The four selected<br />
predictors were selected because <strong>of</strong> the<br />
relatively large number <strong>of</strong> effect sizes coded, thus<br />
maximiz<strong>in</strong>g the statistical power <strong>of</strong> the moderator<br />
analyses.<br />
Age. For the bully group, age significantly<br />
moderated both <strong>of</strong> the <strong>in</strong>dividual predictors <strong>and</strong><br />
one <strong>of</strong> the contextual predictors (see Table 8). For<br />
externaliz<strong>in</strong>g behavior, the magnitude <strong>of</strong> the relationship<br />
was significantly higher for children than<br />
adolescents, whereas the reverse was true for <strong>in</strong>ternaliz<strong>in</strong>g<br />
behavior. For example, the effect size<br />
for <strong>in</strong>ternaliz<strong>in</strong>g behavior was not significant for<br />
children but was for adolescents. Thus, although a<br />
stronger relation between externaliz<strong>in</strong>g behavior<br />
<strong>and</strong> bully<strong>in</strong>g holds dur<strong>in</strong>g the childhood years<br />
versus the adolescent years, the same is not true<br />
for <strong>in</strong>ternaliz<strong>in</strong>g behavior. Instead, <strong>in</strong>ternaliz<strong>in</strong>g<br />
behavior has a significantly greater relation with<br />
73


