Measurement of the Sol–Gel Transition Temperature in Agar
Measurement of the Sol–Gel Transition Temperature in Agar
Measurement of the Sol–Gel Transition Temperature in Agar

You also want an ePaper? Increase the reach of your titles
YUMPU automatically turns print PDFs into web optimized ePapers that Google loves.
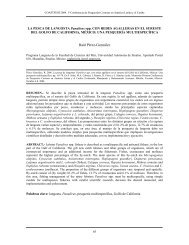
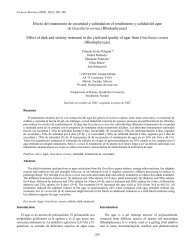
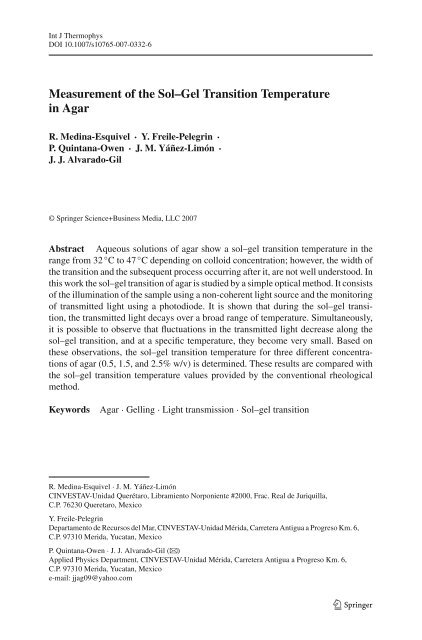
Int J Thermophys<br />
DOI 10.1007/s10765-007-0332-6<br />
<strong>Measurement</strong> <strong>of</strong> <strong>the</strong> <strong>Sol–Gel</strong> <strong>Transition</strong> <strong>Temperature</strong><br />
<strong>in</strong> <strong>Agar</strong><br />
R. Med<strong>in</strong>a-Esquivel · Y. Freile-Pelegr<strong>in</strong> ·<br />
P. Qu<strong>in</strong>tana-Owen · J. M. Yáñez-Limón ·<br />
J. J. Alvarado-Gil<br />
© Spr<strong>in</strong>ger Science+Bus<strong>in</strong>ess Media, LLC 2007<br />
Abstract Aqueous solutions <strong>of</strong> agar show a sol–gel transition temperature <strong>in</strong> <strong>the</strong><br />
range from 32 ◦ Cto47 ◦ C depend<strong>in</strong>g on colloid concentration; however, <strong>the</strong> width <strong>of</strong><br />
<strong>the</strong> transition and <strong>the</strong> subsequent process occurr<strong>in</strong>g after it, are not well understood. In<br />
this work <strong>the</strong> sol–gel transition <strong>of</strong> agar is studied by a simple optical method. It consists<br />
<strong>of</strong> <strong>the</strong> illum<strong>in</strong>ation <strong>of</strong> <strong>the</strong> sample us<strong>in</strong>g a non-coherent light source and <strong>the</strong> monitor<strong>in</strong>g<br />
<strong>of</strong> transmitted light us<strong>in</strong>g a photodiode. It is shown that dur<strong>in</strong>g <strong>the</strong> sol–gel transition,<br />
<strong>the</strong> transmitted light decays over a broad range <strong>of</strong> temperature. Simultaneously,<br />
it is possible to observe that fluctuations <strong>in</strong> <strong>the</strong> transmitted light decrease along <strong>the</strong><br />
sol–gel transition, and at a specific temperature, <strong>the</strong>y become very small. Based on<br />
<strong>the</strong>se observations, <strong>the</strong> sol–gel transition temperature for three different concentrations<br />
<strong>of</strong> agar (0.5, 1.5, and 2.5% w/v) is determ<strong>in</strong>ed. These results are compared with<br />
<strong>the</strong> sol–gel transition temperature values provided by <strong>the</strong> conventional rheological<br />
method.<br />
Keywords <strong>Agar</strong> · Gell<strong>in</strong>g · Light transmission · Sol–gel transition<br />
R. Med<strong>in</strong>a-Esquivel · J. M. Yáñez-Limón<br />
CINVESTAV-Unidad Querétaro, Libramiento Norponiente #2000, Frac. Real de Juriquilla,<br />
C.P. 76230 Queretaro, Mexico<br />
Y. Freile-Pelegr<strong>in</strong><br />
Departamento de Recursos del Mar, CINVESTAV-Unidad Mérida, Carretera Antigua a Progreso Km. 6,<br />
C.P. 97310 Merida, Yucatan, Mexico<br />
P. Qu<strong>in</strong>tana-Owen · J. J. Alvarado-Gil (B)<br />
Applied Physics Department, CINVESTAV-Unidad Mérida, Carretera Antigua a Progreso Km. 6,<br />
C.P. 97310 Merida, Yucatan, Mexico<br />
e-mail: jjag09@yahoo.com<br />
123
1 Introduction<br />
Int J Thermophys<br />
<strong>Agar</strong> is a phycocolloid, which is constructed from complex polysaccharide molecules<br />
(d-galactose and 3,6-anhydro-l-galactose units) that is extracted from certa<strong>in</strong> species<br />
<strong>of</strong> red algae (Gelidium, Gelidiela, Pterocladia, Gracilaria, Graciliaropsis, and Ahfeltia).<br />
The most important property <strong>of</strong> this substance is its capability to form gels simply<br />
by cool<strong>in</strong>g hot aqueous solutions without <strong>the</strong> need <strong>of</strong> acidic conditions or oxidiz<strong>in</strong>g<br />
agents. This characteristic gives agars <strong>the</strong> ability to perform a reversible gell<strong>in</strong>g process<br />
without los<strong>in</strong>g <strong>the</strong>ir mechanical and <strong>the</strong>rmal properties [1]. The gell<strong>in</strong>g process<br />
<strong>in</strong> agar is due to <strong>the</strong> formation <strong>of</strong> hydrogen bonds <strong>in</strong> a cont<strong>in</strong>uous way (Fig. 1) [1].<br />
Ano<strong>the</strong>r important property <strong>of</strong> agar is its significant <strong>the</strong>rmal hysteresis, <strong>in</strong> which <strong>the</strong><br />
temperature difference between gell<strong>in</strong>g (Tsg)(32 ◦ C–47 ◦ C) and melt<strong>in</strong>g (80 ◦ C–92 ◦ C)<br />
is very wide. These properties make agar useful as a prototype model for all gell<strong>in</strong>g<br />
systems and useful <strong>in</strong> a great variety <strong>of</strong> applications [1]. In <strong>the</strong> food <strong>in</strong>dustry, it is used<br />
as a gell<strong>in</strong>g, thicken<strong>in</strong>g, and stabiliz<strong>in</strong>g additive. Pharmaceutical applications <strong>of</strong> agar<br />
range from laxant to excipient and release agent. In <strong>the</strong> bacteriology area, it is used as<br />
a substrate media <strong>in</strong> which microbial organisms can grow. <strong>Agar</strong> is also used <strong>in</strong> some<br />
molecular microbiology techniques to obta<strong>in</strong> DNA <strong>in</strong>formation [1,2].<br />
In this work, a simple new methodology to study <strong>the</strong> gell<strong>in</strong>g process <strong>of</strong> agar solutions<br />
by means <strong>of</strong> <strong>the</strong> <strong>in</strong>crease <strong>in</strong> <strong>the</strong> optical dispersion and <strong>the</strong> subsequent decrease <strong>in</strong><br />
<strong>the</strong> transmitted light, when <strong>the</strong> system cools, is presented. Based on our results, two<br />
methods are proposed to analyze <strong>the</strong> sol–gel transition <strong>in</strong> terms <strong>of</strong> <strong>the</strong> light transmission,<br />
one <strong>of</strong> <strong>the</strong>m based on <strong>the</strong> k<strong>in</strong>etics <strong>of</strong> its decay and <strong>the</strong> o<strong>the</strong>r on <strong>the</strong> fluctuation <strong>of</strong><br />
<strong>the</strong> signal registered by <strong>the</strong> photodiode. The results obta<strong>in</strong>ed for <strong>the</strong> sol–gel transition<br />
Fig. 1 Mechanisms <strong>of</strong> gel formation <strong>in</strong> agars are due to hydrogen bond<strong>in</strong>g, which forces double helix<br />
formation<br />
123
Int J Thermophys<br />
temperatures for <strong>the</strong> different agar solution concentrations are compared with correspond<strong>in</strong>g<br />
values obta<strong>in</strong>ed by <strong>the</strong> traditional rheological method.<br />
2 Experimental<br />
2.1 Samples<br />
Powder bacteriological agar extracted from mar<strong>in</strong>e algae <strong>of</strong> <strong>the</strong> genus Gelidium was<br />
used (BD Bioxon, Becton Dick<strong>in</strong>son). Three concentrations, 0.5, 1.5, and 2.5% w/v<br />
<strong>of</strong> agar dissolved <strong>in</strong> boil<strong>in</strong>g distilled water, were prepared, <strong>in</strong> order to study <strong>the</strong> sol–<br />
gel transition process by means <strong>of</strong> <strong>the</strong> rheological method and <strong>the</strong> optical methods<br />
proposed <strong>in</strong> this work.<br />
2.2 Rheological Method<br />
There are various k<strong>in</strong>ds <strong>of</strong> rheological techniques to measure <strong>the</strong> Tsg <strong>in</strong> gell<strong>in</strong>g substances<br />
[3–5]. The most extended method, due to its simplicity, is <strong>the</strong> one <strong>in</strong> which a<br />
Pyrex glass sphere <strong>of</strong> 5 mm diameter is mov<strong>in</strong>g at <strong>the</strong> bottom <strong>of</strong> an assay tube filled<br />
with a solution <strong>of</strong> agar, above <strong>the</strong> temperature at which <strong>the</strong> sol–gel transition occurs<br />
[5]. When <strong>the</strong> sample is cooled, <strong>the</strong> temperature, at which <strong>the</strong> bead stops due to <strong>the</strong><br />
gell<strong>in</strong>g process, is identified as Tsg. The experiments for each concentration were performed<br />
<strong>in</strong> triplicate <strong>in</strong> order to verify repeatability and to determ<strong>in</strong>e <strong>the</strong> standard error<br />
<strong>of</strong> <strong>the</strong> mean (error bars) <strong>of</strong> <strong>the</strong> measured parameters.<br />
2.3 Optical Method<br />
A home-made Teflon cyl<strong>in</strong>drical cell (Fig. 2) was used. It conta<strong>in</strong>s a compartment<br />
<strong>in</strong> which <strong>the</strong> agar sample was placed. At one <strong>of</strong> <strong>the</strong> flat faces <strong>of</strong> <strong>the</strong> cyl<strong>in</strong>der, a m<strong>in</strong>ilamp<br />
with a tungsten filament was <strong>in</strong>stalled (Radio Shack 272-1141A). At <strong>the</strong> opposite<br />
side, a glass optical bundle was mounted; its purpose was to collect <strong>the</strong> light transmitted<br />
through <strong>the</strong> sample and send it <strong>in</strong>to a germanium photodiode (EG&G Judson<br />
J-16-5SP-R03M-SC). The signal was amplified us<strong>in</strong>g a home-made transimpedance<br />
amplifier and sent to a Keithley multimeter Model 2000.<br />
In Fig. 3, <strong>the</strong> experimental setup used <strong>in</strong> this work is presented. The cyl<strong>in</strong>drical cell<br />
and <strong>the</strong> temperature sensor are immersed <strong>in</strong> a high precision (less than 0.05 ◦ C) temperature-controlled<br />
water bath regulated by a fully automated PID computer algorithm<br />
[6] developed <strong>in</strong> LABVIEW 6.0 and a Peltier <strong>the</strong>rmoelectric element (TE Technology<br />
Inc. Model TE-2-(127-127)-1.15) placed at <strong>the</strong> bottom <strong>of</strong> <strong>the</strong> water recipient,<br />
and fed with a Sorensen DCS 40-25 programmable DC power supply. The system<br />
is able to perform l<strong>in</strong>ear temperature scans from 5 ◦ Cto70 ◦ C at a maximum rate <strong>of</strong><br />
0.5 ◦ C · m<strong>in</strong> −1 . The water-bath temperature was measured us<strong>in</strong>g a LM35DZ precision<br />
<strong>in</strong>tegrated-circuit temperature sensor, and registered with one <strong>of</strong> <strong>the</strong> channels <strong>of</strong> <strong>the</strong><br />
same Keithley multimeter mentioned above.<br />
123
Fig. 2 Cross section <strong>of</strong> <strong>the</strong><br />
optical cell used: (a) sample, (b)<br />
optical bundle, (c) non-coherent<br />
light source, (d) Plexiglas<br />
w<strong>in</strong>dow, (e) Teflon cyl<strong>in</strong>der, (f)<br />
light source mobile screw, (g)<br />
DC power l<strong>in</strong>e, and (h) NTC<br />
<strong>the</strong>rmistor<br />
Int J Thermophys<br />
To develop <strong>the</strong> experiment, <strong>the</strong> agar solution is heated to 85 ◦ C, and <strong>the</strong>n placed<br />
<strong>in</strong>side <strong>the</strong> measurement cell compartment at a constant 48 ◦ C temperature. When <strong>the</strong><br />
system reached <strong>the</strong>rmal equilibrium, <strong>the</strong> l<strong>in</strong>ear decreas<strong>in</strong>g temperature scan began, at<br />
arate<strong>of</strong>0.4 ◦ C · m<strong>in</strong> −1 . The temperature <strong>in</strong>side <strong>the</strong> cell was measured with a NTC<br />
<strong>the</strong>rmistor (Beta<strong>the</strong>rm Model 100K6A1ID), and <strong>the</strong> photodiode signal was registered<br />
by <strong>the</strong> multimeter and sent to a personal computer (Fig. 3). In order to analyze <strong>the</strong><br />
complete sol–gel transition, <strong>the</strong> measurements were performed from 48 ◦ Cto20 ◦ C.<br />
The experiments for each concentration were performed <strong>in</strong> triplicate <strong>in</strong> order to verify<br />
repeatability and to determ<strong>in</strong>e <strong>the</strong> standard error <strong>of</strong> <strong>the</strong> mean (error bars) <strong>of</strong> <strong>the</strong><br />
measured parameters.<br />
3 Results<br />
In Fig. 4, <strong>the</strong> dependence <strong>of</strong> <strong>the</strong> photodiode voltage signal (V )asafunction<strong>of</strong>temperature<br />
for three typical different agar samples is presented. The transmitted light<br />
decays dur<strong>in</strong>g <strong>the</strong> sol–gel transition due to <strong>the</strong> light dispersion <strong>in</strong>duced by <strong>the</strong> gradual<br />
formation <strong>of</strong> a network <strong>of</strong> agar molecules jo<strong>in</strong>ed by hydrogen bond<strong>in</strong>g while <strong>the</strong> transition<br />
evolves (Fig. 1). The k<strong>in</strong>etics <strong>of</strong> <strong>the</strong> decay exhibits an asymmetric sigmoidal-like<br />
behavior.<br />
In order to analyze <strong>the</strong> optical signal, <strong>the</strong> first derivative <strong>of</strong> <strong>the</strong> voltage (dV /dT )was<br />
obta<strong>in</strong>ed (Fig. 5a). It can be observed that dV /dT shows a maximum at a temperature<br />
Tc. Consider<strong>in</strong>g that light dispersion <strong>in</strong>creases due to <strong>the</strong> formation <strong>of</strong> new hydrogen<br />
bonds, Tc is a critical temperature at which <strong>the</strong> formation rate <strong>of</strong> bond<strong>in</strong>g reaches a<br />
123
Int J Thermophys<br />
Fig. 3 Experimental setup: (a) sample cell, (b) water bath, (c) optical fiber, (d) photodiode, (e) photodiode<br />
amplifier, (f) Computer, (g) Peltier cell, (h) water radiator, (i) DC voltage polarizer, (j) programmable DC<br />
power supply, (k) low voltage DC power supply, (l) stirr<strong>in</strong>g device, (m) magnetic stirrer, (n) temperature<br />
sensor (for water bath temperature control), (o) multimeter, and (p) NTC <strong>the</strong>rmistor temperature sensor (for<br />
cell temperature record)<br />
Fig. 4 Typical experimental results for <strong>the</strong> photodiode sensor voltage (with transmitted light mode) dur<strong>in</strong>g<br />
<strong>the</strong> sol–gel transition. The different l<strong>in</strong>es are for <strong>the</strong> three dist<strong>in</strong>ct agar concentrations analyzed (0.5, 1.5,<br />
and 2.5%)<br />
123
Int J Thermophys<br />
Fig. 5 (a) Derivative <strong>of</strong> <strong>the</strong> photodiode sensor voltage for <strong>the</strong> agar samples dur<strong>in</strong>g <strong>the</strong> gelation process and<br />
(b) second derivative <strong>of</strong> <strong>the</strong> photodiode sensor voltage<br />
maximum, and for lower temperatures, <strong>the</strong> rate <strong>of</strong> formation <strong>of</strong> those bonds beg<strong>in</strong>s to<br />
decrease. Therefore, <strong>the</strong> temperature Tc separates two different stages <strong>of</strong> <strong>the</strong> transition<br />
and can be considered as a useful def<strong>in</strong>ition <strong>of</strong> <strong>the</strong> sol–gel transition temperature Tsg.<br />
It can also be observed from Fig. 5a, that samples with higher concentrations (2.5%<br />
and 1.5%) show clearly <strong>the</strong> temperature at which <strong>the</strong> first derivative <strong>of</strong> <strong>the</strong> voltage<br />
(dV /dT ) has a maximum. However, <strong>the</strong> samples with low agar concentration (0.5%)<br />
show <strong>in</strong> <strong>the</strong> middle <strong>of</strong> <strong>the</strong> temperature range, around 27.7 ◦ C, a nearly constant value.<br />
In order to have a better understand<strong>in</strong>g <strong>of</strong> this behavior, <strong>the</strong> second derivative <strong>of</strong> <strong>the</strong><br />
signal (d 2 V /dT 2 )(seeFig.5b) was obta<strong>in</strong>ed. It can be observed that <strong>the</strong> second derivative<br />
<strong>of</strong> <strong>the</strong> voltage is nearly constant and equal to zero <strong>in</strong> <strong>the</strong> <strong>in</strong>terval from 25 ◦ Cto<br />
30 ◦ C for 0.5% agar concentration. This <strong>in</strong>dicates that <strong>in</strong> this range, it is not possible to<br />
resolve <strong>the</strong> precise temperature at which <strong>the</strong> first derivative exhibits a maximum and,<br />
123
Int J Thermophys<br />
Fig. 6 Spontaneous fluctuations <strong>of</strong> <strong>the</strong> transmitted light as a function <strong>of</strong> temperature. The fluctuations<br />
decrease when <strong>the</strong> sol–gel transition proceeds due to <strong>the</strong> decrease <strong>in</strong> temperature<br />
consequently, <strong>the</strong> sol–gel transition temperature. Therefore, <strong>the</strong> result for Tsg, obta<strong>in</strong>ed<br />
for <strong>the</strong> sample with 0.5% agar concentration shown <strong>in</strong> Fig. 5, is (27.7 ± 2.6) ◦ C.<br />
The optical transmission method shows that <strong>the</strong> gellification process occurs over<br />
a range <strong>of</strong> temperature. The width <strong>of</strong> <strong>the</strong> transition can be def<strong>in</strong>ed as <strong>the</strong> temperature<br />
range whose lower and upper limits are <strong>the</strong> pair <strong>of</strong> temperatures T1 and T2(T1 < T2)<br />
at which <strong>the</strong> magnitude <strong>of</strong> <strong>the</strong> derivative <strong>of</strong> <strong>the</strong> temperature (dV /dT ) falls to 40% <strong>of</strong><br />
its maximum (see Fig. 5a). The sol–gel transition takes several degrees to settle down,<br />
becom<strong>in</strong>g wider when <strong>the</strong> agar concentration decreases. The values obta<strong>in</strong>ed for <strong>the</strong><br />
width <strong>of</strong> <strong>the</strong> transition are 3.6 ◦ C for 2.5%, 4.2 ◦ C for 1.5%, and 11.6 ◦ C for 0.5%.<br />
In addition to <strong>the</strong> treatment presented above for <strong>the</strong> optical transmission method,<br />
<strong>the</strong> sol–gel transition can be studied by a fluctuation analysis <strong>of</strong> <strong>the</strong> optical signal [7].<br />
In order to analyze <strong>the</strong> temperature at which noise decreases, a polynomial fit <strong>of</strong> <strong>the</strong><br />
curves for <strong>the</strong> optical signal (shown <strong>in</strong> Fig. 4) was performed. After this, <strong>the</strong> difference<br />
between <strong>the</strong> experimental data for <strong>the</strong> optical signal at each temperature and <strong>the</strong> value<br />
generated by <strong>the</strong> fitt<strong>in</strong>g polynomial, at <strong>the</strong> same temperature, was determ<strong>in</strong>ed. The<br />
results <strong>of</strong> <strong>the</strong> differences as a function <strong>of</strong> <strong>the</strong> temperature are shown <strong>in</strong> Fig. 6. In order<br />
to analyze <strong>the</strong>se data, <strong>the</strong> standard deviation <strong>of</strong> <strong>the</strong>m (<strong>in</strong> groups <strong>of</strong> 20 consecutive<br />
values) is calculated. In Fig. 7, <strong>the</strong> standard deviation data are shown. They were fitted<br />
us<strong>in</strong>g a Boltzmann sigmoidal equation (cont<strong>in</strong>uous l<strong>in</strong>e <strong>in</strong> Fig. 7). The temperature<br />
123
Int J Thermophys<br />
Fig. 7 Fluctuation standard deviation (<strong>in</strong> groups <strong>of</strong> 20 data). Cont<strong>in</strong>uous l<strong>in</strong>e corresponds to a sigmoidal<br />
fit<br />
Td, where <strong>the</strong> fluctuations show a critical change, corresponds to <strong>the</strong> <strong>in</strong>flection po<strong>in</strong>t<br />
<strong>of</strong> <strong>the</strong> sigmoidal fitt<strong>in</strong>g curves (i.e., <strong>the</strong> middle po<strong>in</strong>t <strong>in</strong> <strong>the</strong> function step).<br />
As can be observed from Figs. 6 and 7, fluctuations decrease strongly close to <strong>the</strong><br />
temperature Td and ma<strong>in</strong>ta<strong>in</strong> a small value after that. These fluctuations <strong>in</strong> <strong>the</strong> voltage<br />
are caused by <strong>the</strong> <strong>the</strong>rmal convection <strong>of</strong> randomly localized distributed regions<br />
with different optical densities <strong>in</strong> <strong>the</strong> agar system. As <strong>the</strong> movement <strong>of</strong> <strong>the</strong> molecules<br />
decreases dur<strong>in</strong>g <strong>the</strong> sol–gel transition, <strong>the</strong> viscosity <strong>in</strong>creases, and as a consequence,<br />
<strong>the</strong> fluctuations <strong>of</strong> <strong>the</strong> optical signal decrease [7]. Due to this fact, <strong>the</strong> temperature Td<br />
could be a useful def<strong>in</strong>ition <strong>of</strong> <strong>the</strong> sol–gel transition temperature (Tsg).<br />
The results for <strong>the</strong> sol–gel transition temperature, obta<strong>in</strong>ed us<strong>in</strong>g <strong>the</strong> three different<br />
methods (rheological, optical dispersion, and fluctuation), are presented <strong>in</strong> Fig. 8.<br />
It is shown that <strong>the</strong> sol–gel transition temperature <strong>in</strong>creases, <strong>in</strong> all cases, with agar<br />
concentration, consistent with literature results [2]. The difference <strong>in</strong> <strong>the</strong> results <strong>of</strong><br />
<strong>the</strong> sol–gel transition temperature for <strong>the</strong> three different techniques is due to <strong>the</strong> fact<br />
that <strong>the</strong> same process is be<strong>in</strong>g monitored from different perspectives <strong>in</strong> each case.<br />
In a very wide transition, as <strong>the</strong> gell<strong>in</strong>g process presented by agar, this result should<br />
be expected. Dur<strong>in</strong>g <strong>the</strong> sol–gel transition, <strong>the</strong> hydrogen bond<strong>in</strong>g <strong>of</strong> <strong>the</strong> molecules<br />
makes <strong>the</strong> system stiffer and more dispersive to light. At a certa<strong>in</strong> stage, <strong>the</strong> sample<br />
has reached a threshold viscosity that can stop <strong>the</strong> movement <strong>of</strong> <strong>the</strong> bead <strong>in</strong> <strong>the</strong><br />
123
Int J Thermophys<br />
Fig. 8 Sol–gel transitions temperatures Tc <strong>in</strong> agar (at 0.5, 1.5, and 2.5% <strong>of</strong> agar concentration), measured<br />
with <strong>the</strong> rheological, optical light dispersion, and optical fluctuation methods<br />
rheological method. However, <strong>the</strong> transition still cont<strong>in</strong>ues; this can be observed by<br />
<strong>the</strong> fact that <strong>the</strong> decrease <strong>in</strong> light transmission persists at lower temperatures. As a<br />
consequence <strong>in</strong> <strong>the</strong> transmittance optical method, <strong>the</strong> <strong>in</strong>flection po<strong>in</strong>t <strong>of</strong> <strong>the</strong> observed<br />
transition (Figs. 4 and 5) is displaced to lower temperatures provid<strong>in</strong>g a lower value<br />
for Tsg. In contrast, <strong>the</strong> fluctuations <strong>of</strong> <strong>the</strong> optical signal are strongly dependent on<br />
<strong>the</strong> viscosity, <strong>the</strong> stage at which <strong>the</strong> bead has stopped (<strong>in</strong> <strong>the</strong> rheological method)<br />
corresponds to <strong>the</strong> f<strong>in</strong>al stage <strong>of</strong> <strong>the</strong> fluctuations, and <strong>the</strong>refore, <strong>the</strong> values provided<br />
for Tsg by <strong>the</strong> fluctuations method are <strong>the</strong> highest <strong>of</strong> <strong>the</strong> three methods <strong>in</strong>vestigated<br />
here.<br />
The rheological method, widely used because <strong>of</strong> its simplicity, depends on <strong>the</strong><br />
mechanical movement <strong>of</strong> a bead; this movement <strong>in</strong>terferes, partially retard<strong>in</strong>g <strong>the</strong><br />
gelation process due to <strong>the</strong> collision <strong>of</strong> <strong>the</strong> mov<strong>in</strong>g bead with <strong>the</strong> bond<strong>in</strong>g agar molecules.<br />
In contrast, <strong>the</strong> optical methods presented <strong>in</strong> this work, provide non-destructive<br />
and non-<strong>in</strong>vasive characterization <strong>of</strong> <strong>the</strong> sol–gel transition <strong>in</strong> agar. On <strong>the</strong> one hand,<br />
<strong>the</strong> optical transmission method permits observation <strong>of</strong> <strong>the</strong> whole evolution <strong>of</strong> <strong>the</strong><br />
transition process, but with a large error <strong>in</strong> <strong>the</strong> measurement <strong>of</strong> Tsg, ma<strong>in</strong>ly for low<br />
agar concentrations. On <strong>the</strong> o<strong>the</strong>r hand, <strong>the</strong> optical fluctuation method provides a<br />
precise measurement <strong>of</strong> <strong>the</strong> sol–gel transition temperature for all agar concentrations<br />
analyzed.<br />
4 Conclusions<br />
The sol–gel transition <strong>of</strong> three different concentrations <strong>of</strong> agar <strong>in</strong> aqueous solution<br />
has been studied by a novel optical light transmission technique. It has been shown<br />
that <strong>the</strong> transition can be observed as a cont<strong>in</strong>uous decrease <strong>of</strong> <strong>the</strong> transmitted light.<br />
The monitor<strong>in</strong>g <strong>of</strong> <strong>the</strong> light transmission and its fluctuation are useful to determ<strong>in</strong>e<br />
123
Int J Thermophys<br />
<strong>the</strong> sol–gel transition temperature. The results for Tsg are compared with <strong>the</strong> correspond<strong>in</strong>g<br />
values obta<strong>in</strong>ed by <strong>the</strong> traditional rheological method. The results obta<strong>in</strong>ed<br />
us<strong>in</strong>g <strong>the</strong> transmitted light fluctuation and rheological methods, which depend on <strong>the</strong><br />
change <strong>of</strong> viscosity dur<strong>in</strong>g <strong>the</strong> transition, provide higher values <strong>of</strong> Tsg, as compared<br />
with <strong>the</strong> light transmission method.<br />
The light transmission method can be used to monitor a wider range <strong>of</strong> temperature,<br />
be<strong>in</strong>g useful to monitor <strong>the</strong> transition dynamics for even lower temperatures at which<br />
<strong>the</strong> viscosity related methods are not reliable.<br />
Acknowledgments This work was partially supported by <strong>the</strong> CONACYT 38493-U Project. The authors<br />
want to express <strong>the</strong>ir acknowledgments to M.S.J. Bante and M.S.D. Aguilar for <strong>the</strong>ir valuable help <strong>in</strong> <strong>the</strong><br />
cell and electronic construction, and E. Ernesto Villaescusa from Beta<strong>the</strong>rm.<br />
References<br />
1. A.M. Stephen, G.O. Phillips, P.A. Williams, Food Polysaccharides and Their Applications (Marcel<br />
Dekker Inc., New York, Basel, 1995), pp. 187–203<br />
2. S. Dumitriu, Polysaccharides: Structural Diversity and Functional Versatility (Marcel Dekker Inc., New<br />
York, 1988)<br />
3. M.-F. Lai, C.-Y. Lii, Int. J. Biol. Macromol. 21, 123 (1997)<br />
4. R. Med<strong>in</strong>a-Esquivel, J.M. Yánez-Limón, J.J. Alvarado-Gil, J. Phys. IV 125, 811 (2005)<br />
5. A.Q. Hurtado-Ponce, I. Umezaki, Bot. Mar. 31, 171 (1988)<br />
6. K.J. Åström, T. Hägglund, PID Controllers: Theory, Design and Tun<strong>in</strong>g (Instrument Society <strong>of</strong> America,<br />
Research Triangle Park, North Carol<strong>in</strong>a, 1995)<br />
7. V.A. Bogatyrev, V.A. Piskunov, S.Y. Shchegolev, N.M. Ptichk<strong>in</strong>a, Colloidal J. 63, 270 (2001)<br />
123