HAND, a new terrain descriptor using SRTM-DEM - DPI - Inpe
HAND, a new terrain descriptor using SRTM-DEM - DPI - Inpe
HAND, a new terrain descriptor using SRTM-DEM - DPI - Inpe

You also want an ePaper? Increase the reach of your titles
YUMPU automatically turns print PDFs into web optimized ePapers that Google loves.
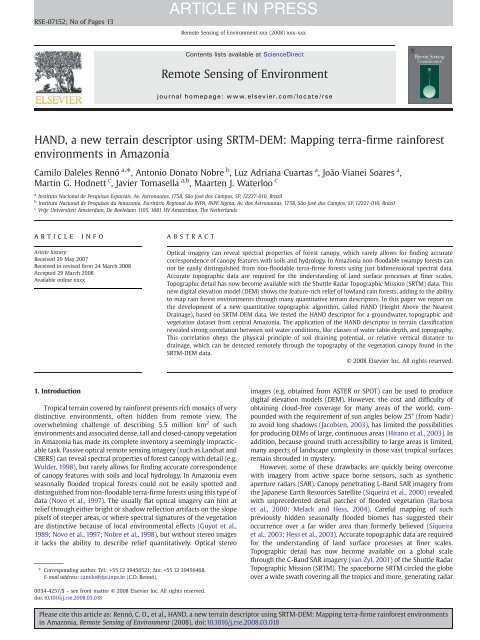
RSE-07152; No of Pages 13<br />
<strong>HAND</strong>, a <strong>new</strong> <strong>terrain</strong> <strong>descriptor</strong> <strong>using</strong> <strong>SRTM</strong>-<strong>DEM</strong>: Mapping terra-firme rainforest<br />
environments in Amazonia<br />
Camilo Daleles Rennó a, ⁎, Antonio Donato Nobre b , Luz Adriana Cuartas a , João Vianei Soares a ,<br />
Martin G. Hodnett c , Javier Tomasella a,b , Maarten J. Waterloo c<br />
a Instituto Nacional de Pesquisas Espaciais, Av. Astronautas, 1758, São José dos Campos, SP, 12227-010, Brazil<br />
b Instituto Nacional de Pesquisas da Amazonia, Escritório Regional do INPA, INPE Sigma, Av. dos Astronautas, 1758, São José dos Campos, SP, 12227-010, Brazil<br />
c Vrije Universiteit Amsterdam, De Boelelaan 1105, 1081 HV Amsterdam, The Netherlands<br />
ARTICLE INFO<br />
Article history:<br />
Received 29 May 2007<br />
Received in revised form 24 March 2008<br />
Accepted 29 March 2008<br />
Available online xxxx<br />
1. Introduction<br />
ABSTRACT<br />
Tropical <strong>terrain</strong> covered by rainforest presents rich mosaics of very<br />
distinctive environments, often hidden from remote view. The<br />
overwhelming challenge of describing 5.5 million km 2 of such<br />
environments and associated dense, tall and closed-canopy vegetation<br />
in Amazonia has made its complete inventory a seemingly impracticable<br />
task. Passive optical remote sensing imagery (such as Landsat and<br />
CBERS) can reveal spectral properties of forest canopy with detail (e.g.<br />
Wulder, 1998), but rarely allows for finding accurate correspondence<br />
of canopy features with soils and local hydrology. In Amazonia even<br />
seasonally flooded tropical forests could not be easily spotted and<br />
distinguished from non-floodable terra-firme forests <strong>using</strong> this type of<br />
data (Novo et al., 1997). The usually flat optical imagery can hint at<br />
relief through either bright or shadow reflection artifacts on the slope<br />
pixels of steeper areas, or where spectral signatures of the vegetation<br />
are distinctive because of local environmental effects (Guyot et al.,<br />
1989; Novo et al., 1997; Nobre et al., 1998), but without stereo images<br />
it lacks the ability to describe relief quantitatively. Optical stereo<br />
⁎ Corresponding author. Tel.: +55 12 39456521; fax: +55 12 39456468.<br />
E-mail address: camilo@dpi.inpe.br (C.D. Rennó).<br />
0034-4257/$ – see front matter © 2008 Elsevier Inc. All rights reserved.<br />
doi:10.1016/j.rse.2008.03.018<br />
ARTICLE IN PRESS<br />
Remote Sensing of Environment xxx (2008) xxx-xxx<br />
Contents lists available at ScienceDirect<br />
Remote Sensing of Environment<br />
journal homepage: www.elsevier.com/locate/rse<br />
Optical imagery can reveal spectral properties of forest canopy, which rarely allows for finding accurate<br />
correspondence of canopy features with soils and hydrology. In Amazonia non-floodable swampy forests can<br />
not be easily distinguished from non-floodable terra-firme forests <strong>using</strong> just bidimensional spectral data.<br />
Accurate topographic data are required for the understanding of land surface processes at finer scales.<br />
Topographic detail has now become available with the Shuttle Radar Topographic Mission (<strong>SRTM</strong>) data. This<br />
<strong>new</strong> digital elevation model (<strong>DEM</strong>) shows the feature-rich relief of lowland rain forests, adding to the ability<br />
to map rain forest environments through many quantitative <strong>terrain</strong> <strong>descriptor</strong>s. In this paper we report on<br />
the development of a <strong>new</strong> quantitative topographic algorithm, called <strong>HAND</strong> (Height Above the Nearest<br />
Drainage), based on <strong>SRTM</strong>-<strong>DEM</strong> data. We tested the <strong>HAND</strong> <strong>descriptor</strong> for a groundwater, topographic and<br />
vegetation dataset from central Amazonia. The application of the <strong>HAND</strong> <strong>descriptor</strong> in <strong>terrain</strong> classification<br />
revealed strong correlation between soil water conditions, like classes of water table depth, and topography.<br />
This correlation obeys the physical principle of soil draining potential, or relative vertical distance to<br />
drainage, which can be detected remotely through the topography of the vegetation canopy found in the<br />
<strong>SRTM</strong>-<strong>DEM</strong> data.<br />
© 2008 Elsevier Inc. All rights reserved.<br />
images (e.g. obtained from ASTER or SPOT) can be used to produce<br />
digital elevation models (<strong>DEM</strong>). However, the cost and difficulty of<br />
obtaining cloud-free coverage for many areas of the world, compounded<br />
with the requirement of sun angles below 25° (from Nadir)<br />
to avoid long shadows (Jacobsen, 2003), has limited the possibilities<br />
for producing <strong>DEM</strong>s of large, continuous areas (Hirano et al., 2003). In<br />
addition, because ground truth accessibility to large areas is limited,<br />
many aspects of landscape complexity in those vast tropical surfaces<br />
remain shrouded in mystery.<br />
However, some of these drawbacks are quickly being overcome<br />
with imagery from active space borne sensors, such as synthetic<br />
aperture radars (SAR). Canopy penetrating L-Band SAR imagery from<br />
the Japanese Earth Resources Satellite (Siqueira et al., 2000) revealed<br />
with unprecedented detail patches of flooded vegetation (Barbosa<br />
et al., 2000; Melack and Hess, 2004). Careful mapping of such<br />
previously hidden seasonally flooded biomes has suggested their<br />
occurrence over a far wider area than formerly believed (Siqueira<br />
et al., 2003; Hess et al., 2003). Accurate topographic data are required<br />
for the understanding of land surface processes at finer scales.<br />
Topographic detail has now become available on a global scale<br />
through the C-Band SAR imagery (van Zyl, 2001) of the Shuttle Radar<br />
Topographic Mission (<strong>SRTM</strong>). The spaceborne <strong>SRTM</strong> circled the globe<br />
over a wide swath covering all the tropics and more, generating radar<br />
Please cite this article as: Rennó, C. D., et al., <strong>HAND</strong>, a <strong>new</strong> <strong>terrain</strong> <strong>descriptor</strong> <strong>using</strong> <strong>SRTM</strong>-<strong>DEM</strong>: Mapping terra-firme rainforest environments<br />
in Amazonia, Remote Sensing of Environment (2008), doi:10.1016/j.rse.2008.03.018
data that allowed for the digital reconstruction of the surface relief,<br />
producing the <strong>DEM</strong>. The <strong>SRTM</strong>-<strong>DEM</strong> data, with a horizontal resolution<br />
of 3” (~90 m near the equator) and a vertical resolution of 1 m,<br />
constitutes the finest resolution and most accurate topographic data<br />
available for most of the globe. Detailed information on the accuracy<br />
and performance of <strong>SRTM</strong> can be found in Rodriguez et al. (2006). In<br />
contrast to the passive optical imagery, this <strong>new</strong> <strong>DEM</strong> shows the<br />
feature-rich relief of lowland rain forests, adding to the ability to<br />
identify and map rain forest environments through many quantitative<br />
<strong>terrain</strong> <strong>descriptor</strong>s.<br />
A range of topographic algorithms are available, which allow<br />
various quantitative relief features to be obtained from the <strong>DEM</strong>. Slope<br />
and aspect (e.g. Jenson and Domingue, 1988), and drainage network<br />
and catchment area (e.g. Curkendall et al., 2003) are a few classical<br />
<strong>descriptor</strong>s. A range of hydrological parameters such as superficial<br />
runoff trajectories, accumulated contributing area and groundwater<br />
related variables (e.g. Tarboton, 2003) add to the suite of relief<br />
<strong>descriptor</strong>s. Relief shape parameters such as curvatures and form<br />
factors can also be calculated (Valeriano et al., 2006). The third<br />
dimension in a <strong>DEM</strong>, height, is obviously the key parameter, used to<br />
some degree in the derivation of all of the previously mentioned<br />
<strong>descriptor</strong>s. Absolute height (above sea level — ASL) can be used on its<br />
own as a relief <strong>descriptor</strong>, as large scale geomorphologic features tend<br />
to be associated with altitude relevant geological control (Goudie,<br />
2004). Upon flooding a given catchment for hydro dam development,<br />
for example, the height ASL is the <strong>descriptor</strong> that will predict the reach<br />
of the impoundment. However, when local environments in the fine<br />
scale relief are considered, height ASL has little, if any, descriptive<br />
power. As a result, local scale environments, although of conspicuous<br />
importance and clearly defined by characteristic <strong>terrain</strong> topography<br />
that is clearly visible on the <strong>SRTM</strong>-<strong>DEM</strong>, have not so far had a good<br />
<strong>descriptor</strong>.<br />
In this paper we present the development of a <strong>new</strong> quantitative<br />
topographic algorithm based on <strong>SRTM</strong>-<strong>DEM</strong> data. We crafted and<br />
tested the <strong>terrain</strong> <strong>descriptor</strong>, applying it for a groundwater, topographic<br />
and vegetation dataset from central Amazonia, <strong>using</strong> ground<br />
calibrated <strong>terrain</strong> classes for mapping the study area.<br />
2. Algorithm development<br />
2.1. Conditioning procedures<br />
The <strong>new</strong> <strong>descriptor</strong> algorithm requires a hydrologically coherent<br />
<strong>DEM</strong> as input, with resolved depressions (sinks), computed flow<br />
directions for each grid point and a defined drainage network. The<br />
procedures to develop these are presented below.<br />
2.1.1. Fixing <strong>DEM</strong> topology and computing flow directions<br />
Topography is a hydrologic driver since it defines the direction and<br />
speed of flows. Flow directions define hydrological relations between<br />
different points within a basin. Topological continuity for the flow<br />
directions is therefore necessary for a functional drainage to exist.<br />
Hydrological connections by flow direction between two points on a<br />
surface are not the same as those based on Euclidian distances. As seen<br />
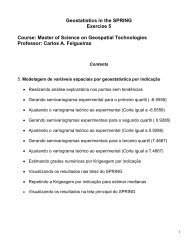
in Fig. 1, point A is spatially closer to C, but it is hydrologically connected<br />
to point B because superficial water (runoff) will flow towards the latter.<br />
The flow directions can be represented <strong>using</strong> different approaches<br />
(Zhou and Liu, 2002). For a <strong>DEM</strong> represented by a grid, the simplest<br />
and most widely used method for determining flow directions is<br />
designated D8 (eight flow directions) initially proposed by O'Callaghan<br />
and Mark (1984). In this method, the flow from each grid point is<br />
assigned to one of its eight neighbors, towards the steepest downward<br />
slope. The result is a grid called LDD (Local Drain Directions), whose<br />
values clearly represent the link to the downhill neighbor. A pit is<br />
defined as a point none of whose neighbors has a lower elevation. For<br />
a pit, the flow direction is undefined.<br />
ARTICLE IN PRESS<br />
2 C.D. Rennó et al. / Remote Sensing of Environment xxx (2008) xxx-xxx<br />
Defining G as a set of pairs of Cartesian coordinates of a grid with c<br />
columns and r rows,<br />
G ¼ fhi; jiji ¼ ½1; cŠoN;<br />
j ¼ ½1; rŠoNg;<br />
ð1Þ<br />
we can represent LDD as a function that associates to each grid point<br />
hi,ji the flow direction LDD(hi,ji) which can assume a value according<br />
to its orientation: N, NE, E, SE, S, SW, W, NW or null. The null value is<br />
assigned to all points with undefined flow direction (pits).<br />
The real hydrological meaning of the LDD depends on the quality of<br />
the <strong>DEM</strong>. The C Band interacts strongly with the vegetation with the<br />
result that the actual topography represented in the <strong>SRTM</strong> data is<br />
roughly that of the upper canopy (Valeriano et al., 2006). Therefore,<br />
for areas where the soil surface is covered by dense or tall vegetation it<br />
must be expected that a variable degree of relief masking occurs in the<br />
<strong>SRTM</strong> data (Kellndorfer et al., 2004), producing pits and extensive<br />
unresolved flat areas. Some of these features can be real properties of<br />
the relief, but often they represent artifacts in the data. <strong>SRTM</strong> data,<br />
perhaps because of radar speckle (noise) or vegetation effects, have<br />
more spurious points than other <strong>DEM</strong>s (Curkendall et al., 2003).<br />
Besides, forests have characteristic sylvigenetic dynamics with a<br />
relatively high occurrence of tree gaps (Oldeman, 1990), which will<br />
appear in the <strong>SRTM</strong>-<strong>DEM</strong> as depressions. Such depressions, if they<br />
occur on a stream, for example, create false interruptions in the<br />
topological continuity of that drainage (apparent impounding).<br />
Another particular feature of <strong>SRTM</strong> data is related to abrupt<br />
transitions of vegetation types or land uses where vegetation is<br />
suddenly absent, revealing the soil surface in a patchy manner.<br />
According to Lindsay and Creed (2005), the depression artifacts<br />
arising from underestimation of elevation should be filled and the<br />
features caused by elevation overestimation should be corrected by<br />
breaching. In general, filling methods involve raising the inner area of<br />
a depression to the elevation of its outlet point, defined as a point<br />
through which water could leave the depression. The outlet is usually<br />
Fig. 1. Hydrological connection between points A and B. Red line indicates the profile<br />
shown above, blue lines represent the drainage network and the arrows indicate flow<br />
direction. B and C are points on streams. (For interpretation of the references to colour<br />
in this figure legend, the reader is referred to the web version of this article.)<br />
Please cite this article as: Rennó, C. D., et al., <strong>HAND</strong>, a <strong>new</strong> <strong>terrain</strong> <strong>descriptor</strong> <strong>using</strong> <strong>SRTM</strong>-<strong>DEM</strong>: Mapping terra-firme rainforest environments<br />
in Amazonia, Remote Sensing of Environment (2008), doi:10.1016/j.rse.2008.03.018
defined as the lowest point along the border of the depression basin.<br />
On the other hand, breaching methods create an artificial channel<br />
lowering some points across a divide in order to connect two neighboring<br />
depressions.<br />
In this work, both sink and flat areas were eliminated by <strong>using</strong> a<br />
process similar to depression breaching suggested by O'Callaghan and<br />
Mark (1984), Band (1986) and Jenson and Domingue (1988). Although<br />
depression breaching can create strong anomalies at the edge of the<br />
artificial drainage channels, it produces the least amount of change on<br />
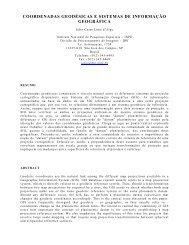
most of the remaining points of the <strong>DEM</strong>. Fig. 2 exemplifies the<br />
approach used in the <strong>DEM</strong> fixing process. The first step is to delimit<br />
the sink area (or closed basin) to be corrected based on the LDD<br />
obtained from the original <strong>DEM</strong>. Note that there are two sink areas in<br />
this example (52 and 50 elevation, the pits in darker hues). Next, the<br />
outlets of these sinks, generally falling on a saddle in the relief, are<br />
ARTICLE IN PRESS<br />
C.D. Rennó et al. / Remote Sensing of Environment xxx (2008) xxx-xxx<br />
identified (here, 55 for the first pit). This outlet point will be the<br />
neighbor of the lowest point along the limits of the adjacent sink area<br />
(54). A topological trajectory passing through the outlet and<br />
connecting the two pits is then generated. Taking into account the<br />
distance between the two extremities, the <strong>new</strong> elevation of every<br />
point along this trajectory for cutting the hill or breaching is calculated<br />
by a linear interpolation. The result is a <strong>new</strong> functional flow path that<br />
eliminates one sink. Finally, a coherent <strong>new</strong> LDD is obtained based on<br />
this corrected <strong>DEM</strong>.<br />
2.1.2. Computing drainage network<br />
Many methods of automatic extraction of drainage networks from<br />
<strong>DEM</strong>s have been developed. Soille et al. (2003) grouped the drainage<br />
extraction algorithms into two classes, the first based on morphological<br />
features and the second on hydrological <strong>terrain</strong> characteristics.<br />
Fig. 2. <strong>DEM</strong> fixing process. Red arrows indicate flow directions changed during correction. (For interpretation of the references to colour in this figure legend, the reader is referred to<br />
the web version of this article.)<br />
Please cite this article as: Rennó, C. D., et al., <strong>HAND</strong>, a <strong>new</strong> <strong>terrain</strong> <strong>descriptor</strong> <strong>using</strong> <strong>SRTM</strong>-<strong>DEM</strong>: Mapping terra-firme rainforest environments<br />
in Amazonia, Remote Sensing of Environment (2008), doi:10.1016/j.rse.2008.03.018<br />
3
Table 1<br />
Δ Function definition<br />
Flow direction Δ (Flow direction)<br />
N h0,−1i<br />
NE h1,−1i<br />
E h1,0i<br />
SE h1,1i<br />
S h0,1i<br />
SW h−1,1i<br />
W h−1,0i<br />
NW h−1,−1i<br />
Null h0,0i<br />
Montgomery and Dietrich (1988) discussed the criteria to predict the<br />
point where channels should begin (headwater). One of the first<br />
procedures for delineating drainage networks (O'Callaghan and Mark,<br />
1984) used a minimum contributing area threshold to identify<br />
channel beginning. The drainage network is thus defined by those<br />
grid points that have a contributing area greater than a given<br />
threshold. The contributing area is computed by counting the number<br />
of points whose flow paths converge to the considered point.<br />
Considering a given point h i,j i, we can determine its neighborhood<br />
as<br />
Nðhi; jiÞ<br />
¼ fhk; liaGjk ¼ fi1; i; i 1g;<br />
l ¼ fj1; j; j þ 1g;<br />
hk; liphi; jig<br />
ð2Þ<br />
The points in N(hi,ji) are called the neighbors of h i,j i.Ifpointh i,j i is<br />
not on the border grid (i≠1, i≠c, j≠1 andj≠r), then it has 8 neighbors,<br />
that is<br />
Nðhi; jiÞ<br />
¼ fhi1; j 1i; hi 1; ji; hi 1; j þ 1i; hi; j 1i; hi; j þ 1i;<br />
hi þ 1; j 1i; hi þ 1; ji; hi þ 1; j þ 1ig<br />
otherwise, it will have less than 8 neighbors.<br />
Based on the D8 method, the point hi,ji can be hydrologically<br />
connected to only one of its neighbors. If F(hi,ji) is the point to which hi,ji<br />
flows, it can be defined as:<br />
Fðhi; jiÞ<br />
¼hi; jiþDðLDDðhi; jiÞÞ<br />
ð4Þ<br />
where Δ is a function that represents the relative position hΔi,Δji<br />
between two hydrologically connected points. Table 1 shows the<br />
correspondence between the flow directions and the relative positions.<br />
Note that if point hi, ji is a pit, then F(hi, ji)=hi, ji.<br />
The contributing area of point hi, ji, defined as A(hi,ji), is computed<br />
through an iterative process.<br />
Let A t (hi, ji) be the contributing area of the point hi, ji in the t th<br />
iteration. In the first iteration (t=1)<br />
A 1 ðhi; jiÞ<br />
¼<br />
1 ifhi; jigFðGÞ 0 otherwise<br />
where F(G) represents the set of all upward points connected to any<br />
given point, that is<br />
FG ð Þ ¼ fhk; liaGjahi; jiaNðhk; liÞjFðhi;<br />
jiÞ<br />
¼ hk; lig:<br />
ð6Þ<br />
In this first iteration, the contributing area of all points that initiate<br />
a flow path is equal to one.<br />
For the other iterations (tN1)<br />
A t A<br />
ðhi; jiÞ<br />
¼<br />
t 1ðhi; jiÞ<br />
if At 1ðhi; jiÞp0<br />
1 þ P<br />
F−1ðhi;jiÞAt 1ðhk; liÞ<br />
if 0gAt 1 F 1 8<br />
<<br />
ðhi; jiÞ<br />
:<br />
0 otherwise<br />
ARTICLE IN PRESS<br />
4 C.D. Rennó et al. / Remote Sensing of Environment xxx (2008) xxx-xxx<br />
ð3Þ<br />
ð5Þ<br />
ð7Þ<br />
where F − 1 (hi, ji) represents a set of all neighbors of point hi,ji that flow<br />
to it, that is<br />
F 1 ðhi; jiÞ<br />
¼ fhk; liaNðhi; jiÞjFðhk;<br />
liÞ<br />
¼ hi; jig<br />
ð8Þ<br />
The iteration process stops (t=n) when, for any point hi,ji, A t −1 (hi,ji)≠0,<br />
that is, A(hi,ji)=A n (hi,ji).<br />
The method based on the contributing area is very easy to<br />
implement and therefore widely used. Tarboton (2003) pointed out<br />
that a significant question with this method is the choice of<br />
contributing area threshold. The basic hypothesis is that channel<br />
heads, where there is a transition from convex to concave profiles, is<br />
also where concentrated fluxes begins to dominate over diffusive<br />
fluxes (Tarboton et al., 1991, 1992). Some authors have called for<br />
objective criteria to define channel heads, such as the relationship<br />
between slope and contributing area (Tarboton et al., 1991). Others use<br />
local curvatures to account for spatially variable drainage densities<br />
(Tarboton and Ames, 2001). Montgomery and Foufoula-Georgiou<br />
(1993) compared the constant contributing area with the slopedependent<br />
contributing area. Although these approaches represent<br />
progress towards the automatic determination of channel heads, the<br />
tests we conducted for Central Amazonia showed that the application<br />
of these methodologies to <strong>SRTM</strong> data did not estimate drainage<br />
density properly. We suspect that vegetation masking ground<br />
topography may be the explanation. For this reason, we decided to<br />
use the contributing area threshold as one of the main criteria to<br />
define the drainage network, validating channel heads with field data.<br />
To define the channel heads we used an additional criteria based on<br />
simplifications of horizontal and vertical geomorphic curvatures.<br />
Firstly, the channel head element should represent a convergent point,<br />
meaning it should have two or more overland flux paths converging to<br />
it (horizontal curvature). Secondly, the channel profile should be<br />
concave, i.e. where the channel head profile point has a smaller<br />
change of elevation than the mean of the elements located uphill and<br />
downhill of it (vertical curvature).<br />
2.2. The height above the nearest drainage <strong>terrain</strong> <strong>descriptor</strong><br />
To quantify relevant parameters that could uniquely identify generalizable<br />
spatial properties of hill slopes there was the need to have a local<br />
frame of variable topographic reference that should be more useful than<br />
the all encompassing and generic height ASL, or the third dimension in<br />
the <strong>DEM</strong>. Horizontal distances of <strong>DEM</strong> grid points to connected drainage<br />
channels (slope length) have been computed by a number of approaches<br />
(e.g. Tucker et al., 2001). As the initial interest in this study was to predict<br />
potential hydrological properties for each <strong>DEM</strong> grid point, especially the<br />
depth to the permanently saturated zone, this approach wasn't useful.<br />
The gravitational potential energy difference between any given grid<br />
point and the other extremity of the hill slope flow path, at the functional<br />
stream outlet (explicit in the LDD), defines a unique and permanent<br />
property of that grid point that we call draining potential. The vertical<br />
distance of a given grid point to its drainage outlet (which is<br />
hydrologically important) can in most cases be expressed as a relative<br />
height, or the height difference between those points. Thus there will be<br />
no gravitationally driven water movement between two hydrologically<br />
connected points that share the same height. Classifying all grid points<br />
according to their respective draining potentials allows them to be<br />
grouped into classes of equipotential (equivalent draining gravitational<br />
potential), defining environments or zones with inferred similar<br />
hydrological properties. The linking of every grid point to its outlet on<br />
the drainage system allows for the whole <strong>DEM</strong> to be normalized for the<br />
drainage network (adjusting point heights in relation to the drainage),<br />
which in this way becomes a distributed frame of topographic reference.<br />
If D is a set of drainage network points, identified by a number<br />
through a bijective function in order that each point of the drainage<br />
Please cite this article as: Rennó, C. D., et al., <strong>HAND</strong>, a <strong>new</strong> <strong>terrain</strong> <strong>descriptor</strong> <strong>using</strong> <strong>SRTM</strong>-<strong>DEM</strong>: Mapping terra-firme rainforest environments<br />
in Amazonia, Remote Sensing of Environment (2008), doi:10.1016/j.rse.2008.03.018
network be identified by a unique identification number k a N⁎. We<br />
define that<br />
Dðhi; jiÞ<br />
¼<br />
k if hi; ji is a drainage network point<br />
0 otherwise<br />
and its inverse function as<br />
D 1 ðÞ¼ k fhi; jiaGjDðhi; jiÞ<br />
¼ kg:<br />
ð10Þ<br />
Following respective flow paths, each and every point in the grid is<br />
necessarily connected to a drainage point. Let I(hi,ji) be the function<br />
that identifies the drainage point connected to the point hi,ji. This<br />
function is computed through an iterative process and the result is a<br />
grid that associates the identification number of the drainage point<br />
that each point is connected to. If I t (hi,ji) is the drainage identification<br />
number of the point hi, ji in the t th iteration. In the first iteration (t=1),<br />
I 1 ðhi; jiÞ<br />
¼ Dðhi; jiÞ:<br />
ð11Þ<br />
For the other iterations (tN1)<br />
I t I<br />
ðhi; jiÞ<br />
¼<br />
t 1ðhi; jiÞ<br />
if It 1ðhi; jiÞp0<br />
It 1ðFðhi; jiÞÞ<br />
if It 1 8<br />
<<br />
:<br />
0<br />
ðFðhi; jiÞÞp0<br />
otherwise:<br />
ð9Þ<br />
ð12Þ<br />
The iteration process stops (t=m) when, for any point hi,ji, I t (hi,ji)≠0,<br />
that is,<br />
Iðhi; jiÞ<br />
¼ I m ðhi; jiÞ:<br />
ð13Þ<br />
Assuming that all points belong to a flow path and that all flow<br />
paths are associated to respective drainage points, we define the<br />
<strong>HAND</strong> value of any given point hi, ji as<br />
<strong>HAND</strong>ðhi; jiÞ<br />
¼<br />
H hi; ji ð Þ HDðhi; jiÞ<br />
if HDðhi; jiÞbHðhi;<br />
jiÞ<br />
0 otherwise<br />
ARTICLE IN PRESS<br />
C.D. Rennó et al. / Remote Sensing of Environment xxx (2008) xxx-xxx<br />
Fig. 3. Procedure to calculate the <strong>HAND</strong> grid. BBBBlue squares represent grid points belonging to the drainage network. Only black arrows are considered as flow paths.<br />
ð14Þ<br />
where H(hi,ji) represents the height of the point hi, ji given by the<br />
original <strong>DEM</strong> and H D(hi, ji) is the height of drainage point hydrologically<br />
connected to point hi,ji following the flow path, that is,<br />
HDðhi; jiÞ<br />
¼ HD 1 ðIðhi; jiÞÞ<br />
: ð15Þ<br />
It is important to note that if the point i,j is a point belonging to<br />
the drainage, then<br />
Iðhi; jiÞ<br />
¼ Dðhi; jiÞ<br />
ð16Þ<br />
D 1 ðIhi; jiÞ<br />
¼ hi; ji ð17Þ<br />
HDðhi; jiÞ<br />
¼ Hðhi; jiÞ<br />
ð18Þ<br />
and so<br />
<strong>HAND</strong>ðhi; jiÞ<br />
¼ Hðhi; jiÞ<br />
Hðhi; jiÞ<br />
¼ 0: ð19Þ<br />
In other words, all grid points belonging to the drainage network<br />
are zeroed in height, which implies that the draining potential<br />
(according with the <strong>HAND</strong> definition) along the stream channel is<br />
disregarded. Although the drainage channel is also a flow path, which<br />
effectively drains, the <strong>HAND</strong> <strong>descriptor</strong> uses the whole channel as a<br />
flat relative topographic reference, the end of all non channel flow<br />
paths. By definition, the <strong>HAND</strong> drainage outlet grid point is the nearest<br />
draining point to itself, therefore it can only be subtracted from itself.<br />
It is important to note that the breaching process, required to reach a<br />
topologically sound and accurate drainage network, introduces occasional<br />
canyon like artifacts into the <strong>DEM</strong>, as a result of aberrant height<br />
differences adjacent to the drainage network. These artifacts would be<br />
transferred to the <strong>HAND</strong> grid if it were computed from the corrected<br />
<strong>DEM</strong>. When <strong>using</strong> original <strong>SRTM</strong> data for the <strong>HAND</strong> grid computation,<br />
some associations prescribed by the corrected drainage connection grid<br />
result in small negative differences that could be interpreted as points<br />
Please cite this article as: Rennó, C. D., et al., <strong>HAND</strong>, a <strong>new</strong> <strong>terrain</strong> <strong>descriptor</strong> <strong>using</strong> <strong>SRTM</strong>-<strong>DEM</strong>: Mapping terra-firme rainforest environments<br />
in Amazonia, Remote Sensing of Environment (2008), doi:10.1016/j.rse.2008.03.018<br />
5
elow their associated drainage points (impoundment). Considering the<br />
1 m elevation accuracy of the <strong>SRTM</strong> and the disturbances caused by the<br />
forest canopy, these small negative differences fell within the noise in the<br />
data, and were zeroed. Therefore, in the <strong>HAND</strong> algorithm we combined<br />
the more meaningful need to reach a topologically coherent LDD<br />
(requiring the topological correction of the <strong>DEM</strong>, leading to an accurate<br />
drainage network), with the use of the original non-corrected <strong>DEM</strong><br />
(which has dispersed sinks) for the computation of the final <strong>HAND</strong> grid,<br />
thus avoiding the canyon aberrations associated with the corrected <strong>DEM</strong>.<br />
Fig. 3 shows an example of the <strong>HAND</strong> procedure. Based on a LDD<br />
grid, overlaid with the computed drainage network, all flow paths are<br />
coded according to the nearest associated drainage point. The marked<br />
point with height 72 in the <strong>DEM</strong> is connected to the drainage point with<br />
height 53 (both coded 2), resulting in a <strong>HAND</strong> of 19. This means that the<br />
marked grid point is 19 m above its corresponding drainage point. Fig. 4<br />
summarizes all operations involved in obtaining the <strong>HAND</strong> grid.<br />
3. Application<br />
3.1. Study area<br />
Data from a 37 km square study area located in the Cuieiras Biological<br />
Reservation (central Amazonia NW of Manaus, Fig. 6), was used to test<br />
ARTICLE IN PRESS<br />
6 C.D. Rennó et al. / Remote Sensing of Environment xxx (2008) xxx-xxx<br />
Fig. 4. Processing steps for the height above the nearest drainage <strong>descriptor</strong>.<br />
the <strong>new</strong> <strong>HAND</strong> <strong>terrain</strong> <strong>descriptor</strong>. The area, representative of large areas<br />
in Amazonia and including the K34 LBA fluxtower site (Araujo et al.,<br />
2002) and the Asu hydrological catchment (Waterloo et al., 2006;<br />
Tomasella et al., 2007; Cuartas et al., 2007), is covered by pristine, terrafirme<br />
(<strong>terrain</strong> not subject to flooding by the annual flood cycle of the<br />
Amazon and its major tributaries) rain forest vegetation, with the<br />
canopy height varying from 20 m to 35 m. Forest biomass in the<br />
vicinities is highly heterogeneous and has been reported ranging from<br />
215 to 492 ton/ha (Laurance et al., 1999; Castilho, 2004). Details about<br />
the wet equatorial seasonal climate (annual rainfall larger than<br />
2000 mm) can be found in Araujo et al. (2002) and Cuartas et al.<br />
(2007). The landscape in and around the Asu catchment (Fig. 5), is<br />
composed mostly of flat plateaus (90–105 m ASL) incised by a dense<br />
drainage network within broad swampy valleys (45–55 m ASL).<br />
Ground truth data were collected in various field campaigns. A total<br />
of 120 points were visited in the Asu catchment for testing the <strong>HAND</strong><br />
application. These points fell along a hydrological transect (site C1),<br />
across two 1st order sub catchments, and along two 2.5 km-long N–S<br />
and E–W orthogonal transects, crossing the catchment edge-to-edge.<br />
Field positions of streams and stream heads were also logged for<br />
verification of the calculated drainage network. Points beneath the<br />
forest canopy were located in the field <strong>using</strong> accurate geo positioning<br />
(obtained with a 30 m horizontal accuracy) in conjunction with<br />
Please cite this article as: Rennó, C. D., et al., <strong>HAND</strong>, a <strong>new</strong> <strong>terrain</strong> <strong>descriptor</strong> <strong>using</strong> <strong>SRTM</strong>-<strong>DEM</strong>: Mapping terra-firme rainforest environments<br />
in Amazonia, Remote Sensing of Environment (2008), doi:10.1016/j.rse.2008.03.018
vegetation and soil pattern evaluation, aided by subsurface water table<br />
depth data (multiyear time series, logged by an irregular sampling<br />
network of 27 piezometers installed in valleys, major stream heads, and<br />
along a hillslope hydrological transect). Hydrological details about the<br />
Asu instrumented catchment can be found in Tomasella et al. (2007).<br />
Non-floodable local environments were clearly identified in the field<br />
through topography, vegetation, soils and hydrological cues.<br />
3.2. Results<br />
The <strong>SRTM</strong> data for the study area were corrected in order do<br />
produce the hydrologically coherent LDD. Using this corrected LDD,<br />
the contributing area grid was computed and with it the drainage<br />
network was derived, <strong>using</strong> a selected contributing area threshold.<br />
The <strong>HAND</strong> grid was then obtained <strong>using</strong> this drainage as reference.<br />
The results of these steps are presented below.<br />
3.2.1. Drainage network sensitivity<br />
Drainage density is an important parameter for the accuracy of the<br />
<strong>HAND</strong> <strong>descriptor</strong>. Fig. 6 shows networks extracted from the <strong>SRTM</strong> data<br />
<strong>using</strong> three different contributing area thresholds. For the <strong>HAND</strong><br />
ARTICLE IN PRESS<br />
C.D. Rennó et al. / Remote Sensing of Environment xxx (2008) xxx-xxx<br />
Fig. 5. Study area NW of Manaus. (a) Landsat TM 5,4,3 (RGB) 2001, (b) <strong>SRTM</strong>-<strong>DEM</strong>, showing rich details in the forest topography. Flood lands in the <strong>SRTM</strong>-<strong>DEM</strong>, identified <strong>using</strong> JERS-1<br />
data (Melack and Hess, 2004), were removed from the analysis of this study (masked in black).<br />
<strong>descriptor</strong>, the contributing area is the tunable parameter. Note that<br />
the lower the threshold, the higher the density of the resulting drainage<br />
network. Automatic extraction of the drainage network from a <strong>DEM</strong> still<br />
lacks competence to represent channel heads realistically and with<br />
robustness, which requires field verification for an appropriated<br />
representation of drainage density. The ground truth for channel heads<br />
carried out in this study indicated that the contributing area threshold of<br />
50 grid points produces the most accurate drainage network density.<br />
From an exploratory analysis of the relationship between drainage<br />
density and contributing area threshold, we found that varying thresholds<br />
within the range of 47 through 92 did not change channel hierarchy<br />
at a verification point in a 3rd order stream. Smaller or larger thresholds<br />
produced higher or lower orders respectively. Fig. 7 shows the impact of<br />
these three contributing area thresholds (47, 50 and 92), plus two chosen<br />
extreme points (5 and 500) on the <strong>HAND</strong> grid distribution of heights.<br />
The skewness in the <strong>HAND</strong> distribution of heights is directly proportional<br />
to the smoothness of the <strong>HAND</strong> grid. Higher frequencies of the<br />
small <strong>HAND</strong> values, for example, result in a smoother topography of the<br />
<strong>HAND</strong> grid, which implies a lower ability to distinguish and resolve<br />
contrasting local environments. If the calculated drainage network<br />
remains within the range that realistically captures the order hierarchy<br />
Fig 6. Contributing area (left) and drainage networks plotted on <strong>SRTM</strong> image, with varying contributing area thresholds (in number of grid points).<br />
Please cite this article as: Rennó, C. D., et al., <strong>HAND</strong>, a <strong>new</strong> <strong>terrain</strong> <strong>descriptor</strong> <strong>using</strong> <strong>SRTM</strong>-<strong>DEM</strong>: Mapping terra-firme rainforest environments<br />
in Amazonia, Remote Sensing of Environment (2008), doi:10.1016/j.rse.2008.03.018<br />
7
of the drainage network, then the effect of slightly varying channel<br />
heads on the <strong>HAND</strong> grid (and therefore on other estimations based on<br />
it), will not be significantly great. In a forthcoming paper we report this<br />
to be a robust result, verified for a wider area around the Asu catchment.<br />
But for other areas with distinct geomorphologies this finding still needs<br />
verification.<br />
ARTICLE IN PRESS<br />
8 C.D. Rennó et al. / Remote Sensing of Environment xxx (2008) xxx-xxx<br />
Fig. 7. Sensitivity of the <strong>HAND</strong> grids based on different drainages with varying contributing areas.<br />
Fig. 8. <strong>HAND</strong> grid <strong>DEM</strong> (<strong>using</strong> 50 grid points threshold for drainage contributing area).<br />
3.2.2. The <strong>HAND</strong> grid <strong>DEM</strong><br />
Fig. 8 shows a <strong>HAND</strong> grid shaded relief of the test area. Altimetric<br />
differences along the drainage channels are no longer visible as they<br />
were in the original <strong>DEM</strong> (Fig. 5b). The capacity of the <strong>HAND</strong><br />
<strong>descriptor</strong> to make evident locally significant <strong>terrain</strong>-controlling<br />
factors is apparent.<br />
Please cite this article as: Rennó, C. D., et al., <strong>HAND</strong>, a <strong>new</strong> <strong>terrain</strong> <strong>descriptor</strong> <strong>using</strong> <strong>SRTM</strong>-<strong>DEM</strong>: Mapping terra-firme rainforest environments<br />
in Amazonia, Remote Sensing of Environment (2008), doi:10.1016/j.rse.2008.03.018
Fig. 9. Profile comparing original <strong>SRTM</strong> data and the <strong>HAND</strong> grid normalized for the<br />
drainage network.<br />
The main difference between the original <strong>SRTM</strong>-<strong>DEM</strong> and the<br />
<strong>HAND</strong> grid <strong>DEM</strong> (Fig. 9) lies in the effect of the topographic<br />
normalization for the drainage network. In fact, the <strong>HAND</strong> grid<br />
converts into absolute the relative nature of the distributed frame of<br />
topographic reference in the drainage network. Thus, although the<br />
<strong>HAND</strong> grid loses the height reference to sea level, it enhances<br />
meaningful local relative variations in height. This local relevance is<br />
especially useful because height differences now found in the <strong>HAND</strong><br />
grid have hydrological significance, and can potentially reveal<br />
previously hidden local environments.<br />
3.2.3. Mapping local environments<br />
The <strong>HAND</strong> algorithm can be applied to the <strong>SRTM</strong>-<strong>DEM</strong> of any <strong>terrain</strong>,<br />
producing <strong>HAND</strong> grid <strong>DEM</strong>s with implicit geomorphologic and hydrological<br />
meaning. However, the significance in practical applications is<br />
ARTICLE IN PRESS<br />
C.D. Rennó et al. / Remote Sensing of Environment xxx (2008) xxx-xxx<br />
Fig. 11. Box-plot of <strong>HAND</strong> for ground truth points: 36 points from the hydrological<br />
transect, 84 spread out within the Igarapé Asu catchment, with water table inferred<br />
from data of 27 piezometers.<br />
provided by finding <strong>HAND</strong> classes (ranges of heights) that match with<br />
relevant soil water and land cover characteristics. For this application,<br />
the most detailed field data was produced along the hydrological<br />
transect (Fig. 10), running orthogonally from the top of the K34<br />
fluxtower plateau to the 2nd order Asu stream (Hodnett et al., in<br />
preparation). This transect encompassed and represented all topographic<br />
features for the area, containing measurement and sampling<br />
points for soil water, vegetation, soil and topographic ground truth<br />
verification.<br />
The vertical cross-section of the hydrological transect (Fig. 10a),<br />
reveals the relation of the <strong>HAND</strong> grid profile with the surveyed ground<br />
topography and water table data. Note the convergence of the water<br />
table with the topography in the lowland, towards the stream. Note also<br />
that the <strong>HAND</strong> grid profile hovers above the ground topography by the<br />
distance of the forest vegetation height (the C-band radar data from the<br />
<strong>SRTM</strong> interacted strongly with the forest canopy). Local environments<br />
and their relative extents were defined by matching ground truth of<br />
vegetation and topography with groundwater data. These environments<br />
were easily recognized in the field by pattern observation, and were<br />
classified as waterlogged (considering only the zone where soil is<br />
perennially saturated to the surface), ecotone (shallow water table,<br />
usually covered by Campinarana – sensu, Anderson et al.,1975)orupland<br />
Fig. 10. a) Cross-section of the Igarapé Asu hydrological hillslope transect (from A to A') with <strong>HAND</strong> grid profile superimposed on ground topography and water table data. b) Overlay<br />
of ground truth points onto <strong>SRTM</strong>-based <strong>HAND</strong> grid <strong>DEM</strong> (grayscale, with top contour lines in red) along the hillslope hydrological transect (from A to A').<br />
Please cite this article as: Rennó, C. D., et al., <strong>HAND</strong>, a <strong>new</strong> <strong>terrain</strong> <strong>descriptor</strong> <strong>using</strong> <strong>SRTM</strong>-<strong>DEM</strong>: Mapping terra-firme rainforest environments<br />
in Amazonia, Remote Sensing of Environment (2008), doi:10.1016/j.rse.2008.03.018<br />
9
(deep water table). The last category was arbitrarily split into slope<br />
(upland with slope N3°) and plateau (flat upland).<br />
The overlaying of the ground truth points onto the <strong>HAND</strong> grid<br />
(Fig. 10b) suggests a coherent matching between local environments<br />
identified in the field and corroborated by groundwater data, with<br />
drainage-normalized canopy-topography represented by the <strong>HAND</strong><br />
grid. This coherence suggests that local environments can be<br />
associated with height classes in the <strong>HAND</strong> grid. An exploratory<br />
quantitative analysis matching the distribution of ground truth points<br />
in the Asu catchment with respective heights in the <strong>HAND</strong> grid (Fig.11)<br />
ARTICLE IN PRESS<br />
10 C.D. Rennó et al. / Remote Sensing of Environment xxx (2008) xxx-xxx<br />
Fig. 12. Four-class <strong>HAND</strong> map overlaid with ground truth points to site C1.<br />
Fig. 13. Four-class <strong>HAND</strong> map for entire study area.<br />
suggests a compelling separation of <strong>HAND</strong> classes, especially between<br />
waterlogged, ecotone and upland environments.<br />
Taking these into account, <strong>HAND</strong> grid values of 5 m and 15 m were<br />
selected as preliminary best-guess thresholds between the three<br />
classes. To optimize this separation (lessen errors on class inclusion)<br />
we applied the simplex algorithm (Cormen et al., 2001), finding 5.3 m<br />
and 15.0 m as the best thresholds between classes for the set of ground<br />
truth points available.<br />
The upland class, in comparison to the other two lowland classes,<br />
represented well and in a relatively homogeneous way a single soil<br />
Please cite this article as: Rennó, C. D., et al., <strong>HAND</strong>, a <strong>new</strong> <strong>terrain</strong> <strong>descriptor</strong> <strong>using</strong> <strong>SRTM</strong>-<strong>DEM</strong>: Mapping terra-firme rainforest environments<br />
in Amazonia, Remote Sensing of Environment (2008), doi:10.1016/j.rse.2008.03.018
water condition (well drained soil, deep water table). However there are<br />
many distinct substrate effects in the definition of an environment on a<br />
slope compared to one on a plateau. The waterlogged and plateau classes<br />
are quite well defined in that they share low slope angles, and are well<br />
separated from ecotone and slope. This analysis reveals that the <strong>HAND</strong><br />
height is a good separator between the three soil water relevant classes.<br />
It also shows that, in the case of the Igarapé Asu catchment — with its<br />
fairly uniform plateau heights, it can also separate the upland class into<br />
slope and plateau. However, for other catchments with plateaus at<br />
variable <strong>HAND</strong> heights, it might not score so well. Slope angle, on the<br />
other hand, can be used to identify flat surfaces independently of <strong>HAND</strong><br />
height. However the <strong>HAND</strong> height can still be useful to set aside plateaus<br />
from flat alluvial <strong>terrain</strong> in the valley bottoms. As both slope and aspect<br />
are <strong>terrain</strong> <strong>descriptor</strong>s that do not require field verification, slope will be<br />
a better separator when applied exclusively for the upland class. The<br />
upland class (<strong>HAND</strong>N15.0 m) was then split on the basis of slope, with<br />
the initial threshold value arbitrarily selected at 6.5% slope, and then<br />
optimized with the simplex algorithm to 7.6% (Fig. 12).<br />
The ground truth survey was accurate in identifying the local<br />
environment for each chosen point, and as a result, for most points, the<br />
matching between field environments with <strong>HAND</strong> predicted environments<br />
was exceptionally good. Nevertheless, unavoidable localization<br />
errors were responsible for a few mismatches, which happened only to<br />
the extreme values. Area estimation indicates that the distinctive<br />
waterlogged plus ecotone environments (valley bottoms) occupied 43%<br />
of the surface, whereas slope and plateau occupied only 26% and 31%<br />
respectively (Fig. 13). The two valley bottom classes have been widely<br />
considered as a minor proportion of the landscape and as a result have<br />
been largely disregarded by most integrative studies of terra-firme. The<br />
<strong>HAND</strong> <strong>descriptor</strong> clearly and quantitatively reveals that the valley<br />
bottom classes are very important in this landscape. The <strong>HAND</strong> class test<br />
carried out in this study might suffer from some site specific bias, but as<br />
it uses site-independent gravitational potential as the main driver for its<br />
description of <strong>terrain</strong>, we expect that it will show robustness when<br />
applied in the Amazon outside the test area, and even anywhere else<br />
with a similar <strong>terrain</strong> covered by thick forests with a relatively uniform<br />
canopy height across the landscape.<br />
4. Discussion<br />
Topography in the <strong>SRTM</strong> shaded relief image is plainly discernible to<br />
the trained eye. When the computed drainage network is plotted on the<br />
ARTICLE IN PRESS<br />
C.D. Rennó et al. / Remote Sensing of Environment xxx (2008) xxx-xxx<br />
<strong>SRTM</strong> image of a rainforest area, hidden local environments, such as<br />
riparian zones, appear to pop up out of the continuous canopy carpet.<br />
However this perception reveals an imaginary presence, which at best<br />
represents only a qualitative indication. An objective and quantitative<br />
<strong>descriptor</strong> of these hidden environments was lacking. Pure hypsometry,<br />
as that in the shaded relief, does not offer much. A given valley area at<br />
200 m ASL, for example, might have a similar environment to another<br />
valley area at 650 m ASL, the latter lying kilometers upstream.<br />
Conversely, at 200 m ASL one can find a range of different local<br />
environments. Geographic Information System (GIS) buffer zoning is a<br />
common tool used for delineating local environments, most often in<br />
association with streams and other superficial waters or distinctive<br />
landscape features. Buffer analysis to define areas of riparian influence<br />
creates a zone of predefined width around the drainage, usually based<br />
on simple Euclidean distance (Burrough and McDonnell, 1998).<br />
However, without functional variables driving the buffer zoning process,<br />
geometric distances present little topographic, pedological and hydrological<br />
meaning or consistency. The uncertainty in this local environment<br />
delineation is especially troublesome for tropical rain forests<br />
(Bren, 2000; McGlynn and Seibert, 2003). The widely variable zone of<br />
floodable forests in Amazonia (Hess et al., 2003), for example, suggests<br />
that it would be grossly misrepresented if a simple geometric GIS buffer<br />
were applied. Therefore, geometric buffering zones also fail to provide a<br />
local environment <strong>descriptor</strong>, as the spatial extents of these perceived<br />
environments are highly irregular, and do not have extractable<br />
geometries that would correlate with the drainage network or other<br />
emergent feature in any easy way. Topographic patterns associated with<br />
contrasting environments, which are very evident from within the rain<br />
forest, needed to be rendered in quantitative manner.<br />
A porous medium (soil) presents a fine and interconnected network of<br />
void spaces and channels through which water can flow, following<br />
gradients of potential energy, always seeking equilibrium in the condition<br />
of least energy. This is a fundamental hydraulic principle. Flow routes<br />
from any given point on the <strong>terrain</strong>, or hill slope flow paths (overland or<br />
groundwater in the saturated zone), will seek trajectories of least<br />
resistance and will be propelled by gradients of gravitational energy<br />
(neglecting both matric and osmotic potentials for a saturated soil or for<br />
overland flow). These hill slope flow paths will invariably end somewhere<br />
on the drainage network, with the principle of least energy requiring a<br />
discharge into the nearest stream. Therefore, for each grid point in the<br />
<strong>SRTM</strong>-<strong>DEM</strong>, there must be a unique and topologically consistent flow<br />
path connecting it with its stream outlet. These connecting flow paths<br />
Fig. 14. Comparison between the <strong>HAND</strong> (vertical distance do the nearest drainage) and horizontal distance to the nearest drainage (along water flow path) values, according to<br />
algorithm proposed by Tucker et al. (2001).<br />
Please cite this article as: Rennó, C. D., et al., <strong>HAND</strong>, a <strong>new</strong> <strong>terrain</strong> <strong>descriptor</strong> <strong>using</strong> <strong>SRTM</strong>-<strong>DEM</strong>: Mapping terra-firme rainforest environments<br />
in Amazonia, Remote Sensing of Environment (2008), doi:10.1016/j.rse.2008.03.018<br />
11
ear all topological components, extractable from the <strong>SRTM</strong>-<strong>DEM</strong>, which<br />
allowed for the development of the <strong>new</strong> <strong>HAND</strong> <strong>terrain</strong> <strong>descriptor</strong>. The<br />
results of the test of the <strong>HAND</strong> <strong>descriptor</strong> reported here demonstrate its<br />
capacity to resolve meaningfully the delineation of local environments.<br />
There are a host of generic <strong>terrain</strong> <strong>descriptor</strong>s, e.g. topographic<br />
indexes, which could be compared to the <strong>HAND</strong>, but an exhaustive<br />
comparison is beyond the aim of the present work. The closest<br />
<strong>descriptor</strong> to the vertical distance along a flow path is the non-<br />
Euclidian horizontal distance along the same flow path (Tucker et al.,<br />
2001). To test the similarity between the two <strong>descriptor</strong>s, 1000<br />
independent points (pixels) were randomly drawn from the test area<br />
<strong>SRTM</strong>-<strong>DEM</strong>. According to the linear regression, the horizontal distance<br />
can only explain 55% of the total variance that can be explained by the<br />
<strong>HAND</strong> (Fig. 14).<br />
There is an obvious relation between horizontal and vertical<br />
distances because it is expected that as one moves away from the<br />
drainage, the <strong>terrain</strong> will get higher. However, the other 45% of the<br />
variance is <strong>new</strong> information that only the <strong>HAND</strong> <strong>descriptor</strong> can give.<br />
Points with large horizontal distances but low <strong>HAND</strong> are indicative of<br />
great flat areas connected to the drainage (swampy areas). The innate<br />
swampy characteristic of these <strong>terrain</strong>s, for example, would never be<br />
seen with horizontal distances alone. With a large <strong>HAND</strong> value<br />
(vertical flow path distance) and a small horizontal flow path distance,<br />
the <strong>terrain</strong> is quickly rising away from the stream, i.e. a well etched<br />
drainage valley. But, although the <strong>HAND</strong> has this evident advantage,<br />
the horizontal flow path distance is a great advance over plain<br />
Euclidian distances, because the latter may connect and relate points<br />
on the <strong>terrain</strong> that do not belong to the same catchment. Furthermore,<br />
horizontal flow path distances to the nearest drainage might have a<br />
bearing in terms of span of time spent in draining flows, determined<br />
by hydraulic conductivity and slope along the flow path. Height above<br />
the nearest drainage correlates directly with gravitational potential,<br />
and this fact alone sets this <strong>descriptor</strong> aside as unique.<br />
5. Conclusions<br />
The height above the nearest drainage algorithm was developed on<br />
top of the local drain directions and drainage networks, two well<br />
established and basic topographic <strong>descriptor</strong>s. The <strong>HAND</strong> has added<br />
the height difference along flow paths, or draining potential, as a<br />
significant and unique <strong>terrain</strong> <strong>descriptor</strong>. The <strong>HAND</strong> <strong>terrain</strong> <strong>descriptor</strong><br />
produces a normalized digital elevation model (<strong>HAND</strong> grid) that can<br />
be applied to classify <strong>terrain</strong> in a manner that is related to local soil<br />
water conditions. The <strong>HAND</strong> grid, a <strong>DEM</strong> where all pixels have been<br />
mapped according to their draining potential, has a wide range of<br />
potential applications. The application of the <strong>HAND</strong> <strong>descriptor</strong> in<br />
classifying the <strong>terrain</strong> within a monitored hydrological catchment in<br />
Amazonia revealed strong correlations between soil water conditions,<br />
like classes of water table depth, and topography. This correlation<br />
obeys the physical principle of soil draining potential, or relative<br />
vertical distance to drainage, which can be detected remotely through<br />
the topography of the vegetation canopy found in the <strong>SRTM</strong>-<strong>DEM</strong><br />
data. To our knowledge no previous study has noticed or reported the<br />
height above the nearest drainage as likely being a good <strong>terrain</strong><br />
<strong>descriptor</strong>. It increases usability of the <strong>SRTM</strong>-<strong>DEM</strong> data and provides a<br />
<strong>new</strong> quantitative view on the steady state landscape, one that was<br />
missing in the repertoire of <strong>terrain</strong> <strong>descriptor</strong>s.<br />
Acknowledgements<br />
This work was developed within the Environmental Physics Group<br />
of GEOMA modeling network (Brazil's Ministry of Science and<br />
Technology funding), with invaluable collaboration and co-funding<br />
from the LBA project (Igarapé Asu instrumented catchment study).<br />
This work would not have been possible without full support of INPE<br />
and INPA. The Igarapé Asu catchment study was also funded by the<br />
ARTICLE IN PRESS<br />
12 C.D. Rennó et al. / Remote Sensing of Environment xxx (2008) xxx-xxx<br />
PPG7/FINEP Ecocarbon project and by CTEnerg and CThidro (Energy<br />
and Water Resources Sectorial Funds). Brazilian Science Funding<br />
Agency, CNPq and Fapeam, also contributed with grants and scholarships<br />
of personnel involved in the project. Thanks to Gerard Banon<br />
(<strong>DPI</strong>/INPE), two anonymous reviewers and the editor for their valuable<br />
comments and questions. We thank dearly Antonio Huxley for support<br />
in the field work. We thank also Evlyn Novo, Adriana Affonso and John<br />
Melack for the cession of the JERS-1 based flood land numerical mask.<br />
References<br />
Anderson, A. B., Prance, G. T., & Albuquerque, B. W. P. de (1975). Estudos sobre a vegetação<br />
das Campinas Amazônicas — III. A vegetação lenhosa da Campina da Reserva<br />
Biológica INPA-SUFRAMA (Manaus Caracaraí, Km 62). Acta Amazônica, 5(3),<br />
225−246.<br />
Araujo, A. C., Nobre, A. D., Kruijt, B., Elbers, J. A., Dallarosa, R., Stefani, P., Randow, C.,<br />
Manzi, A. O., Culf, A. D., Gash, J. H. C., Valentini, R., & Kabat, P. (2002). Comparative<br />
measurements of carbon dioxide fluxes from two nearby towers in a central<br />
Amazonian rainforest: The Manaus LBA site. Journal of Geophysical Research, 107<br />
(D20), 8090. doi:10.1029/2001JD000676.<br />
Band, L. E. (1986). Topography partition of watersheds with digital elevation models.<br />
Water Resources Research, 22(1), 15−24.<br />
Barbosa, C., Hess, L., Melack, J., & Novo, E. (2000). Mapping Amazon basin wetlands<br />
through region growing segmentation and segmented-based classification of JERS-<br />
1 Data. IX Simposio Latinoamericano de Percepción Remota, Puerto Iguazú, Argentina.<br />
Bren, L. J. (2000). A case study in the use of threshold measures of hydrologic loading in<br />
the design of stream buffer strips. Forest Ecology and Management, 132, 243−257.<br />
Burrough, P. A., & McDonnell, R. A. (1998). Principles of Geographical Information<br />
Systems. Spatial Information Systems.New York: Oxford University Press 333p.<br />
Castilho, C. (2004). Variação espacial e temporal da biomassa arbórea viva em 64 km 2 de<br />
floresta de terra-firme na Amazônia Central. 87p. Doctoral Thesis, ecology, Instituto<br />
Nacional de Pesquisa da Amazônia, Manaus-AM.<br />
Cormen, T. H., Leiserson, C. E., Rivest, R. L., & Stein, C. (2001). Introduction to algorithms,<br />
Section 29.3: The simplex algorithm (pp. 790−804)., Second Edition Cambridge: MIT<br />
Press and McGraw-Hill 0-262-03293-7.<br />
Cuartas, L. A., Tomasella, Nobre, A. D., Hodnett, M., Waterloo, M. J., & Munera, J. C. (2007).<br />
Interception water-partitioning dynamics for a pristine rainforest in Central<br />
Amazonia: Marked differences between normal and dry years. Agricultural and<br />
Forest Meteorology, 145(1–2), 69−83.<br />
Curkendall, D. W., Fielding, E. J., Cheng, T. -H., & Pohl, J. M. (2003). A computational-grid<br />
based system for continental drainage network extraction <strong>using</strong> <strong>SRTM</strong> digital<br />
elevation models. Proceedings of the HPSECA/IPCC conference, Taiwan.<br />
Goudie, A. (2004). Encyclopedia of Geomorphology.New York: Routledge publisher<br />
1250p.<br />
Guyot, G., Guyon, D., & Riom, J. (1989). Factors affecting the spectral response of forest<br />
canopies — A review. Geocarto International, 4, 3−18.<br />
Hess, L. L., Melack, J. M., Novo, E. M. L. M., Barbosa, C. C. F., & Gastil, M. (2003). Dualseason<br />
mapping of wetland inundation and vegetation for the central Amazon<br />
basin. Remote Sensing of Environment, 87, 404−428.<br />
Hodnett, M.G., Tomasella, J., Cuartas, L.A., Waterloo, & Nobre, A.D. (in preparation). Sub<br />
Surface Hydrological Flow Paths in a Ferralsol (Oxisol) landscape in Central<br />
Amazonia.<br />
Hirano, A., Welch, R., & Lang, H. (2003). Mapping from ASTER stereo image data: <strong>DEM</strong><br />
validation and accuracy assessment. Journal of Photogrammetry & Remote Sensing,<br />
57, 356−370.<br />
Jacobsen, K. (2003). <strong>DEM</strong> Generation from Satellite Data. EARSeL Symposium Ghent:<br />
Remote Sensing in Transition (pp. 273−276). 90-77017-71-2.<br />
Jenson, S. K., & Domingue, J. O. (1988). Extracting topographic structure from digital<br />
elevation data for geographic information system analysis. Photogrammetric<br />
engineering and remote sensing, 54, 1593−1600.<br />
Kellndorfer, J., Walker, W., Pierce, L., Dobson, C., Fites, J. A., Hunsaker, C., Vona, J., & Clutter,<br />
M. (2004). Vegetation height estimation from shuttle radar topography mission and<br />
national elevation datasets. Remote Sensing of Environment, 93, 339−358.<br />
Laurance, W. F., Fearnside, P. M., Laurance, S. G., Delamonica, P., Lovejoy, T. E., Rankin-de-<br />
Merona, J. M., Chambers, J. Q., & Gascon, C. (1999). Relationship between soils and<br />
Amazon forest biomass: A landscape-scale study. Forest Ecology Management, 118<br />
(1–3), 127−138.<br />
Lindsay, J. B., & Creed, I. F. (2005). Removal of artifact depressions from digital elevation<br />
models: towards a minimum impact approach. Hydrological processes, 19,<br />
3113−3126.<br />
McGlynn, B. L., & Seibert, J. (2003). Distributed assessment of contributing area and<br />
riparian buffering along stream networks. Water resources research, 39(4),<br />
TNN2.1−TNN2.7.<br />
Melack, J. M., & Hess, L. L. (2004). Remote sensing of wetlands on a global scale. SIL<br />
News, 42,1−5.<br />
Montgomery, D. R., & Dietrich, W. E. (1988). Where do channels begin? Nature, 336,<br />
232−234.<br />
Montgomery, D. R., & Foufoula-Georgiou, E. (1993). Channel network source<br />
representation <strong>using</strong> digital elevation models. Water Resources Research, 29(12),<br />
3925−3934.<br />
Nobre, A. D., Hirata, Y., Honzak, M., & Campos, A. C. (1998). Vegetation classification and<br />
mapping of Manaus region <strong>using</strong> passive remote sensing. In N. Higuchi, M. A. A.<br />
Campos, P. T. B. Sampaio, & J. Santos (Eds.), Pesquisas florestais para a conservação da<br />
Please cite this article as: Rennó, C. D., et al., <strong>HAND</strong>, a <strong>new</strong> <strong>terrain</strong> <strong>descriptor</strong> <strong>using</strong> <strong>SRTM</strong>-<strong>DEM</strong>: Mapping terra-firme rainforest environments<br />
in Amazonia, Remote Sensing of Environment (2008), doi:10.1016/j.rse.2008.03.018
floresta e reabilitação de áreas degradadas da Amazonia, Projeto Jacaranda (pp. 28−49).<br />
Manaus: MCT-INPA & Jica pub.<br />
Novo, E. M. L. M., Leite, F. A., Avila, J., Ballester, M. V., & Melack, J. M. (1997). Assessment<br />
of Amazon floodplain habitats <strong>using</strong> TM/Landsat data. Ciência e Cultura, 49(4),<br />
280−284.<br />
O'Callaghan, J. F., & Mark, D. M. (1984). The extraction of drainage networks from digital<br />
elevation data. Computer Vision, Graphics and Image Processing, 28, 323−344.<br />
Oldeman, R. A. A. (1990). Forests: Elements of Silvology.Berlin: Springer Verlag 624p.<br />
Rodriguez, E., Morris, C. S., & Belz, J. E. (2006). A global assessment of the <strong>SRTM</strong><br />
performance. Photogrammetric Engineering and Remote Sensing, 72(3), 249−260.<br />
Siqueira, P., Chapman, B., & McGarragh, G. (2003). The coregistration, calibration, and<br />
interpretation of multiseason JERS-1 SAR data over South America. Remote Sensing<br />
of the Environment, 87, 389−403.<br />
Siqueira, P., Hensley, S., Shaffer, S., Hess, L., McGarragh, G., Chapman, B., & Freeman, A.<br />
(2000). A continental-scale mosaic of the Amazon basin <strong>using</strong> JERS-1 SAR. IEEE<br />
Transactions on Geoscience and Remote Sensing, 38(6), 2638−2644.<br />
Soille, P., Vogt, J., & Colombo, R. (2003). Carving and adaptive drainage enforcement of<br />
grid digital elevation models. Water Resources Research, 39(12), 1366−1375.<br />
Tarboton, D. G. (2003). Terrain analysis <strong>using</strong> digital elevation models in hydrology.<br />
23rd ESRI International Users Conference, San Diego, California.<br />
Tarboton, D. G., & Ames, D. P. (2001). Advances in the mapping of flow networks from<br />
digital elevation data. World Water and Environmental Resources Congress, Orlando,<br />
Florida.<br />
Tarboton, D. G., Bras, R. L., & Rodriguez-Iturbe, I. (1991). On the extraction of channel<br />
networks from digital elevation data.. Hydrological processes, 5, 81−100.<br />
ARTICLE IN PRESS<br />
C.D. Rennó et al. / Remote Sensing of Environment xxx (2008) xxx-xxx<br />
Tarboton, D. G., Bras, R. L., & Rodriguez-Iturbe, I. (1992). A physical basis for drainage<br />
density. Geomorphology, 5, 59−76.<br />
Tomasella, J., Hodnett, M. G., Cuartas, L. A., Nobre, A. D., Waterloo, M. J., & Oliveira, S. M.<br />
(2007). The water balance of an Amazonian micro-catchment: The effect of interannual<br />
variability of rainfall on hydrological behavior. Published online, Hydrological<br />
Processes.<br />
Tucker, G. E., Catani, F., Rinaldo, A., & Brás, R. L. (2001). Statistical analysis of drainage<br />
density from digital <strong>terrain</strong> data. Geomorphology, 36,187−202.<br />
Valeriano, M. M., Kuplich, T. M., Storino, M., Amaral, B. D., Mendes, J. N., & Lima, D. J.<br />
(2006). Modeling small watersheds in Brazilian Amazonia with shuttle radar<br />
topographic mission-90 m data. Computer Geosciences, 32,1169−1181.<br />
van Zyl, J. J. (2001). The shuttle radar topography mission breakthrough in remote<br />
sensing of topography. Acta Astronautica, 48(5–12), 559−565.<br />
Waterloo, M. J., Oliveira, S. M., Drucker, D. P., Nobre, A. D., Cuartas, L. A., Hodnett, M. G.,<br />
Langedijk, I., Jans, W. W. P., Tomasella, J., Araújo, A. C., Pimentel, T. P., & Estrada, J. C.<br />
M. (2006). Export of organic carbon in run-off from an Amazonian rainforest<br />
blackwater catchment. Hydrological Processes, 20(12), 2581−2597.<br />
Wulder, M. (1998). Optical remote-sensing techniques for the assessment of forest<br />
inventory and biophysical parameters. Progress in Physical Geography, 22(4),<br />
449−476.<br />
Zhou, Q., & Liu, X. (2002). Error assessment of grid-based flow routing algorithms used in<br />
hydrological models. International journal of geographical information science, 16(8),<br />
819−842.<br />
Please cite this article as: Rennó, C. D., et al., <strong>HAND</strong>, a <strong>new</strong> <strong>terrain</strong> <strong>descriptor</strong> <strong>using</strong> <strong>SRTM</strong>-<strong>DEM</strong>: Mapping terra-firme rainforest environments<br />
in Amazonia, Remote Sensing of Environment (2008), doi:10.1016/j.rse.2008.03.018<br />
13