Annual Report 2010 (PDF) - Schulthess Group
Annual Report 2010 (PDF) - Schulthess Group
Annual Report 2010 (PDF) - Schulthess Group

You also want an ePaper? Increase the reach of your titles
YUMPU automatically turns print PDFs into web optimized ePapers that Google loves.
<strong>Schulthess</strong> <strong>Group</strong> AG<br />
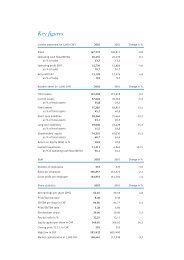
Key figures<br />
415<br />
69<br />
57<br />
340<br />
52<br />
40<br />
302<br />
08 09 10<br />
40<br />
30<br />
39<br />
08 09 10<br />
26<br />
08 09 10<br />
18<br />
08 09 10<br />
2 <strong>Schulthess</strong> <strong>Group</strong><br />
Key figures<br />
Sales<br />
in million<br />
CHF<br />
Cashflow<br />
in million<br />
CHF<br />
EBIT<br />
in million<br />
CHF<br />
Profit for the year<br />
in million CHF<br />
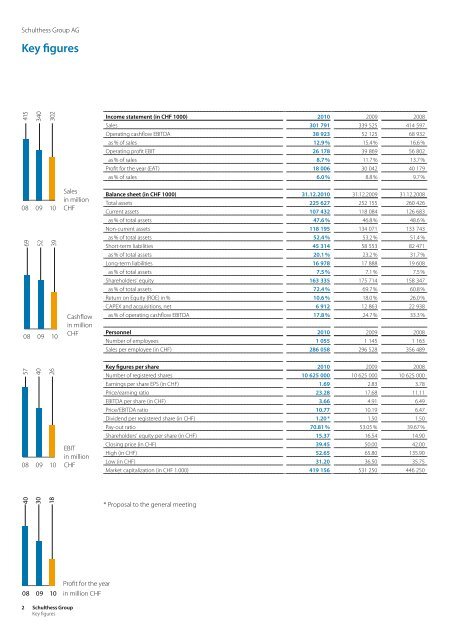
Income statement (in CHF 1000) <strong>2010</strong> 2009 2008<br />
Sales 301 791 339 525 414 597<br />
Operating cashflow EBITDA 38 923 52 125 68 932<br />
as % of sales 12.9 % 15.4 % 16.6 %<br />
Operating profit EBIT 26 178 39 869 56 802<br />
as % of sales 8.7 % 11.7 % 13.7 %<br />
Profit for the year (EAT) 18 006 30 042 40 179<br />
as % of sales 6.0 % 8.8 % 9.7 %<br />
Balance sheet (in CHF 1000) 31.12.<strong>2010</strong> 31.12.2009 31.12.2008<br />
Total assets 225 627 252 155 260 426<br />
Current assets 107 432 118 084 126 683<br />
as % of total assets 47.6 % 46.8 % 48.6 %<br />
Non-current assets 118 195 134 071 133 743<br />
as % of total assets 52.4 % 53.2 % 51.4 %<br />
Short-term liabilities 45 314 58 553 82 471<br />
as % of total assets 20.1 % 23.2 % 31.7 %<br />
Long-term liabilities 16 978 17 888 19 608<br />
as % of total assets 7.5 % 7.1 % 7.5 %<br />
Shareholders' equity 163 335 175 714 158 347<br />
as % of total assets 72.4 % 69.7 % 60.8 %<br />
Return on Equity (ROE) in % 10.6 % 18.0 % 26.0 %<br />
CAPEX and acquisitions, net 6 912 12 863 22 938<br />
as % of operating cashflow EBITDA 17.8 % 24.7 % 33.3 %<br />
Personnel <strong>2010</strong> 2009 2008<br />
Number of employees 1 055 1 145 1 163<br />
Sales per employee (in CHF) 286 058 296 528 356 489<br />
Key figures per share <strong>2010</strong> 2009 2008<br />
Number of registered shares 10 625 000 10 625 000 10 625 000<br />
Earnings per share EPS (in CHF) 1.69 2.83 3.78<br />
Price/earning ratio 23.28 17.68 11.11<br />
EBITDA per share (in CHF) 3.66 4.91 6.49<br />
Price/EBITDA ratio 10.77 10.19 6.47<br />
Dividend per registered share (in CHF) 1.20 * 1.50 1.50<br />
Pay-out ratio 70.81 % 53.05 % 39.67 %<br />
Shareholders' equity per share (in CHF) 15.37 16.54 14.90<br />
Closing price (in CHF) 39.45 50.00 42.00<br />
High (in CHF) 52.65 65.80 135.90<br />
Low (in CHF) 31.20 36.50 35.75<br />
Market capitalization (in CHF 1.000) 419 156 531 250 446 250<br />
* Proposal to the general meeting