D. Abplanalp, P. Wurz, M. Wieser & S. Barabash - ESA
D. Abplanalp, P. Wurz, M. Wieser & S. Barabash - ESA
D. Abplanalp, P. Wurz, M. Wieser & S. Barabash - ESA

Create successful ePaper yourself
Turn your PDF publications into a flip-book with our unique Google optimized e-Paper software.
consists of 500 ns long parts of the spectrum and also<br />
contains a synchronization bit to identify damaged data<br />
packets. The time for downloading one spectrum highly<br />
depends on the data structure and the contact quality to<br />
an Iridium satellite, but in general it takes about 3<br />
minutes. In total, we downloaded 90 selected spectra<br />
during the balloon flight.<br />
3. MEASUREMENTS<br />
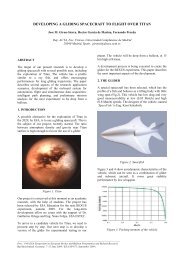
We acquired 4,538 spectra in total during the flight. The<br />
first 103 spectra were residual gas measurements with a<br />
closed inlet valve during the ascent phase of the flight.<br />
Fig. 4 shows such a typical residual gas spectrum with a<br />
dynamic range of 6 decades recorded in a time frame of<br />
66 s.<br />
Figure 4. A typical residual gas spectrum was recorded<br />
in 66 seconds, which is the nominal acquisition time for<br />
one spectrum. The residual gas pressure was 2 × 10 –7<br />
mbar, the electron emission from the cathode was 100<br />
µA and the electron energy was 60 eV. The lanthanum<br />
(139 amu/q) in the mass spectrum originates from the<br />
LaB6 cathode.<br />
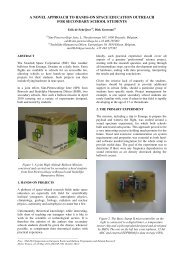
Fig. 5 shows a histogram of 10 spectra taken in the<br />
stratosphere. The lowest partial pressures recorded in<br />
these spectra are at 10 –14 mbar, which corresponds to a<br />
number density of about 250 cm –3 . For longer<br />
integration periods this detection threshold will be<br />
correspondingly lower. The sealing altitude of the<br />
balloon during these measurements was 35 km. In<br />
contrast to the residual gas spectrum (Fig. 4) are the<br />
stratospheric ratios 40 Ar / H2O and 40 Ar / CO2<br />
significantly higher.<br />
The data analysis of the atmospheric gas measurements<br />
is part of our current activities. Due to the very short<br />
developing time of this experiment (total seven months),<br />
we were not able to perform all the calibration<br />
measurements before the launch. Consequently, most of<br />
the calibrations and data analysis are part of the ongoing<br />
work.<br />
Figure 5. Stratospheric gas measurement at 35 km<br />
altitude. The data is a sum of 10 full spectra. The lowest<br />
partial pressures recorded in these spectra are at 10 –14<br />
mbar.<br />
4. CONCLUSIONS<br />
All primary mission goals of P-BACE were<br />
accomplished. We operated a prototype instrument for<br />
Mars atmospheric research on the balloon platform over<br />
5 days on a flight between Kiruna and Canada. P-BACE<br />
operated mostly autonomous and all the Telecommand<br />
and Telemetry was done via Iridium satellite links. A<br />
total of 4,435 mass spectra of the stratosphere have been<br />
recorded. From this 90 spectra have been downloaded<br />
directly via Iridium network. All recorded data were<br />
recovered after the safe MEAP landing and are currently<br />
available for data handling.<br />
Due to the failure-free working of the software and its<br />
scalability, it is intended to also use the software for<br />
future laboratory versions of the P-BACE spectrometer.<br />
5. REFERENCES<br />
[1] <strong>Wieser</strong> M., Kalla L., <strong>Barabash</strong> S., Hedqvist T., Kemi<br />
S., Widell O., <strong>Abplanalp</strong> D., and <strong>Wurz</strong> P., The Mars<br />
Environment Analogue Platform long duration<br />
balloon flight. Adv. Space Res. (2009) in press.<br />
[2] Scherer S., Altwegg K., Balsiger H., Fischer J.,<br />
Jäckel A., Korth A., Mildner M., Piazza D., Rème<br />
H., and <strong>Wurz</strong> P., A novel principle for an ion mirror<br />
design in time-of-flight mass spectrometry, Int. Jou.<br />
Mass Spectr. 251 (2006) 73–81.<br />
[3] Balsiger H., Altwegg K., Bochsler P., Eberhardt P.,<br />
Fischer J., Graf S., Jäckel A., Kopp E., et al., Rosetta<br />
Orbiter Spectrometer for Ion and Neutral Analysis-<br />
ROSINA. Space Sci. Rev., 128 (2007), 745–801.<br />
[4] Dahl D. A. SIMION3D Version 7.0, User’s Manual,<br />
Idaho National Engineering and Environmental<br />
Laboratory, 2000.<br />
[5] Wutz, Adam, Walcher. Handbuch der Vakuumtechnik,<br />
Vieweg, 1997.