D. Abplanalp, P. Wurz, M. Wieser & S. Barabash - ESA
D. Abplanalp, P. Wurz, M. Wieser & S. Barabash - ESA
D. Abplanalp, P. Wurz, M. Wieser & S. Barabash - ESA

Create successful ePaper yourself
Turn your PDF publications into a flip-book with our unique Google optimized e-Paper software.
A NEUTRAL GAS MASS SPECTROMETER TO MEASURE THE CHEMICAL<br />
COMPOSITION OF THE STRATOSPHERE<br />
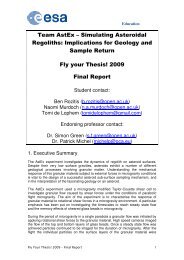
Dominic <strong>Abplanalp</strong> (1) , Peter <strong>Wurz</strong> (1) , Martin <strong>Wieser</strong> (2) , Stas <strong>Barabash</strong> (2)<br />
(1) Physikalisches Institut, Universität Bern, Sidlerstrasse 5, 3012 Bern, Switzerland, Email: abplanalp@space.unibe.ch,<br />
wurz@space.unibe.ch<br />
(2) Swedish Institute of Space Physics, Box 812, 98128, Kiruna, Sweden, Email: wieser@irf.se, barabash@irf.se<br />
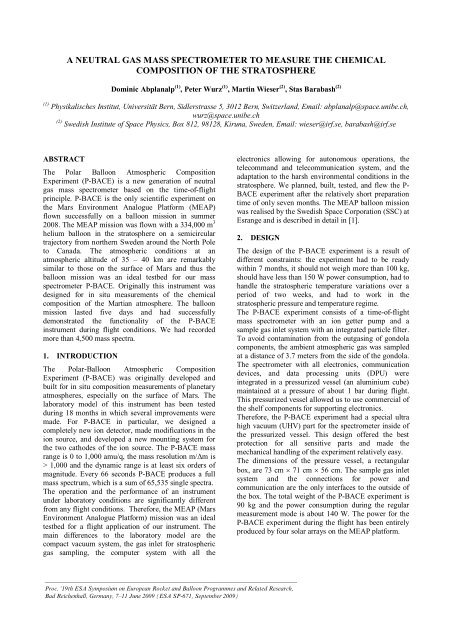
ABSTRACT<br />
The Polar Balloon Atmospheric Composition<br />
Experiment (P-BACE) is a new generation of neutral<br />
gas mass spectrometer based on the time-of-flight<br />
principle. P-BACE is the only scientific experiment on<br />
the Mars Environment Analogue Platform (MEAP)<br />
flown successfully on a balloon mission in summer<br />
2008. The MEAP mission was flown with a 334,000 m 3<br />
helium balloon in the stratosphere on a semicircular<br />
trajectory from northern Sweden around the North Pole<br />
to Canada. The atmospheric conditions at an<br />
atmospheric altitude of 35 – 40 km are remarkably<br />
similar to those on the surface of Mars and thus the<br />
balloon mission was an ideal testbed for our mass<br />
spectrometer P-BACE. Originally this instrument was<br />
designed for in situ measurements of the chemical<br />
composition of the Martian atmosphere. The balloon<br />
mission lasted five days and had successfully<br />
demonstrated the functionality of the P-BACE<br />
instrument during flight conditions. We had recorded<br />
more than 4,500 mass spectra.<br />
1. INTRODUCTION<br />
The Polar-Balloon Atmospheric Composition<br />
Experiment (P-BACE) was originally developed and<br />
built for in situ composition measurements of planetary<br />
atmospheres, especially on the surface of Mars. The<br />
laboratory model of this instrument has been tested<br />
during 18 months in which several improvements were<br />
made. For P-BACE in particular, we designed a<br />
completely new ion detector, made modifications in the<br />
ion source, and developed a new mounting system for<br />
the two cathodes of the ion source. The P-BACE mass<br />
range is 0 to 1,000 amu/q, the mass resolution m/Δm is<br />
> 1,000 and the dynamic range is at least six orders of<br />
magnitude. Every 66 seconds P-BACE produces a full<br />
mass spectrum, which is a sum of 65,535 single spectra.<br />
The operation and the performance of an instrument<br />
under laboratory conditions are significantly different<br />
from any flight conditions. Therefore, the MEAP (Mars<br />
Environment Analogue Platform) mission was an ideal<br />
testbed for a flight application of our instrument. The<br />
main differences to the laboratory model are the<br />
compact vacuum system, the gas inlet for stratospheric<br />
gas sampling, the computer system with all the<br />
electronics allowing for autonomous operations, the<br />
telecommand and telecommunication system, and the<br />
adaptation to the harsh environmental conditions in the<br />
stratosphere. We planned, built, tested, and flew the P-<br />
BACE experiment after the relatively short preparation<br />
time of only seven months. The MEAP balloon mission<br />
was realised by the Swedish Space Corporation (SSC) at<br />
Esrange and is described in detail in [1].<br />
2. DESIGN<br />
___________________________________________________________________________________<br />
Proc. ‘19th <strong>ESA</strong> Symposium on European Rocket and Balloon Programmes and Related Research,<br />
Bad Reichenhall, Germany, 7–11 June 2009 (<strong>ESA</strong> SP-671, September 2009)<br />
The design of the P-BACE experiment is a result of<br />
different constraints: the experiment had to be ready<br />
within 7 months, it should not weigh more than 100 kg,<br />
should have less than 150 W power consumption, had to<br />
handle the stratospheric temperature variations over a<br />
period of two weeks, and had to work in the<br />
stratospheric pressure and temperature regime.<br />
The P-BACE experiment consists of a time-of-flight<br />
mass spectrometer with an ion getter pump and a<br />
sample gas inlet system with an integrated particle filter.<br />
To avoid contamination from the outgasing of gondola<br />
components, the ambient atmospheric gas was sampled<br />
at a distance of 3.7 meters from the side of the gondola.<br />
The spectrometer with all electronics, communication<br />
devices, and data processing units (DPU) were<br />
integrated in a pressurized vessel (an aluminium cube)<br />
maintained at a pressure of about 1 bar during flight.<br />
This pressurized vessel allowed us to use commercial of<br />
the shelf components for supporting electronics.<br />
Therefore, the P-BACE experiment had a special ultra<br />
high vacuum (UHV) part for the spectrometer inside of<br />
the pressurized vessel. This design offered the best<br />
protection for all sensitive parts and made the<br />
mechanical handling of the experiment relatively easy.<br />
The dimensions of the pressure vessel, a rectangular<br />
box, are 73 cm 71 cm 56 cm. The sample gas inlet<br />
system and the connections for power and<br />
communication are the only interfaces to the outside of<br />
the box. The total weight of the P-BACE experiment is<br />
90 kg and the power consumption during the regular<br />
measurement mode is about 140 W. The power for the<br />
P-BACE experiment during the flight has been entirely<br />
produced by four solar arrays on the MEAP platform.
2.1. Mass analyzer<br />
All previous instruments used in planetary missions to<br />
analyze the gas composition were magnetic or<br />
quadrupole instruments and limited in the mass range<br />
below 150 amu/q. The P-BACE instrument is a novel<br />
neutral gas mass spectrometer of the time-of-flight type,<br />
based on an earlier design for the Rosetta mission [2, 3].<br />
The design of the mass spectrometer is optimised for<br />
low weight and small size, but with a sufficient<br />
performance for measuring elemental and isotope<br />
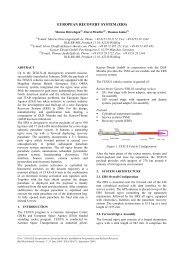
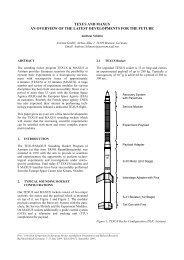
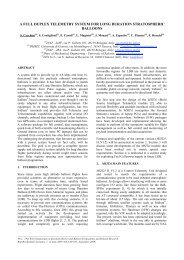
abundances. Fig. 1 shows an engineering drawing of the<br />
mass spectrometer. The total length of the mass<br />
spectrometer is 325 mm and the inner diameter is 72.1<br />
mm.<br />
Figure 1. Engineering drawing of the mass<br />
spectrometer. A) flange with ion source and detector<br />
and corresponding electrical feed-throughs, B) ion<br />
source with acceleration electrodes, C) sampling gas<br />
inlet, D) drift region, E) flange for external turbopump,<br />
F) ion reflectron region, G) flange for ion getter pump,<br />
H) ion detector.<br />
The mass spectrometer consists of an electron impact<br />
ion storage source with integrated acceleration<br />
electrodes, a field-free drift tube, an ion mirror<br />
(reflectron), and a detector. The electrodes are made of<br />
stainless steel. The ion source, the acceleration<br />
electrodes, and the detector together with all associated<br />
electrical feed-throughs are directly mounted on a single<br />
CF-63 flange. Also the reflectron and the drift tubes<br />
with their electrical feed-throughs are mounted on a CF-<br />
63 flange. With this design, the mass spectrometer can<br />
easily be mounted in a vacuum tube. Having all ionoptical<br />
elements accommodated on only two flanges<br />
gives us high flexibility in using the same sensor in<br />
different vacuum tubes. Moreover, the compact design<br />
of the mass spectrometer limits the total volume to 1.3<br />
liter. All front end electronic components such as<br />
capacitors and resistors are placed outside of the flange,<br />
thus contamination of the vacuum by possibly outgasing<br />
components inside the measurement volume is avoided.<br />
In addition, avoiding electronic components inside the<br />
spectrometer enables to heat the system to about 250°C,<br />
which is crucial for good vacuum conditions.<br />
The sample gas flows into the sensor volume near the<br />
ion source and is ionized by a continuous electron beam,<br />
which is emitted by a lanthanum hexaboride (LaB6)<br />
cathode from Kimball Physics ® . Typical electron<br />
emission currents are in the range of 100 – 150 µA and<br />
an electron energy of 0 – 100 eV is possible. The ions<br />
are stored in the electric field depression of the electron<br />
beam for approximately 1 ms, depending on the pulse<br />
frequency. With a very fast negative pulse of about –<br />
400 V on the extraction grid of the ion source and a<br />
frequency of 1 kHz, the stored ions are accelerated into<br />
the mass analyzing part of the spectrometer. A pulse<br />
repetition frequency of 1 kHz turned out to be an<br />
optimal value for our setup.<br />
The extracted ions are accelerated and focused (in time<br />
and space) by a multi-element electrostatic lens just in<br />
front of the ion source and then enter the field-free drift<br />
tube. At the end of this drift tube, a gridless reflectron<br />
mirrors the ions back into another drift tube, directed<br />
towards the detector. The reflectron consists of 16<br />
stainless steel rings with different shapes and potentials,<br />
carefully adjusted to focus the ions spatially and<br />
energetically on the detector. The potentials of the<br />
acceleration lenses and the reflectron rings are between<br />
+50 V and –5 kV, the drift potential is –1,990 V.<br />
The detector was especially designed and built for this<br />
mass spectrometer and is characterised by a very small<br />
volume, bakeable to 250 °C, fast signal response (~0.8<br />
ns peak width) facilitated by a 50 Ω impedance matched<br />
gold plated anode. We used two matched microchannel<br />
plates (MCP) from Burle ® with an active detection<br />
diameter of 8 mm and a bias angle of 8° in a chevron<br />
configuration. The standard potential of the front MCP<br />
is –1.9 kV, the back MCP is on –270 V, and the anode<br />
is on ground potential.<br />
The positions, shapes, and voltages of all ion-optical<br />
elements were optimised using the computer program<br />
SIMION v7/v8 [4], in combination with several selfmade<br />
C-programs. The two main parameters in the<br />
optimization process were a high ion transmission<br />
through the whole ion-optical system and, at the same<br />
time, a high mass resolution.<br />
The efficiency of the ion source is highly sensitive to<br />
changes of electrode potentials and thus they need<br />
precise and stable low voltage power supplies. For this<br />
reason, power supplies based on operational amplifiers<br />
have been built in-home.<br />
2.2. Mechanical setup<br />
The whole mass spectrometer is attached with 12<br />
springs to an aluminium frame, which guarantees good<br />
mechanical isolation against vibration and shocks from<br />
the outside. Mechanical resonance frequencies were<br />
damped with silicon tubes on the surface of some<br />
selected springs. The rationale behind this mounting<br />
system was to protect the shock sensitive parts of the<br />
ion source, particularly the cathodes, during the
transport by truck from Switzerland to Sweden as well<br />
as during descent and landing of the balloon. The largest<br />
mechanical forces were expected at the descent during<br />
the opening of the parachute.<br />
The DPU, the low voltage power supplies with the<br />
protection units, and the ion getter pump controller are<br />
installed on the top of the frame for good accessibility.<br />
The high voltage power supplies, the pulser unit, and<br />
the voltage dividers are mounted inside the frame, close<br />
to the spectrometer. One Iridium modem is fixed on the<br />
bottom of the frame inside the pressurized vessel. A<br />
second modem is mounted outside of the pressurized<br />
vessel.<br />
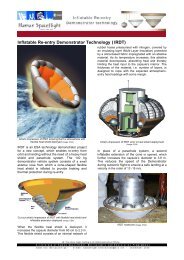
Figure 2. The P-BACE experiment in the pressurized<br />
vessel. A part of the spectrometer (in the lower part) as<br />
well as some low voltage units (in the upper part) are<br />
visible.<br />
2.3. Vacuum system<br />
The vacuum system of the P-BACE experiment consists<br />
of the ultra-high vacuum vessel of the spectrometer and<br />
the pressurized box. The mass spectrometer as well as<br />
the DPU and all electronics are located inside of the<br />
pressurized vessel. Fig. 3 shows a schematic drawing of<br />
all vacuum components.<br />
Insulation distances between the high voltage feedthroughs<br />
on the outside of the sensor flange are<br />
designed to operate the spectrometer in normal<br />
laboratory conditions, i.e., at about 1 bar. According to<br />
Paschen’s law, at a pressure of 4 – 10 mbar, the<br />
breakdown voltage is much smaller than at normal<br />
pressure. The DPU, the high voltage power supplies,<br />
some parts of the extraction pulser unit, and the ion<br />
getter pump control are commercial available<br />
components, thus they require atmospheric pressure and<br />
normal convection cooling by fans. The expected<br />
pressure at 33 – 40 km is too low for convection cooling<br />
and some commercial electronic components like<br />
capacitors could be destroyed in low pressure<br />
conditions. For all these reasons, we designed and built<br />
the pressurized vessel, in which the pressure is<br />
maintained through a nitrogen gas supply system, which<br />
guarantees a constant pressure of about 950 mbar inside.<br />
Figure 3. Schematic drawing of the P-BACE vacuum<br />
system. A) ion getter pump, B) pressure compensation<br />
valve, C) electrical feed-through, D) right angle valve<br />
for turbopump, E) overpressure safety valve, F) special<br />
gas inlet orifice, G) flexible tubing, H) electromagnetic<br />
valve, I) outside pressure sensor, J) measurement gas<br />
feed-through, K) manual safety valve, L) peristaltic<br />
pump, M) gas inlet filter, O) pressurized vessel.<br />
The box has two MIL-C-26482 (32/41 pins) feedthroughs<br />
for power, external monitor, keyboard, mouse,<br />
ethernet, one Iridium modem, and two coax 50 Ω high<br />
frequency feed-throughs for the Iridium and GPS<br />
antennas. Five sides of the cubic box are sealed by<br />
weldings, the front panel is demountable and sealed<br />
with an O-ring. Although we tested the box with an over<br />
pressure of 1,500 mbar during 15 days without any loss<br />
of pressure, a 2 liter (150 bar) nitrogen gas bottle with a<br />
pressure compensation valve was integrated inside the<br />
box to compensate for unexpected leaks. For safety<br />
reasons, especially during the recovery operations after<br />
landing, the box itself was protected against over<br />
pressure using an overpressure valve.<br />
The mass spectrometer itself is working in a pressure<br />
range from 5 × 10 –6 mbar to 1 × 10 –10 mbar. The<br />
laboratory version works in an even lower pressure<br />
regime, if connected to an efficient pumping system. It<br />
is obvious that for continuous measurements of more<br />
than 100 hours a pump is needed to maintain the good<br />
vacuum inside the mass spectrometer. We decided to<br />
use an ion getter pump (Varian ® , StarCell VacIon Plus<br />
20 with a MiniVac controller), characterised by a low<br />
power consumption without any active cooling, and a<br />
relatively low weight. The nominal pumping speed of<br />
this pump is 20 l/s for nitrogen. Starting with a pressure<br />
of about 4 – 10 mbar at 33 – 40 km height and the<br />
working pressure of less than 5 × 10 –6 mbar in the<br />
spectrometer requires that the pressure of the incoming<br />
sample gas has to be reduced by more than a factor of<br />
10 6 for a failure-free long time measurement. A pressure<br />
reduction of the incoming gas is often done with a long,
thin capillary. However, in a stratospheric application<br />
aerosols and water ice particles could block the thin<br />
tube, making this set-up rather error-prone. We<br />
therefore decided to use instead a bakeable pinhole and<br />
modified a CF-16 flange copper sealing for our<br />
application. The orifice itself consists of a 1 mm thick<br />
disk made of gold-platinum alloy with a laser-drilled<br />
pinhole. The smallest reproducible pinhole had a<br />
diameter of about 20 µm. The disc has been brazed<br />
vacuum-tight onto the copper gasket. Vacuum flow<br />
calculations of the system [5] yields a flow rate of 4.5 ×<br />
10 -6 mbar l s -1 at an outside pressure of 5 mbar.<br />
However, first tests showed a higher flow rate. With an<br />
outside pressure of 5 mbar we obtained an instrument<br />
pressure of 2 × 10 -6 mbar, i.e., close to the upper limit<br />
for the instrument. Reduction of the pinhole diameter<br />
with a special tool under a microscope finally resulted<br />
in an equilibrium pressure of about 7 × 10 -7 mbar at 5<br />
mbar outside pressure.<br />
Outside of the flange with the pinhole, we had mounted<br />
an 11 W heater-foil (Minco ® ), which allowed (if<br />
needed) to heat the flange up to 110 °C within a few<br />
minutes. The heater was planned to melt any ice and/or<br />
aerosols on the orifice in case of a blocked gas inlet.<br />
The gas inlet system consists of a five meter long Teflon<br />
tube to sample the stratosphere far away from the<br />
gondola. A special designed Teflon particle filter is<br />
mounted at the intake side. The filter has two mesh<br />
grids, one with 10 µm and one with 5 µm pore size,<br />
respectively. A small peristaltic pump (Alitea ® ,<br />
400F/M1) with a pumping speed of 150 ml/min is<br />
placed just before the gas inlet to guarantee continuous<br />
gas throughput through the inlet system. It’s flow rate is<br />
sufficient to exchange the complete gas volume of the<br />
inlet system in one minute, which corresponds to the<br />
time interval for data acquisition.<br />
Outside of the experiment box, a right angle inlet valve<br />
(the manual safety valve) was added and was opened<br />
just a few minutes before launch. Inside of the box, a<br />
pressure sensor (Baumer ® , SN 1-15010814-16) and an<br />
electromagnetic valve (Vacom ® , IPVA 10EK-24VDC)<br />
were installed. As soon as the experiment reached the<br />
desired altitude, the electromagnetic valve was opened<br />
and the atmospheric gases started flowing into the UHV<br />
part. For safety reasons, we used a power-off open<br />
valve, which forms a lower risk for operation than a<br />
power-off closed valve and, in addition, does not need<br />
any power during regular operations, i.e., while it is<br />
open. However, with a power-off open valve, an<br />
extreme cold restart of the system results in an open<br />
inlet valve and therefore in gas flowing into the UHV<br />
part, which, in combination with the powered off ion<br />
getter pump, would result in a very quick venting of the<br />
UHV part. In such case, the ion getter pump would not<br />
be able to restart and no scientific data could be<br />
acquired anymore. Such a problem would be critical<br />
especially during the balloon ascend, because in this<br />
period the outside pressure is still too high to start the<br />
ion getter pump. Also a longer power failure within the<br />
measurement phase could be critical, but laboratory<br />
tests demonstrated that we can handle a power failure of<br />
at least 50 minutes. For these tests, we added an<br />
additional pressure sensor in the UHV part and turned<br />
off the power of the ion getter pump at an inside<br />
pressure of 5 × 10 –7 mbar and an outside pressure of 9.1<br />
mbar. After about 4 minutes, the inside pressure<br />
increased to 3 × 10 –5 mbar and continued to increase<br />
exponentially. The maximum startup pressure for the<br />
ion getter pump is 5 × 10 –2 mbar, which corresponds to<br />
a venting time of about 50 minutes without pumping.<br />
For the prelaunch preparations, a CF-40 flange with a<br />
right angle valve was welded on the vacuum tube of the<br />
mass spectrometer, thus the instrument could be<br />
pumped during ground operations with a turbo pump. In<br />
addition, we baked the instrument while pumping with<br />
the turbo pump up to 200 °C, which significantly<br />
reduced the background in the spectrometer.<br />
2.4. Electronics<br />
The aim of the P-BACE/MEAP experiment was to test<br />
the system in conditions similar to Mars or Moon.<br />
Therefore, we designed and built an experimental setup<br />
that is completely computerized to allow for<br />
autonomous operation. The Data Processing Unit (DPU)<br />
is a 600 MHz Celeron-M ® processor embedded in an<br />
industrial PC (MPL, PIP7) with a power consumption of<br />
16 W, an operational temperature range from –20 °C to<br />
+60 °C, and an input voltage of 28 VDC. The storage<br />
medium consists of two 16 GB flash disks, which<br />
redundantly stores all housekeeping and scientific data.<br />
The DPU is extended with a 32 channel (16-bit) low<br />
speed ADC-card (Diamond systems ® , MM-32x-AT), a<br />
16 channel (12-bit) DAC-card (Diamond systems ® ,<br />
RMM-1612), and a Relay-card with 20 relay channel<br />
outputs (Diamond systems ® , IR-104-PBF). For the<br />
scientific data acquisition, we use a full-length PCI<br />
standard high speed ADC-card (Agilent ® , U1082A,<br />
AP240 with averager firmware). In single channel<br />
mode, this card has a sampling rate of 2 GS/s with an<br />
analogue bandwidth of 1 GHz and a vertical resolution<br />
of 8 bits. To record spectra, the card digitizes the<br />
detector signal for 30 µs, which corresponds to a mass<br />
range of 0 – 1,000 amu/q. The averager firmware has up<br />
to 65,536 triggers per segment, which gives a total<br />
vertical resolution of 24 bits. The disadvantage of this<br />
card is the high power consumption (about 70 W) and<br />
the narrow operational temperature range from 0 °C to<br />
+40 °C.<br />
The protection unit is a custom-made part of the<br />
electronic system and consists of a watch dog timer and<br />
a pressure sensor for the high voltage protection in case<br />
of a loss of pressure in the vessel. Several DC/DC<br />
converters in this unit provide the different voltages<br />
needed for the experiment. All ten low voltage power
supplies are custom-made with operational amplifiers,<br />
which work in the –100 V to +100 V output range. Also<br />
custom made is the cathode emission control unit,<br />
which is a completely new development for the P-<br />
BACE experiment and provides a constant emission<br />
current of the cathode. We have mounted two sets of<br />
cathodes in the ion source for redundancy and a digital<br />
switch-over unit allows choosing either of the cathodes.<br />
The high voltage power supplies are commercial<br />
available units from Applied Kilovolts ® . We used five<br />
different models of high voltage power supplies. One<br />
unit with a 1 kV output (HP001), one with a 2.5 kV<br />
output (HP2.5), one with a 10 kV output (HP010), and<br />
two units each with 5 kV outputs (HP005, MS005).<br />
Since the model MS005 has five independent 5 kV<br />
outputs we had in total nine independent high voltage<br />
DC-DC converters. Together with two additional<br />
potential dividers we end up with 16 high voltage<br />
potentials for the mass spectrometer.<br />
The pulser unit consists of a high voltage power supply<br />
(HP001), a pulse generator (Directedenergy ® , DEI<br />
HV1000), and some custom-made front end<br />
components. A fast (rise time < 5 ns) and a very clean<br />
pulse without any ringing is a crucial factor for<br />
generating high-quality mass spectra. During the P-<br />
BACE measurement campaign, we worked with a pulse<br />
repetition frequency of 1 kHz and a pulse height of –440<br />
V.<br />
Due to the use of commercial available electronic<br />
components, we have to keep the temperature in the box<br />
to within the rather strict limits of between 0 °C to +40<br />
°C. We therefore added a miniature temperature<br />
controller (Minco ® , CT325 with a Pt-100 temperature<br />
sensor) and a 20 W resistor heater. A normal 12 VDC<br />
fan (normally used for a PC) has been mounted under<br />
the high speed ADC card to provide a homogenous heat<br />
distribution inside the whole box. Luckily, these heaters<br />
were not necessary during flight. Based on thermal<br />
calculations of the balloon gondola, it was decided to<br />
paint the outside of the pressurized vessel white to<br />
maintain a reasonable low temperature during flight. We<br />
did not integrate any active cooling systems. During the<br />
116 hours long mission, the temperature in the box was<br />
always about +35 °C and thus never reached a critical<br />
level of above +40 °C.<br />
For measuring the local air temperature, a Pt-100<br />
temperature sensor was installed on the 3.7 m long<br />
aluminium gas inlet boom. The temperature<br />
measurements in combination with the measured<br />
outside pressure, and the exact position of the balloon<br />
turned out to be helpful for interpreting the scientific<br />
data.<br />
2.5. Communication system and software<br />
In the laboratory we directly used the USB ports of the<br />
DPU for the monitor screen, the keyboard, and the<br />
mouse. For downloading data from the DPU to other PC<br />
systems we used an ethernet connection. At this time,<br />
the ground support equipment (GSE) software was an<br />
integrated part of the DPU software package. In the<br />
calibration phase at the University of Bern, remote<br />
access to the P-BACE DPU via the ethernet connection<br />
was possible, which had accelerated the whole software<br />
developing process tremendously. During the<br />
instrument tests at Esrange (Sweden), we used an<br />
external computer with the GSE software and<br />
communicated via the ethernet connection with the P-<br />
BACE DPU.<br />
During the balloon flight we worked with two modems<br />
of the Iridium satellite communication system. The<br />
Iridium satellites are in a low Earth orbit (~800 km)<br />
with an inclination of 86.4°, resulting in good service<br />
coverage at high latitudes. For redundancy reasons, two<br />
identical modems with a built-in GPS receiver (NAL<br />
research ® , A3LA-DG) and two identical dual<br />
Iridium/GPS antennas (NAL research ® , SAF4070-IG)<br />
were installed on the P-BACE experiment. The Iridium<br />
system provides two different communication modes,<br />
the Short-Burst Data (SBD) mode with a data rate of<br />
1,960 Bytes/message (used for sending single<br />
commands and receiving housekeeping parameters<br />
every 10 minutes) and the Dial-up mode with a data rate<br />
of 2.4 kbits/sec. The Dial-up mode was used for real<br />
time housekeeping parameter checking as well as for<br />
downloading sample spectra.<br />
Controlling and communication with the experiment<br />
was located at the Swedish Institute of Space Physics<br />
(IRF) at Kiruna, where an Iridium modem and a PC<br />
with the GSE software were available. The software for<br />
the P-BACE experiment was developed by IRF at<br />
Kiruna, Sweden. The operating system of the DPU is a<br />
Debian LINUX distribution. All programs are written in<br />
C++ and were running on the DPU, except the P-BACE<br />
control software (GSE) with a Graphical User Interface<br />
(GUI), which was installed on the control station PC at<br />
IRF. The DPU provides the hardware control software<br />
for all PC104-cards, the high speed ADC-card, and both<br />
Iridium modems as well as the scientific data software<br />
and several macros. Two modes are implemented on the<br />
DPU, an IDLE mode, which acquires, stores, and sends<br />
(via SBD) some housekeeping parameters and a<br />
FLIGHT mode which acquires and stores scientific data<br />
together with all housekeeping data. To avoid long and<br />
unwanted venting phases, the system automatically<br />
starts in the IDLE mode after a power cycle. The IDLE<br />
mode is characterized by an active ion getter pump and<br />
active temperature and pressure sensors, but turned off<br />
high and low voltages for the mass spectrometer.<br />
The FLIGHT mode activates the high speed ADC-card<br />
and acquires scientific data as soon as a trigger signal<br />
occurs. A set of macros allows a comfortable ramp-up<br />
of the high voltages and changing of different settings.<br />
In the Dial-up mode, the last stored spectrum is<br />
downloaded in 59 compressed data packets, each packet
consists of 500 ns long parts of the spectrum and also<br />
contains a synchronization bit to identify damaged data<br />
packets. The time for downloading one spectrum highly<br />
depends on the data structure and the contact quality to<br />
an Iridium satellite, but in general it takes about 3<br />
minutes. In total, we downloaded 90 selected spectra<br />
during the balloon flight.<br />
3. MEASUREMENTS<br />
We acquired 4,538 spectra in total during the flight. The<br />
first 103 spectra were residual gas measurements with a<br />
closed inlet valve during the ascent phase of the flight.<br />
Fig. 4 shows such a typical residual gas spectrum with a<br />
dynamic range of 6 decades recorded in a time frame of<br />
66 s.<br />
Figure 4. A typical residual gas spectrum was recorded<br />
in 66 seconds, which is the nominal acquisition time for<br />
one spectrum. The residual gas pressure was 2 × 10 –7<br />
mbar, the electron emission from the cathode was 100<br />
µA and the electron energy was 60 eV. The lanthanum<br />
(139 amu/q) in the mass spectrum originates from the<br />
LaB6 cathode.<br />
Fig. 5 shows a histogram of 10 spectra taken in the<br />
stratosphere. The lowest partial pressures recorded in<br />
these spectra are at 10 –14 mbar, which corresponds to a<br />
number density of about 250 cm –3 . For longer<br />
integration periods this detection threshold will be<br />
correspondingly lower. The sealing altitude of the<br />
balloon during these measurements was 35 km. In<br />
contrast to the residual gas spectrum (Fig. 4) are the<br />
stratospheric ratios 40 Ar / H2O and 40 Ar / CO2<br />
significantly higher.<br />
The data analysis of the atmospheric gas measurements<br />
is part of our current activities. Due to the very short<br />
developing time of this experiment (total seven months),<br />
we were not able to perform all the calibration<br />
measurements before the launch. Consequently, most of<br />
the calibrations and data analysis are part of the ongoing<br />
work.<br />
Figure 5. Stratospheric gas measurement at 35 km<br />
altitude. The data is a sum of 10 full spectra. The lowest<br />
partial pressures recorded in these spectra are at 10 –14<br />
mbar.<br />
4. CONCLUSIONS<br />
All primary mission goals of P-BACE were<br />
accomplished. We operated a prototype instrument for<br />
Mars atmospheric research on the balloon platform over<br />
5 days on a flight between Kiruna and Canada. P-BACE<br />
operated mostly autonomous and all the Telecommand<br />
and Telemetry was done via Iridium satellite links. A<br />
total of 4,435 mass spectra of the stratosphere have been<br />
recorded. From this 90 spectra have been downloaded<br />
directly via Iridium network. All recorded data were<br />
recovered after the safe MEAP landing and are currently<br />
available for data handling.<br />
Due to the failure-free working of the software and its<br />
scalability, it is intended to also use the software for<br />
future laboratory versions of the P-BACE spectrometer.<br />
5. REFERENCES<br />
[1] <strong>Wieser</strong> M., Kalla L., <strong>Barabash</strong> S., Hedqvist T., Kemi<br />
S., Widell O., <strong>Abplanalp</strong> D., and <strong>Wurz</strong> P., The Mars<br />
Environment Analogue Platform long duration<br />
balloon flight. Adv. Space Res. (2009) in press.<br />
[2] Scherer S., Altwegg K., Balsiger H., Fischer J.,<br />
Jäckel A., Korth A., Mildner M., Piazza D., Rème<br />
H., and <strong>Wurz</strong> P., A novel principle for an ion mirror<br />
design in time-of-flight mass spectrometry, Int. Jou.<br />
Mass Spectr. 251 (2006) 73–81.<br />
[3] Balsiger H., Altwegg K., Bochsler P., Eberhardt P.,<br />
Fischer J., Graf S., Jäckel A., Kopp E., et al., Rosetta<br />
Orbiter Spectrometer for Ion and Neutral Analysis-<br />
ROSINA. Space Sci. Rev., 128 (2007), 745–801.<br />
[4] Dahl D. A. SIMION3D Version 7.0, User’s Manual,<br />
Idaho National Engineering and Environmental<br />
Laboratory, 2000.<br />
[5] Wutz, Adam, Walcher. Handbuch der Vakuumtechnik,<br />
Vieweg, 1997.