

Florida Gang Reduction Strategy 2008 - 2012
Florida Gang Reduction Strategy 2008 - 2012
Florida Gang Reduction Strategy 2008 - 2012

Create successful ePaper yourself
Turn your PDF publications into a flip-book with our unique Google optimized e-Paper software.
20<br />
Concept of Operation<br />
Year of Release and Number of Releases<br />
2005<br />
24,953<br />
2004<br />
23,348<br />
2003<br />
21,246<br />
2002<br />
20,009<br />
2001<br />
20,340<br />
2000<br />
19,535<br />
1999<br />
17,613<br />
1998<br />
15,841<br />
1997<br />
19,919<br />
1996<br />
16,830<br />
1995<br />
12,645<br />
10%<br />
11%<br />
11%<br />
11%<br />
10%<br />
10%<br />
11%<br />
12%<br />
12%<br />
13%<br />
12%<br />
0 10% 20% 30% 40% 50% 60%<br />
regularity. Members of the task force should help<br />
guide what information should be gathered for this<br />
list. At least once a year, the coordinating council<br />
should be provided a copy of the list that is maintained<br />
by the regional task forces.<br />
Rehabilitation and Re-entry Plan<br />
Development<br />
With guidance and assistance from the Attorney<br />
General and the coordinating council, the Department<br />
of Corrections and local law enforcement<br />
agencies will make the rehabilitation and re-entry<br />
of criminal gang members a major component<br />
of the re-entry program. The Department of Corrections’<br />
re-entry initiative will also be designed<br />
to fulfill the objectives of the <strong>Gang</strong> <strong>Reduction</strong><br />
<strong>Florida</strong> <strong>Gang</strong> <strong>Reduction</strong> <strong>Strategy</strong><br />
11%<br />
12%<br />
12%<br />
13%<br />
13%<br />
13%<br />
14%<br />
14%<br />
13%<br />
13%<br />
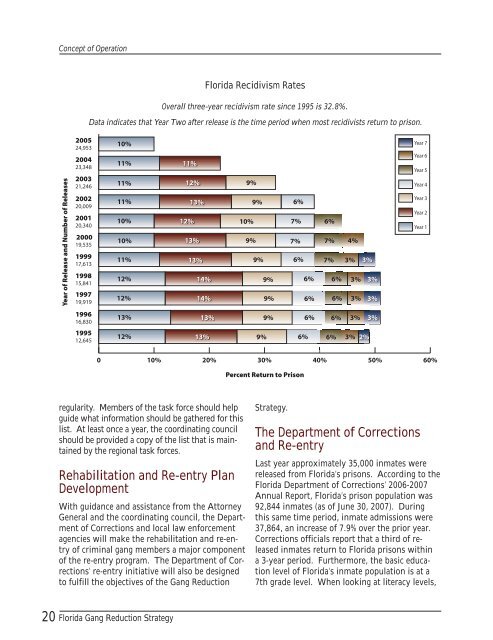
<strong>Florida</strong> Recidivism Rates<br />
Overall three-year recidivism rate since 1995 is 32.8%.<br />
Data indicates that Year Two after release is the time period when most recidivists return to prison.<br />
9%<br />
10%<br />
9%<br />
9%<br />
9%<br />
9%<br />
9%<br />
9%<br />
9%<br />
<strong>Strategy</strong>.<br />
6%<br />
7%<br />
7%<br />
6%<br />
6%<br />
Percent Return to Prison<br />
6%<br />
6%<br />
6%<br />
6%<br />
7%<br />
7%<br />
6%<br />
6%<br />
6%<br />
6%<br />
4%<br />
3%<br />
3%<br />
3%<br />
3%<br />
3%<br />
3%<br />
2%<br />
3%<br />
3%<br />
3%<br />
The Department of Corrections<br />
and Re-entry<br />
Year 7<br />
Year 6<br />
Year 5<br />
Year 4<br />
Year 3<br />
Year 2<br />
Year 1<br />
Last year approximately 35,000 inmates were<br />
released from <strong>Florida</strong>’s prisons. According to the<br />
<strong>Florida</strong> Department of Corrections’ 2006-2007<br />
Annual Report, <strong>Florida</strong>’s prison population was<br />
92,844 inmates (as of June 30, 2007). During<br />
this same time period, inmate admissions were<br />
37,864, an increase of 7.9% over the prior year.<br />
Corrections officials report that a third of released<br />
inmates return to <strong>Florida</strong> prisons within<br />
a 3-year period. Furthermore, the basic education<br />
level of <strong>Florida</strong>’s inmate population is at a<br />
7th grade level. When looking at literacy levels,