socio-economic profile of rubber tappers in the small holding sector
socio-economic profile of rubber tappers in the small holding sector
socio-economic profile of rubber tappers in the small holding sector

Create successful ePaper yourself
Turn your PDF publications into a flip-book with our unique Google optimized e-Paper software.
The <strong>in</strong>comes from agricultural <strong>sector</strong> and tertiary <strong>sector</strong> are <strong>in</strong>creas<strong>in</strong>g with <strong>the</strong> rise<br />
<strong>in</strong> <strong>the</strong> level <strong>of</strong> <strong>in</strong>come. While, <strong>in</strong> <strong>the</strong> lowest <strong>in</strong>come group share <strong>of</strong> different sources is<br />
tapp<strong>in</strong>g 71, agriculture 0, animal husbandry 4.4, casual labour 19.6 and o<strong>the</strong>rs 5. In<br />
higher <strong>in</strong>come group <strong>the</strong> pattern <strong>of</strong> contribution <strong>of</strong> different sources is tapp<strong>in</strong>g 25.2,<br />
agriculture 26.2, animal husbandry 1.2, casual labour 7 and tertiary <strong>sector</strong> 40.4. Better<br />
<strong>socio</strong>- <strong>economic</strong> background <strong>of</strong> higher <strong>in</strong>come group households helps <strong>the</strong>m to engage <strong>in</strong><br />
tertiary <strong>sector</strong> more effectively. As far as higher <strong>in</strong>come group is concerned, <strong>in</strong>come from<br />
tertiary <strong>sector</strong> represents major share <strong>of</strong> <strong>the</strong>ir total <strong>in</strong>come push<strong>in</strong>g back <strong>in</strong>come from<br />
tapp<strong>in</strong>g by a significant marg<strong>in</strong> <strong>of</strong> 15.2 percentage. The average <strong>in</strong>come <strong>of</strong> sample<br />
households from all sources is Rs. 18,388.00 limit<strong>in</strong>g <strong>the</strong> percapita <strong>in</strong>come to Rs.<br />
3,875.00.<br />
2.1.8 Consumption Pattern<br />
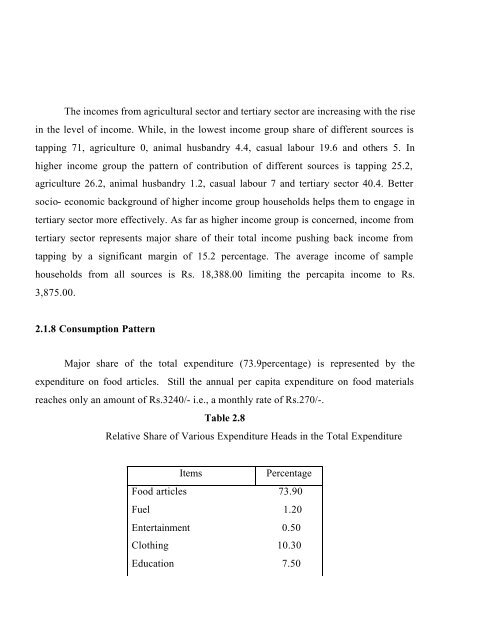
Major share <strong>of</strong> <strong>the</strong> total expenditure (73.9percentage) is represented by <strong>the</strong><br />
expenditure on food articles. Still <strong>the</strong> annual per capita expenditure on food materials<br />
reaches only an amount <strong>of</strong> Rs.3240/- i.e., a monthly rate <strong>of</strong> Rs.270/-.<br />
Table 2.8<br />
Relative Share <strong>of</strong> Various Expenditure Heads <strong>in</strong> <strong>the</strong> Total Expenditure<br />
Items Percentage<br />
Food articles 73.90<br />
Fuel 1.20<br />
Enterta<strong>in</strong>ment 0.50<br />
Cloth<strong>in</strong>g 10.30<br />
Education 7.50