Report on the State of Food Insecurity in Urban India, 2010 - M. S. ...
Report on the State of Food Insecurity in Urban India, 2010 - M. S. ...
Report on the State of Food Insecurity in Urban India, 2010 - M. S. ...
You also want an ePaper? Increase the reach of your titles
YUMPU automatically turns print PDFs into web optimized ePapers that Google loves.
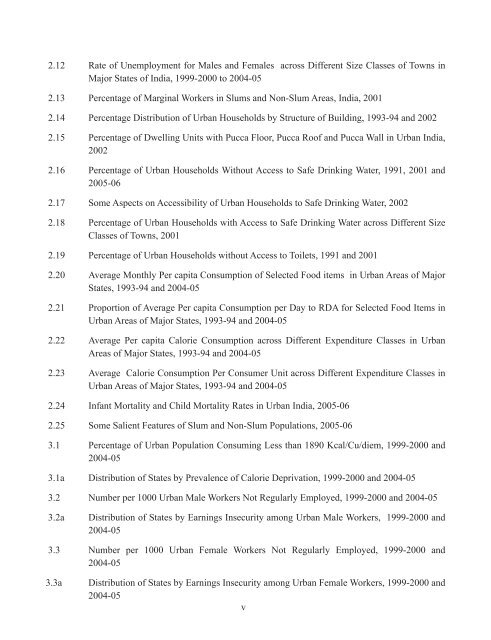
2.12 Rate <strong>of</strong> Unemployment for Males and Females across Different Size Classes <strong>of</strong> Towns <strong>in</strong><br />
Major <strong>State</strong>s <strong>of</strong> <strong>India</strong>, 1999-2000 to 2004-05<br />
2.13 Percentage <strong>of</strong> Marg<strong>in</strong>al Workers <strong>in</strong> Slums and N<strong>on</strong>-Slum Areas, <strong>India</strong>, 2001<br />
2.14 Percentage Distributi<strong>on</strong> <strong>of</strong> <strong>Urban</strong> Households by Structure <strong>of</strong> Build<strong>in</strong>g, 1993-94 and 2002<br />
2.15 Percentage <strong>of</strong> Dwell<strong>in</strong>g Units with Pucca Floor, Pucca Ro<strong>of</strong> and Pucca Wall <strong>in</strong> <strong>Urban</strong> <strong>India</strong>,<br />
2002<br />
2.16 Percentage <strong>of</strong> <strong>Urban</strong> Households Without Access to Safe Dr<strong>in</strong>k<strong>in</strong>g Water, 1991, 2001 and<br />
2005-06<br />
2.17 Some Aspects <strong>on</strong> Accessibility <strong>of</strong> <strong>Urban</strong> Households to Safe Dr<strong>in</strong>k<strong>in</strong>g Water, 2002<br />
2.18 Percentage <strong>of</strong> <strong>Urban</strong> Households with Access to Safe Dr<strong>in</strong>k<strong>in</strong>g Water across Different Size<br />
Classes <strong>of</strong> Towns, 2001<br />
2.19 Percentage <strong>of</strong> <strong>Urban</strong> Households without Access to Toilets, 1991 and 2001<br />
2.20 Average M<strong>on</strong>thly Per capita C<strong>on</strong>sumpti<strong>on</strong> <strong>of</strong> Selected <strong>Food</strong> items <strong>in</strong> <strong>Urban</strong> Areas <strong>of</strong> Major<br />
<strong>State</strong>s, 1993-94 and 2004-05<br />
2.21 Proporti<strong>on</strong> <strong>of</strong> Average Per capita C<strong>on</strong>sumpti<strong>on</strong> per Day to RDA for Selected <strong>Food</strong> Items <strong>in</strong><br />
<strong>Urban</strong> Areas <strong>of</strong> Major <strong>State</strong>s, 1993-94 and 2004-05<br />
2.22 Average Per capita Calorie C<strong>on</strong>sumpti<strong>on</strong> across Different Expenditure Classes <strong>in</strong> <strong>Urban</strong><br />
Areas <strong>of</strong> Major <strong>State</strong>s, 1993-94 and 2004-05<br />
2.23 Average Calorie C<strong>on</strong>sumpti<strong>on</strong> Per C<strong>on</strong>sumer Unit across Different Expenditure Classes <strong>in</strong><br />
<strong>Urban</strong> Areas <strong>of</strong> Major <strong>State</strong>s, 1993-94 and 2004-05<br />
2.24 Infant Mortality and Child Mortality Rates <strong>in</strong> <strong>Urban</strong> <strong>India</strong>, 2005-06<br />
2.25 Some Salient Features <strong>of</strong> Slum and N<strong>on</strong>-Slum Populati<strong>on</strong>s, 2005-06<br />
3.1 Percentage <strong>of</strong> <strong>Urban</strong> Populati<strong>on</strong> C<strong>on</strong>sum<strong>in</strong>g Less than 1890 Kcal/Cu/diem, 1999-2000 and<br />
2004-05<br />
3.1a Distributi<strong>on</strong> <strong>of</strong> <strong>State</strong>s by Prevalence <strong>of</strong> Calorie Deprivati<strong>on</strong>, 1999-2000 and 2004-05<br />
3.2 Number per 1000 <strong>Urban</strong> Male Workers Not Regularly Employed, 1999-2000 and 2004-05<br />
3.2a Distributi<strong>on</strong> <strong>of</strong> <strong>State</strong>s by Earn<strong>in</strong>gs <strong>Insecurity</strong> am<strong>on</strong>g <strong>Urban</strong> Male Workers, 1999-2000 and<br />
2004-05<br />
3.3 Number per 1000 <strong>Urban</strong> Female Workers Not Regularly Employed, 1999-2000 and<br />
2004-05<br />
3.3a Distributi<strong>on</strong> <strong>of</strong> <strong>State</strong>s by Earn<strong>in</strong>gs <strong>Insecurity</strong> am<strong>on</strong>g <strong>Urban</strong> Female Workers, 1999-2000 and<br />
2004-05<br />
v


