Report on the State of Food Insecurity in Urban India, 2010 - M. S. ...
Report on the State of Food Insecurity in Urban India, 2010 - M. S. ...
Report on the State of Food Insecurity in Urban India, 2010 - M. S. ...

You also want an ePaper? Increase the reach of your titles
YUMPU automatically turns print PDFs into web optimized ePapers that Google loves.
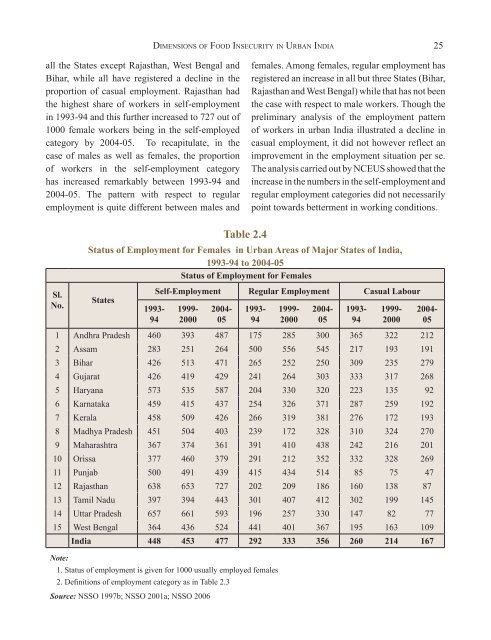
all <strong>the</strong> <strong>State</strong>s except Rajasthan, West Bengal and<br />
Bihar, while all have registered a decl<strong>in</strong>e <strong>in</strong> <strong>the</strong><br />
proporti<strong>on</strong> <strong>of</strong> casual employment. Rajasthan had<br />
<strong>the</strong> highest share <strong>of</strong> workers <strong>in</strong> self-employment<br />
<strong>in</strong> 1993-94 and this fur<strong>the</strong>r <strong>in</strong>creased to 727 out <strong>of</strong><br />
1000 female workers be<strong>in</strong>g <strong>in</strong> <strong>the</strong> self-employed<br />
category by 2004-05. To recapitulate, <strong>in</strong> <strong>the</strong><br />
case <strong>of</strong> males as well as females, <strong>the</strong> proporti<strong>on</strong><br />
<strong>of</strong> workers <strong>in</strong> <strong>the</strong> self-employment category<br />
has <strong>in</strong>creased remarkably between 1993-94 and<br />
2004-05. The pattern with respect to regular<br />
employment is quite different between males and<br />
Sl.<br />
No.<br />
DIMENSIONS OF FOOD INSECURITY IN URBAN INDIA 25<br />
Table 2.4<br />
females. Am<strong>on</strong>g females, regular employment has<br />
registered an <strong>in</strong>crease <strong>in</strong> all but three <strong>State</strong>s (Bihar,<br />
Rajasthan and West Bengal) while that has not been<br />
<strong>the</strong> case with respect to male workers. Though <strong>the</strong><br />
prelim<strong>in</strong>ary analysis <strong>of</strong> <strong>the</strong> employment pattern<br />
<strong>of</strong> workers <strong>in</strong> urban <strong>India</strong> illustrated a decl<strong>in</strong>e <strong>in</strong><br />
casual employment, it did not however reflect an<br />
improvement <strong>in</strong> <strong>the</strong> employment situati<strong>on</strong> per se.<br />
The analysis carried out by NCEUS showed that <strong>the</strong><br />
<strong>in</strong>crease <strong>in</strong> <strong>the</strong> numbers <strong>in</strong> <strong>the</strong> self-employment and<br />
regular employment categories did not necessarily<br />
po<strong>in</strong>t towards betterment <strong>in</strong> work<strong>in</strong>g c<strong>on</strong>diti<strong>on</strong>s.<br />
Status <strong>of</strong> Employment for Females <strong>in</strong> <strong>Urban</strong> Areas <strong>of</strong> Major <strong>State</strong>s <strong>of</strong> <strong>India</strong>,<br />
1993-94 to 2004-05<br />
Status <strong>of</strong> Employment for Females<br />
<strong>State</strong>s<br />
1993-<br />
94<br />
Self-Employment Regular Employment Casual Labour<br />
1999-<br />
2000<br />
2004-<br />
05<br />
1993-<br />
94<br />
1999-<br />
2000<br />
2004-<br />
05<br />
1993-<br />
94<br />
1999-<br />
2000<br />
1 Andhra Pradesh 460 393 487 175 285 300 365 322 212<br />
2 Assam 283 251 264 500 556 545 217 193 191<br />
3 Bihar 426 513 471 265 252 250 309 235 279<br />
4 Gujarat 426 419 429 241 264 303 333 317 268<br />
5 Haryana 573 535 587 204 330 320 223 135 92<br />
6 Karnataka 459 415 437 254 326 371 287 259 192<br />
7 Kerala 458 509 426 266 319 381 276 172 193<br />
8 Madhya Pradesh 451 504 403 239 172 328 310 324 270<br />
9 Maharashtra 367 374 361 391 410 438 242 216 201<br />
10 Orissa 377 460 379 291 212 352 332 328 269<br />
11 Punjab 500 491 439 415 434 514 85 75 47<br />
12 Rajasthan 638 653 727 202 209 186 160 138 87<br />
13 Tamil Nadu 397 394 443 301 407 412 302 199 145<br />
14 Uttar Pradesh 657 661 593 196 257 330 147 82 77<br />
15 West Bengal 364 436 524 441 401 367 195 163 109<br />
<strong>India</strong> 448 453 477 292 333 356 260 214 167<br />
Note:<br />
1. Status <strong>of</strong> employment is given for 1000 usually employed females<br />
2. Def<strong>in</strong>iti<strong>on</strong>s <strong>of</strong> employment category as <strong>in</strong> Table 2.3<br />
Source: NSSO 1997b; NSSO 2001a; NSSO 2006<br />
2004-<br />
05