Report on the State of Food Insecurity in Urban India, 2010 - M. S. ...
Report on the State of Food Insecurity in Urban India, 2010 - M. S. ...
Report on the State of Food Insecurity in Urban India, 2010 - M. S. ...

Create successful ePaper yourself
Turn your PDF publications into a flip-book with our unique Google optimized e-Paper software.
INTRODUCTION AND OVERVIEW 9<br />
Populati<strong>on</strong><br />
Segments<br />
Worker Status<br />
1983 to 1993-94<br />
Agriculture N<strong>on</strong>-Agriculture<br />
1993-94 to 2004-05<br />
Agriculture N<strong>on</strong>-Agriculture<br />
Rural male Regular 4.6<br />
4.4<br />
4.1<br />
2.6<br />
Casual 3.6<br />
4.0<br />
2.2<br />
2.4<br />
Rural female<br />
Regular 2.5<br />
3.5<br />
3.4<br />
3.1<br />
Casual 3.6<br />
4.1<br />
2.2<br />
3.8<br />
<strong>Urban</strong> male<br />
Regular 4.5<br />
3.1<br />
0.2<br />
2.0<br />
Casual 2.1<br />
2.3<br />
0.9<br />
1.2<br />
<strong>Urban</strong> female<br />
Regular 5.0<br />
4.0<br />
0.2<br />
1.9<br />
Casual 3.1<br />
3.6<br />
0.5<br />
1.6<br />
Growth rate <strong>in</strong> GDP 2.8 6.1 2.5 7.5<br />
Source: NCEUS 2009<br />
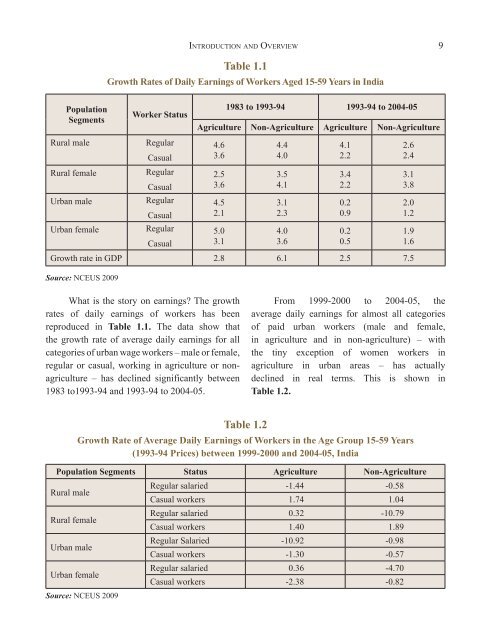
What is <strong>the</strong> story <strong>on</strong> earn<strong>in</strong>gs? The growth<br />
rates <strong>of</strong> daily earn<strong>in</strong>gs <strong>of</strong> workers has been<br />
reproduced <strong>in</strong> Table 1.1. The data show that<br />
<strong>the</strong> growth rate <strong>of</strong> average daily earn<strong>in</strong>gs for all<br />
categories <strong>of</strong> urban wage workers – male or female,<br />
regular or casual, work<strong>in</strong>g <strong>in</strong> agriculture or n<strong>on</strong>agriculture<br />
– has decl<strong>in</strong>ed significantly between<br />
1983 to1993-94 and 1993-94 to 2004-05.<br />
From 1999-2000 to 2004-05, <strong>the</strong><br />
average daily earn<strong>in</strong>gs for almost all categories<br />
<strong>of</strong> paid urban workers (male and female,<br />
<strong>in</strong> agriculture and <strong>in</strong> n<strong>on</strong>-agriculture) – with<br />
<strong>the</strong> t<strong>in</strong>y excepti<strong>on</strong> <strong>of</strong> women workers <strong>in</strong><br />
agriculture <strong>in</strong> urban areas – has actually<br />
decl<strong>in</strong>ed <strong>in</strong> real terms. This is shown <strong>in</strong><br />
Table 1.2.<br />
Table 1.2<br />
Growth Rate <strong>of</strong> Average Daily Earn<strong>in</strong>gs <strong>of</strong> Workers <strong>in</strong> <strong>the</strong> Age Group 15-59 Years<br />
(1993-94 Prices) between 1999-2000 and 2004-05, <strong>India</strong><br />
Populati<strong>on</strong> Segments Status Agriculture N<strong>on</strong>-Agriculture<br />
Rural male<br />
Rural female<br />
<strong>Urban</strong> male<br />
<strong>Urban</strong> female<br />
Source: NCEUS 2009<br />
Table 1.1<br />
Growth Rates <strong>of</strong> Daily Earn<strong>in</strong>gs <strong>of</strong> Workers Aged 15-59 Years <strong>in</strong> <strong>India</strong><br />
Regular salaried -1.44 -0.58<br />
Casual workers 1.74 1.04<br />
Regular salaried 0.32 -10.79<br />
Casual workers 1.40 1.89<br />
Regular Salaried -10.92 -0.98<br />
Casual workers -1.30 -0.57<br />
Regular salaried 0.36 -4.70<br />
Casual workers -2.38 -0.82