Report on the State of Food Insecurity in Urban India, 2010 - M. S. ...
Report on the State of Food Insecurity in Urban India, 2010 - M. S. ...
Report on the State of Food Insecurity in Urban India, 2010 - M. S. ...

Create successful ePaper yourself
Turn your PDF publications into a flip-book with our unique Google optimized e-Paper software.
REPORT ON THE STATE OF<br />
FOOD INSECURITY<br />
IN URBAN INDIA<br />
M S Swam<strong>in</strong>athan Research Foundati<strong>on</strong><br />
Centre for Research <strong>on</strong> Susta<strong>in</strong>able<br />
Agriculture and Rural Development<br />
World <strong>Food</strong> Programme<br />
The <strong>Food</strong> Aid Organizati<strong>on</strong><br />
<strong>of</strong> <strong>the</strong> United Nati<strong>on</strong>s
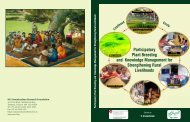
Fr<strong>on</strong>t cover : Mid-Day Meal Scheme <strong>in</strong> acti<strong>on</strong><br />
Back cover : Sharp c<strong>on</strong>trasts <strong>in</strong> liv<strong>in</strong>g c<strong>on</strong>diti<strong>on</strong>s <strong>in</strong> <strong>the</strong> face <strong>of</strong> urban development
REPORT ON THE STATE OF<br />
FOOD INSECURITY<br />
IN URBAN INDIA<br />
Research Team<br />
V. B. Athreya<br />
R. Rukmani<br />
R. V. Bhavani<br />
G. Anuradha<br />
R. Gop<strong>in</strong>ath<br />
A. Sakthi Velan<br />
(Secretarial Assistance)<br />
September <strong>2010</strong>
© M. S. Swam<strong>in</strong>athan Research Foundati<strong>on</strong><br />
All rights reserved. No part <strong>of</strong> this publicati<strong>on</strong><br />
may be reproduced or transmitted, <strong>in</strong> any form<br />
or by any means, without permissi<strong>on</strong>.<br />
ISBN: 978-81-88355-21-1<br />
First Impressi<strong>on</strong> : September <strong>2010</strong><br />
Pr<strong>in</strong>ted by<br />
Nagaraj and Company Private Limited<br />
Plot No.156, Developed Plots Industrial Estate,<br />
Perungudi,<br />
Chennai - 600 096.<br />
Cover design by<br />
Nagaraj and Company Private Limited<br />
ACKNOWLEDGEMENTS<br />
The follow<strong>in</strong>g perta<strong>in</strong>s to all maps <strong>in</strong> this report:<br />
© Government <strong>of</strong> <strong>India</strong>, Copyright <strong>2010</strong>.<br />
The resp<strong>on</strong>sibility for <strong>the</strong> correctness <strong>of</strong> <strong>in</strong>ternal details rests with <strong>the</strong> publisher.<br />
The territorial waters <strong>of</strong> <strong>India</strong> extend <strong>in</strong>to <strong>the</strong> sea to a distance <strong>of</strong> twelve nautical miles measured from <strong>the</strong> appropriate base l<strong>in</strong>e.<br />
The adm<strong>in</strong>istrative headquaters <strong>of</strong> Chandigarh, Haryana and Punjab are at Chandigarh.<br />
The <strong>in</strong>ter-state boundaries am<strong>on</strong>g Arunachal Pradesh, Assam and Meghalaya shown <strong>on</strong> this map are as <strong>in</strong>terpreted from <strong>the</strong> North-Eastern<br />
Areas (Reorganisati<strong>on</strong>) Act 1971, but have yet to be verified.<br />
The external boundaries and coastl<strong>in</strong>es <strong>of</strong> <strong>India</strong> agree with <strong>the</strong> Record/Master Copy certified by Survey <strong>of</strong> <strong>India</strong>.<br />
The <strong>State</strong> boundaries between Uttarakhand & Uttar Pradesh, Bihar & Jharkhand and Chhattisgarh & Madhya Pradesh have not been<br />
verified by <strong>the</strong> governments c<strong>on</strong>cerned.<br />
The spell<strong>in</strong>gs <strong>of</strong> names <strong>in</strong> this map have been taken from various sources.<br />
MSSRF/RR/10/27<br />
WFP Disclaimer<br />
The boundaries and names shown and <strong>the</strong> designati<strong>on</strong>s used <strong>on</strong> <strong>the</strong> maps <strong>in</strong> this book do not imply <strong>of</strong>ficial endorsement or acceptance<br />
by <strong>the</strong> UN.
C<strong>on</strong>tents<br />
List <strong>of</strong> Acr<strong>on</strong>yms i<br />
List <strong>of</strong> Tables iv<br />
List <strong>of</strong> Boxes viii<br />
List <strong>of</strong> Maps viii<br />
Foreword xi<br />
Executive Summary xiii<br />
Introducti<strong>on</strong> and Overview 1<br />
Dimensi<strong>on</strong>s <strong>of</strong> <strong>Food</strong> <strong>Insecurity</strong> <strong>in</strong> <strong>Urban</strong> <strong>India</strong> 19<br />
<strong>Urban</strong> <strong>Food</strong> <strong>Insecurity</strong> Across <strong>State</strong>s 53<br />
Public <strong>Food</strong> Delivery Systems <strong>in</strong> <strong>Urban</strong> <strong>India</strong> 91<br />
C<strong>on</strong>clusi<strong>on</strong>s and Policy Recommendati<strong>on</strong>s 113<br />
Annexure 123<br />
References 125<br />
Participants at <strong>the</strong> C<strong>on</strong>sultati<strong>on</strong> 131<br />
Acknowledgements 133
AAY Antyodaya Anna Yojana<br />
List <strong>of</strong> Acr<strong>on</strong>yms<br />
AIE Alternative and Innovative Educati<strong>on</strong><br />
BPL Below Poverty L<strong>in</strong>e<br />
BSUP Basic Services for <strong>Urban</strong> Poor<br />
CAG Comptroller and Auditor General <strong>of</strong> <strong>India</strong><br />
CDS Current Daily Status<br />
CED Chr<strong>on</strong>ic Energy Deficiency<br />
CIP Central Issue Price<br />
CMR Child Mortality Rate<br />
CSS Centrally Sp<strong>on</strong>sored Scheme<br />
Cu C<strong>on</strong>sumer Unit<br />
EGS Employment Guarantee Scheme<br />
ESCAP Ec<strong>on</strong>omic and Social Commissi<strong>on</strong> for Asia and <strong>the</strong> Pacific<br />
FAO <strong>Food</strong> and Agriculture Organisati<strong>on</strong><br />
FDI Foreign Direct Investment<br />
FIAUI <strong>Food</strong> <strong>Insecurity</strong> Atlas <strong>of</strong> <strong>Urban</strong> <strong>India</strong><br />
FPS Fair Price Shop<br />
GDP Gross Domestic Product<br />
GoI Government <strong>of</strong> <strong>India</strong><br />
HCR Head Count Ratio<br />
Hhs Households<br />
HRD Human Resource Development<br />
i
ICDS Integrated Child Development Services<br />
IHSDP Integrated Hous<strong>in</strong>g and Slum Development Programme<br />
IMR Infant Mortality Rate<br />
JNNURM Jawaharlal Nehru Nati<strong>on</strong>al <strong>Urban</strong> Renewal Missi<strong>on</strong><br />
Kcal Kilocalories<br />
KSY Kishori Shakti Yojana<br />
MDG Millennium Development Goal<br />
MDMS Mid-Day Meal Scheme<br />
MoHUPA M<strong>in</strong>istry <strong>of</strong> Hous<strong>in</strong>g and <strong>Urban</strong> Poverty Alleviati<strong>on</strong><br />
MPCE M<strong>on</strong>thly Per Capita Expenditure<br />
MSP M<strong>in</strong>imum Support Price<br />
MSSRF M S Swam<strong>in</strong>athan Research Foundati<strong>on</strong><br />
MT Milli<strong>on</strong> T<strong>on</strong>nes<br />
NCEUS Nati<strong>on</strong>al Commissi<strong>on</strong> for Enterprises <strong>in</strong> <strong>the</strong> Unorganised Sector<br />
NFHS Nati<strong>on</strong>al Family Health Survey<br />
NGO N<strong>on</strong>-Governmental Organisati<strong>on</strong><br />
NNMB Nati<strong>on</strong>al Nutriti<strong>on</strong> M<strong>on</strong>itor<strong>in</strong>g Board<br />
NPAG Nutriti<strong>on</strong> Programme for Adolescent Girls<br />
NREGA Nati<strong>on</strong>al Rural Employment Guarantee Act<br />
NSSO Nati<strong>on</strong>al Sample Survey Organisati<strong>on</strong><br />
NUS Nutritious Underutilised Species<br />
OBC O<strong>the</strong>r Backward Classes<br />
PDS Public Distributi<strong>on</strong> System<br />
PEO Performance Evaluati<strong>on</strong> Organisati<strong>on</strong><br />
PMGY Pradhan Mantri Gramodaya Yojana<br />
POU Prevalence <strong>of</strong> Undernutriti<strong>on</strong><br />
PPP Public Private Participati<strong>on</strong><br />
ii
PUCL People’s Uni<strong>on</strong> for Civil Liberties<br />
RDA Recommended Dietary Allowance<br />
RSFIRI <str<strong>on</strong>g>Report</str<strong>on</strong>g> <strong>on</strong> <strong>the</strong> <strong>State</strong> <strong>of</strong> <strong>Food</strong> <strong>Insecurity</strong> <strong>in</strong> Rural <strong>India</strong><br />
SC Scheduled Caste<br />
SDW Safe Dr<strong>in</strong>k<strong>in</strong>g Water<br />
SJSRY Swarna Jayanti Shahri Rozgar Yojana<br />
SOFI <strong>State</strong> <strong>of</strong> <strong>Food</strong> <strong>Insecurity</strong> <strong>in</strong> <strong>the</strong> World<br />
ST Scheduled Tribe<br />
TPDS Targeted Public Distributi<strong>on</strong> System<br />
UA <strong>Urban</strong> Agglomerati<strong>on</strong><br />
UIDSSMT <strong>Urban</strong> Infrastructure Development Scheme for Small and Medium Towns<br />
UN United Nati<strong>on</strong>s<br />
UNDP United Nati<strong>on</strong>s Development Programme<br />
UNICEF United Nati<strong>on</strong>s Internati<strong>on</strong>al Children Emergency Fund<br />
UNWFP United Nati<strong>on</strong>s World <strong>Food</strong> Programme<br />
URGD <strong>Urban</strong> Rural Growth Differential<br />
WHO World Health Organisati<strong>on</strong><br />
WPR Work Participati<strong>on</strong> Rate<br />
iii
List <strong>of</strong> Tables<br />
1.1 Growth Rates <strong>of</strong> Daily Earn<strong>in</strong>gs <strong>of</strong> Workers Aged 15-59 Years <strong>in</strong> <strong>India</strong><br />
1.2 Growth Rate <strong>of</strong> Average Daily Earn<strong>in</strong>gs <strong>of</strong> Workers <strong>in</strong> <strong>the</strong> Age Group 15-59 Years (1993-94<br />
Prices) between 1999-2000 and 2004-05, <strong>India</strong><br />
1.3 Annual Rate <strong>of</strong> Growth <strong>of</strong> Total Employment <strong>in</strong> <strong>India</strong> (per cent)<br />
1.4 Unemployment Rates by Current Daily Status <strong>in</strong> <strong>India</strong> (per cent)<br />
1.5 <strong>Urban</strong> Amenties <strong>in</strong> <strong>India</strong>, 2001<br />
2.1 Salient Features <strong>of</strong> <strong>Urban</strong>isati<strong>on</strong> across <strong>the</strong> <strong>State</strong>s, 1991 and 2001<br />
2.2 Work Participati<strong>on</strong> Rate (WPR) for Males and Females <strong>in</strong> <strong>Urban</strong> Areas <strong>of</strong> Major <strong>State</strong>s <strong>of</strong><br />
<strong>India</strong>, 1993-94 to 2004-05<br />
2.3 Status <strong>of</strong> Employment <strong>of</strong> Males <strong>in</strong> <strong>Urban</strong> Areas <strong>of</strong> Major <strong>State</strong>s <strong>of</strong> <strong>India</strong>, 1993-94 to<br />
2004-05<br />
2.4 Status <strong>of</strong> Employment for Females <strong>in</strong> <strong>Urban</strong> Areas <strong>of</strong> Major <strong>State</strong>s <strong>of</strong> <strong>India</strong>, 1993-94 to<br />
2004-05<br />
2.5 Size and Distributi<strong>on</strong> <strong>of</strong> <strong>the</strong> Organised and Unorganised Workers <strong>in</strong> N<strong>on</strong>-Agriculture, All<br />
<strong>India</strong>, 2004-05<br />
2.6 Poverty Ratios am<strong>on</strong>g N<strong>on</strong>-Agricultural Workers by Category <strong>of</strong> Workers <strong>in</strong> <strong>India</strong>, 2004-05<br />
(<strong>in</strong> percentage)<br />
2.7 Percentage <strong>of</strong> Marg<strong>in</strong>al Workers am<strong>on</strong>g Males and Females <strong>in</strong> <strong>Urban</strong> Areas <strong>of</strong> Major <strong>State</strong>s<br />
<strong>of</strong> <strong>India</strong>,1991 and 2001<br />
2.8 Rate <strong>of</strong> Unemployment for Males <strong>in</strong> <strong>Urban</strong> Areas <strong>of</strong> Major <strong>State</strong>s <strong>of</strong> <strong>India</strong>, 1993-94 to<br />
2004-05<br />
2.9 Rate <strong>of</strong> Unemployment for Females <strong>in</strong> <strong>Urban</strong> Areas <strong>of</strong> Major <strong>State</strong>s <strong>of</strong> <strong>India</strong>, 1993-94 to<br />
2004-05<br />
2.10 Status <strong>of</strong> Employment <strong>of</strong> Males across Different Size Classes <strong>of</strong> Towns, 1999-2000 to<br />
2004-05<br />
2.11 Status <strong>of</strong> Employment <strong>of</strong> Females across Different Size Classes <strong>of</strong> Towns, 1999-2000 to<br />
2004-05<br />
iv
2.12 Rate <strong>of</strong> Unemployment for Males and Females across Different Size Classes <strong>of</strong> Towns <strong>in</strong><br />
Major <strong>State</strong>s <strong>of</strong> <strong>India</strong>, 1999-2000 to 2004-05<br />
2.13 Percentage <strong>of</strong> Marg<strong>in</strong>al Workers <strong>in</strong> Slums and N<strong>on</strong>-Slum Areas, <strong>India</strong>, 2001<br />
2.14 Percentage Distributi<strong>on</strong> <strong>of</strong> <strong>Urban</strong> Households by Structure <strong>of</strong> Build<strong>in</strong>g, 1993-94 and 2002<br />
2.15 Percentage <strong>of</strong> Dwell<strong>in</strong>g Units with Pucca Floor, Pucca Ro<strong>of</strong> and Pucca Wall <strong>in</strong> <strong>Urban</strong> <strong>India</strong>,<br />
2002<br />
2.16 Percentage <strong>of</strong> <strong>Urban</strong> Households Without Access to Safe Dr<strong>in</strong>k<strong>in</strong>g Water, 1991, 2001 and<br />
2005-06<br />
2.17 Some Aspects <strong>on</strong> Accessibility <strong>of</strong> <strong>Urban</strong> Households to Safe Dr<strong>in</strong>k<strong>in</strong>g Water, 2002<br />
2.18 Percentage <strong>of</strong> <strong>Urban</strong> Households with Access to Safe Dr<strong>in</strong>k<strong>in</strong>g Water across Different Size<br />
Classes <strong>of</strong> Towns, 2001<br />
2.19 Percentage <strong>of</strong> <strong>Urban</strong> Households without Access to Toilets, 1991 and 2001<br />
2.20 Average M<strong>on</strong>thly Per capita C<strong>on</strong>sumpti<strong>on</strong> <strong>of</strong> Selected <strong>Food</strong> items <strong>in</strong> <strong>Urban</strong> Areas <strong>of</strong> Major<br />
<strong>State</strong>s, 1993-94 and 2004-05<br />
2.21 Proporti<strong>on</strong> <strong>of</strong> Average Per capita C<strong>on</strong>sumpti<strong>on</strong> per Day to RDA for Selected <strong>Food</strong> Items <strong>in</strong><br />
<strong>Urban</strong> Areas <strong>of</strong> Major <strong>State</strong>s, 1993-94 and 2004-05<br />
2.22 Average Per capita Calorie C<strong>on</strong>sumpti<strong>on</strong> across Different Expenditure Classes <strong>in</strong> <strong>Urban</strong><br />
Areas <strong>of</strong> Major <strong>State</strong>s, 1993-94 and 2004-05<br />
2.23 Average Calorie C<strong>on</strong>sumpti<strong>on</strong> Per C<strong>on</strong>sumer Unit across Different Expenditure Classes <strong>in</strong><br />
<strong>Urban</strong> Areas <strong>of</strong> Major <strong>State</strong>s, 1993-94 and 2004-05<br />
2.24 Infant Mortality and Child Mortality Rates <strong>in</strong> <strong>Urban</strong> <strong>India</strong>, 2005-06<br />
2.25 Some Salient Features <strong>of</strong> Slum and N<strong>on</strong>-Slum Populati<strong>on</strong>s, 2005-06<br />
3.1 Percentage <strong>of</strong> <strong>Urban</strong> Populati<strong>on</strong> C<strong>on</strong>sum<strong>in</strong>g Less than 1890 Kcal/Cu/diem, 1999-2000 and<br />
2004-05<br />
3.1a Distributi<strong>on</strong> <strong>of</strong> <strong>State</strong>s by Prevalence <strong>of</strong> Calorie Deprivati<strong>on</strong>, 1999-2000 and 2004-05<br />
3.2 Number per 1000 <strong>Urban</strong> Male Workers Not Regularly Employed, 1999-2000 and 2004-05<br />
3.2a Distributi<strong>on</strong> <strong>of</strong> <strong>State</strong>s by Earn<strong>in</strong>gs <strong>Insecurity</strong> am<strong>on</strong>g <strong>Urban</strong> Male Workers, 1999-2000 and<br />
2004-05<br />
3.3 Number per 1000 <strong>Urban</strong> Female Workers Not Regularly Employed, 1999-2000 and<br />
2004-05<br />
3.3a Distributi<strong>on</strong> <strong>of</strong> <strong>State</strong>s by Earn<strong>in</strong>gs <strong>Insecurity</strong> am<strong>on</strong>g <strong>Urban</strong> Female Workers, 1999-2000 and<br />
2004-05<br />
v
3.4 Percentage <strong>of</strong> <strong>Urban</strong> Households without Access to Safe Dr<strong>in</strong>k<strong>in</strong>g Water, 1998-99 and<br />
2005-06<br />
3.4a <strong>State</strong>s by Level <strong>of</strong> <strong>Insecurity</strong> with regard to Access to Safe Dr<strong>in</strong>k<strong>in</strong>g Water, 1998-99 and<br />
2005-06<br />
3.5 Percentage <strong>of</strong> <strong>Urban</strong> Households without Access to Toilet Facilities, 1998-99 and 2005-06<br />
3.5a <strong>State</strong>s by Level <strong>of</strong> <strong>Insecurity</strong> with regard to Access to Toilets, 1998-99 and 2005-06<br />
3.6 Percentage <strong>of</strong> <strong>Urban</strong> Women (15-49 years) with Anaemia, 1998-99 and 2005-06<br />
3.6a Distributi<strong>on</strong> <strong>of</strong> <strong>State</strong>s by Level <strong>of</strong> <strong>Insecurity</strong> <strong>in</strong> terms <strong>of</strong> Incidence <strong>of</strong> Women with Anaemia,<br />
1998-99 and 2005-06<br />
3.7 Percentage <strong>of</strong> <strong>Urban</strong> Women (15-49 years) with Chr<strong>on</strong>ic Energy Deficiency, 1998-99 and<br />
2005-06<br />
3.7a <strong>State</strong>s by Level <strong>of</strong> <strong>Insecurity</strong> <strong>in</strong> terms <strong>of</strong> CED am<strong>on</strong>g <strong>Urban</strong> Women, 1998-99 and 2005-06<br />
3.8 Percentage <strong>of</strong> <strong>Urban</strong> Children (6-35 m<strong>on</strong>ths) with Anaemia, 1998-99 and 2005-06<br />
3.8a Distributi<strong>on</strong> <strong>of</strong> <strong>State</strong>s by Category <strong>of</strong> <strong>Insecurity</strong> <strong>in</strong> terms <strong>of</strong> Children with Anaemia, 1998-99<br />
and 2005-06<br />
3.9 Percentage <strong>of</strong> <strong>Urban</strong> Children (6-35 m<strong>on</strong>ths) who are Stunted, 1998-99 and 2005-06<br />
3.9a Distributi<strong>on</strong> <strong>of</strong> <strong>State</strong>s by Category <strong>of</strong> <strong>Insecurity</strong> with respect to <strong>the</strong> Incidence <strong>of</strong> Stunt<strong>in</strong>g<br />
am<strong>on</strong>g <strong>Urban</strong> Children, 1998-99 and 2005-06<br />
3.10 Percentage <strong>of</strong> <strong>Urban</strong> Children (6-35 m<strong>on</strong>ths) Underweight for Age, 1998-99 and 2005-06<br />
3.10a Distributi<strong>on</strong> <strong>of</strong> <strong>State</strong>s by Category <strong>of</strong> <strong>Insecurity</strong> with respect to <strong>Urban</strong> Children Underweight,<br />
1998-99 and 2005-06<br />
3.11 Percentage <strong>of</strong> <strong>Urban</strong> Children (6-35 m<strong>on</strong>ths) Wast<strong>in</strong>g, 1998-99 and 2005-06<br />
3.11a Distributi<strong>on</strong> <strong>of</strong> <strong>State</strong>s by Category <strong>of</strong> <strong>Insecurity</strong> with respect to Wast<strong>in</strong>g am<strong>on</strong>g <strong>Urban</strong><br />
Children, 1998-99 and 2005-06<br />
3.12 Composite Index <strong>of</strong> <strong>Urban</strong> <strong>Food</strong> <strong>Insecurity</strong>, Variant 1 (V1), 1998-2000 and 2004-06<br />
3.12a Distributi<strong>on</strong> <strong>of</strong> <strong>State</strong>s by Category <strong>of</strong> <strong>Food</strong> <strong>Insecurity</strong> (V1), 1998-2000 and 2004-06<br />
3.13 Composite Index <strong>of</strong> <strong>Urban</strong> <strong>Food</strong> <strong>Insecurity</strong>, Variant 2 (V2), 1998-2000 and 2004-06<br />
3.13a Distributi<strong>on</strong> <strong>of</strong> <strong>State</strong>s by Category <strong>of</strong> <strong>Food</strong> <strong>Insecurity</strong> (V2), 1998-2000 and 2004-06<br />
3.14 Composite Index <strong>of</strong> <strong>Urban</strong> <strong>Food</strong> <strong>Insecurity</strong>, Variant 3 (V3), 1998-2000 and 2004-06<br />
vi
3.14a Distributi<strong>on</strong> <strong>of</strong> <strong>State</strong>s by Category <strong>of</strong> <strong>Food</strong> <strong>Insecurity</strong> (V3), 1998-2000 and 2004-06<br />
3.15 Composite Index <strong>of</strong> <strong>Urban</strong> <strong>Food</strong> <strong>Insecurity</strong>, Variant 4 (V4), 1998-2000 and 2004-06<br />
3.15a Distributi<strong>on</strong> <strong>of</strong> <strong>State</strong>s by Category <strong>of</strong> <strong>Food</strong> <strong>Insecurity</strong> (V4), 1998-2000 and 2004-06<br />
3.16 Composite Index <strong>of</strong> <strong>Urban</strong> <strong>Food</strong> <strong>Insecurity</strong>, Variant 5 (V5), 1998-2000 and 2004-06<br />
3.16a Distributi<strong>on</strong> <strong>of</strong> <strong>State</strong>s by Category <strong>of</strong> <strong>Food</strong> <strong>Insecurity</strong> (V5), 1998-2000 and 2004-06<br />
3.17 Composite Index <strong>of</strong> <strong>Urban</strong> <strong>Food</strong> <strong>Insecurity</strong>, Variant 6 (V6), 1998-2000 and 2004-06<br />
3.17a Distributi<strong>on</strong> <strong>of</strong> <strong>State</strong>s by Category <strong>of</strong> <strong>Food</strong> <strong>Insecurity</strong> (V6), 1998-2000 and 2004-06<br />
3.18 Values <strong>of</strong> <strong>the</strong> Composite <strong>Urban</strong> <strong>Food</strong> <strong>Insecurity</strong> Index Variants for <strong>India</strong>, 1998-2000 and<br />
2004-06<br />
3.19 Comparis<strong>on</strong> <strong>of</strong> <strong>State</strong>s <strong>in</strong> terms <strong>of</strong> Composite Index, All Variants, 1998-2000 and 2004-06<br />
4.1 Percentage <strong>of</strong> <strong>Urban</strong> Households <str<strong>on</strong>g>Report</str<strong>on</strong>g><strong>in</strong>g C<strong>on</strong>sumpti<strong>on</strong> <strong>of</strong> Rice from PDS, 2004-05<br />
4.2 Importance <strong>of</strong> PDS Rice C<strong>on</strong>sumpti<strong>on</strong> am<strong>on</strong>g <strong>Urban</strong> Households, 2004-05<br />
4.3 Percentage <strong>of</strong> <strong>Urban</strong> Households <str<strong>on</strong>g>Report</str<strong>on</strong>g><strong>in</strong>g C<strong>on</strong>sumpti<strong>on</strong> <strong>of</strong> Wheat from PDS, 2004-05<br />
4.4 Importance <strong>of</strong> PDS Wheat C<strong>on</strong>sumpti<strong>on</strong> am<strong>on</strong>g <strong>Urban</strong> Households, 2004-05<br />
4.5 Some Aspects <strong>on</strong> Possessi<strong>on</strong> <strong>of</strong> Different Types <strong>of</strong> Rati<strong>on</strong> Cards across Social Groups <strong>in</strong><br />
<strong>Urban</strong> Areas, 2004-05<br />
4.6 Some Aspects <strong>on</strong> Possessi<strong>on</strong> <strong>of</strong> Different Types <strong>of</strong> Rati<strong>on</strong> Cards across Various Household<br />
Types <strong>in</strong> <strong>Urban</strong> Areas, 2004-05<br />
4.7 Some Aspects <strong>on</strong> Possessi<strong>on</strong> <strong>of</strong> Rati<strong>on</strong> Cards am<strong>on</strong>g Bottom 30 per cent <strong>of</strong> C<strong>on</strong>sumer<br />
Expenditure Classes <strong>in</strong> <strong>Urban</strong> Areas, 2004-05<br />
4.8 Importance <strong>of</strong> MDMS for <strong>Urban</strong> Households across Different Social Groups, 2004-05<br />
4.9 Importance <strong>of</strong> MDMS for <strong>Urban</strong> Households across Different C<strong>on</strong>sumer Expenditure Classes,<br />
2004-05<br />
4.10 Revised Feed<strong>in</strong>g Norms under ICDS, 2009<br />
4.11 Importance <strong>of</strong> ICDS for <strong>Urban</strong> Households across Different Social Groups, 2004-05<br />
4.12 Importance <strong>of</strong> ICDS for <strong>Urban</strong> Households across Different C<strong>on</strong>sumer Expenditure Classes,<br />
2004-05<br />
4.13 Salient Features <strong>of</strong> ICDS <strong>in</strong> <strong>Urban</strong> Areas, 2005-06<br />
4.14 Utilisati<strong>on</strong> <strong>of</strong> ICDS Services by Mo<strong>the</strong>rs dur<strong>in</strong>g Pregnancy <strong>in</strong> <strong>Urban</strong> Areas, 2005-06<br />
vii
Box 1 Koozh <strong>in</strong> Chennai<br />
List <strong>of</strong> Boxes<br />
Box 2 Universalis<strong>in</strong>g PDS: How much does it cost anyway?<br />
List <strong>of</strong> Maps<br />
3.1a Percentage <strong>of</strong> Populati<strong>on</strong> C<strong>on</strong>sum<strong>in</strong>g less than 1890 Kcal/Cu/diem <strong>in</strong> <strong>Urban</strong> <strong>India</strong><br />
(1999-2000)<br />
3.1b Percentage <strong>of</strong> Populati<strong>on</strong> C<strong>on</strong>sum<strong>in</strong>g less than 1890 Kcal/Cu/diem <strong>in</strong> <strong>Urban</strong> <strong>India</strong> (2004-05)<br />
3.2a Number per 1000 <strong>Urban</strong> Male Workers not <strong>in</strong> Regular Employment (1999-2000)<br />
3.2b Number per 1000 <strong>Urban</strong> Male Workers not <strong>in</strong> Regular Employment (2004-05)<br />
3.3a Number per 1000 <strong>Urban</strong> Female Workers not <strong>in</strong> Regular Employment (1999-2000)<br />
3.3b Number per 1000 <strong>Urban</strong> Female Workers not <strong>in</strong> Regular Employment (2004-05)<br />
3.4a Percentage <strong>of</strong> <strong>Urban</strong> Households without Access to Safe Dr<strong>in</strong>k<strong>in</strong>g Water (1998-99)<br />
3.4b Percentage <strong>of</strong> <strong>Urban</strong> Households without Access to Safe Dr<strong>in</strong>k<strong>in</strong>g Water (2005-06)<br />
3.5a Percentage <strong>of</strong> <strong>Urban</strong> Households without Access to Toilets (1998-99)<br />
3.5b Percentage <strong>of</strong> <strong>Urban</strong> Households without Access to Toilets (2005-06)<br />
3.6a Percentage <strong>of</strong> Ever-married <strong>Urban</strong> Women with Any Anaemia (1998-99)<br />
3.6b Percentage <strong>of</strong> Ever-married <strong>Urban</strong> Women with Any Anaemia (2005-06)<br />
3.7a Percentage <strong>of</strong> Ever-married <strong>Urban</strong> Women with Chr<strong>on</strong>ic Energy Deficiency (1998-99)<br />
3.7b Percentage <strong>of</strong> Ever-married <strong>Urban</strong> Women with Chr<strong>on</strong>ic Energy Deficiency (2005-06)<br />
3.8a Percentage <strong>of</strong> <strong>Urban</strong> Children (6-35 m<strong>on</strong>ths) with Any Anaemia (1998-99)<br />
3.8b Percentage <strong>of</strong> <strong>Urban</strong> Children (6-35 m<strong>on</strong>ths) with Any Anaemia (2005-06)<br />
3.9a Percentage <strong>of</strong> Stunted Children (6-35 m<strong>on</strong>ths) <strong>in</strong> <strong>Urban</strong> <strong>India</strong> (1998-99)<br />
viii
3.9b Percentage <strong>of</strong> Stunted Children (6-35 m<strong>on</strong>ths) <strong>in</strong> <strong>Urban</strong> <strong>India</strong> (2005 06)<br />
3.10a Percentage <strong>of</strong> Children Underweight (6-35 m<strong>on</strong>ths) <strong>in</strong> <strong>Urban</strong> <strong>India</strong> (1998-99)<br />
3.10b Percentage <strong>of</strong> Children Underweight (6-35 m<strong>on</strong>ths) <strong>in</strong> <strong>Urban</strong> <strong>India</strong> (2005-06)<br />
3.11a Percentage <strong>of</strong> <strong>Urban</strong> Children Wast<strong>in</strong>g (6-35 m<strong>on</strong>ths) (1998-99)<br />
3.11b Percentage <strong>of</strong> <strong>Urban</strong> Children Wast<strong>in</strong>g (6-35 m<strong>on</strong>ths) (2005-06)<br />
3.12a Composite Index <strong>of</strong> <strong>Urban</strong> <strong>Food</strong> <strong>Insecurity</strong> (Variant 1) (1998-2000)<br />
3.12b Composite Index <strong>of</strong> <strong>Urban</strong> <strong>Food</strong> <strong>Insecurity</strong> (Variant 1) (2004-06)<br />
3.13a Composite Index <strong>of</strong> <strong>Urban</strong> <strong>Food</strong> <strong>Insecurity</strong> (Variant 2) (1998-2000)<br />
3.13b Composite Index <strong>of</strong> <strong>Urban</strong> <strong>Food</strong> <strong>Insecurity</strong> (Variant 2) (2004-06)<br />
3.14a Composite Index <strong>of</strong> <strong>Urban</strong> <strong>Food</strong> <strong>Insecurity</strong> (Variant 3) (1998-2000)<br />
3.14b Composite Index <strong>of</strong> <strong>Urban</strong> <strong>Food</strong> <strong>Insecurity</strong> (Variant 3) (2004-06)<br />
3.15a Composite Index <strong>of</strong> <strong>Urban</strong> <strong>Food</strong> <strong>Insecurity</strong> (Variant 4) (1998-2000)<br />
3.15b Composite Index <strong>of</strong> <strong>Urban</strong> <strong>Food</strong> <strong>Insecurity</strong> (Variant 4) (2004-06)<br />
3.16a Composite Index <strong>of</strong> <strong>Urban</strong> <strong>Food</strong> <strong>Insecurity</strong> (Variant 5) (1998-2000)<br />
3.16b Composite Index <strong>of</strong> <strong>Urban</strong> <strong>Food</strong> <strong>Insecurity</strong> (Variant 5) (2004-06)<br />
3.17a Composite Index <strong>of</strong> <strong>Urban</strong> <strong>Food</strong> <strong>Insecurity</strong> (Variant 6) (1998-2000)<br />
3.17b Composite Index <strong>of</strong> <strong>Urban</strong> <strong>Food</strong> <strong>Insecurity</strong> (Variant 6) (2004-06)<br />
ix
Foreword<br />
In early 2000, <strong>the</strong> M. S. Swam<strong>in</strong>athan Research Foundati<strong>on</strong> (MSSRF) and <strong>the</strong> World <strong>Food</strong> Programme<br />
(WFP) agreed to collaborate <strong>in</strong> mapp<strong>in</strong>g <strong>the</strong> food security situati<strong>on</strong> <strong>in</strong> rural and urban <strong>India</strong>. As a result<br />
<strong>of</strong> this partnership, <strong>the</strong> <strong>Food</strong> <strong>Insecurity</strong> Atlas <strong>of</strong> Rural <strong>India</strong> (April 2001), <strong>the</strong> <strong>Food</strong> <strong>Insecurity</strong> Atlas<br />
<strong>of</strong> <strong>Urban</strong> <strong>India</strong> (October 2002) and <strong>the</strong> Atlas <strong>of</strong> <strong>the</strong> Susta<strong>in</strong>ability <strong>of</strong> <strong>Food</strong> Security <strong>in</strong> <strong>India</strong> (February<br />
2004) were developed and distributed widely. The analysis <strong>in</strong> <strong>the</strong>se atlases provides an important basis<br />
for generat<strong>in</strong>g public awareness and political acti<strong>on</strong>.<br />
We appreciate <strong>the</strong> fact that <strong>the</strong>re is a need for <strong>the</strong>se reports to be updated periodically, so that <strong>the</strong>y rema<strong>in</strong><br />
relevant to policy makers tak<strong>in</strong>g critical decisi<strong>on</strong>s that <strong>in</strong>fluence public spend<strong>in</strong>g. An update <strong>of</strong> <strong>the</strong> <strong>Food</strong><br />
<strong>Insecurity</strong> Atlas <strong>of</strong> Rural <strong>India</strong> <strong>of</strong> 2001 – <str<strong>on</strong>g>Report</str<strong>on</strong>g> <strong>on</strong> <strong>the</strong> <strong>State</strong> <strong>of</strong> <strong>Food</strong> Security <strong>in</strong> Rural <strong>India</strong> – was<br />
released <strong>in</strong> early 2009 to capture <strong>the</strong> changes <strong>in</strong> <strong>the</strong> scenario and highlight <strong>the</strong> parameters that will lead<br />
to improved food security <strong>in</strong> <strong>India</strong>. This report is an update <strong>of</strong> <strong>the</strong> <strong>Food</strong> <strong>Insecurity</strong> Atlas <strong>of</strong> <strong>Urban</strong> <strong>India</strong><br />
<strong>of</strong> October 2002.<br />
In recent years, <strong>the</strong> pace <strong>of</strong> urbanisati<strong>on</strong> has been <strong>in</strong>creas<strong>in</strong>g. In deliberati<strong>on</strong>s <strong>on</strong> food and nutriti<strong>on</strong><br />
security, <strong>the</strong> situati<strong>on</strong> <strong>in</strong> urban areas is <strong>of</strong>ten overlooked. About half <strong>the</strong> women <strong>in</strong> urban areas are<br />
estimated to be anaemic and undernutriti<strong>on</strong> am<strong>on</strong>g women, <strong>in</strong>dicated by chr<strong>on</strong>ic energy deficiency, is<br />
<strong>in</strong>creas<strong>in</strong>g. As po<strong>in</strong>ted out <strong>in</strong> this report, <strong>the</strong> access and absorpti<strong>on</strong> <strong>in</strong>dicators <strong>of</strong> urban food <strong>in</strong>security,<br />
<strong>in</strong> spite <strong>of</strong> <strong>the</strong> rapid ec<strong>on</strong>omic growth dur<strong>in</strong>g <strong>the</strong> 1990s, reveal an alarm<strong>in</strong>g picture. Smaller towns<br />
are significantly worse <strong>of</strong>f than large cities and metropolitan areas when it comes to key food security<br />
<strong>in</strong>dicators.<br />
The urban report also shows that <strong>the</strong>re is c<strong>on</strong>siderable variability with<strong>in</strong> <strong>the</strong> country relat<strong>in</strong>g to <strong>the</strong> levels<br />
<strong>of</strong> food security. For example, Tamil Nadu, which not <strong>on</strong>ly has a universal PDS but is also supply<strong>in</strong>g up<br />
to 20 kg <strong>of</strong> rice per m<strong>on</strong>th at <strong>the</strong> rate <strong>of</strong> Re.1/- per kg to 185 lakh families, is <strong>in</strong> a much better situati<strong>on</strong><br />
than most o<strong>the</strong>r <strong>State</strong>s <strong>in</strong> <strong>India</strong>. This reveals that, where <strong>the</strong>re is <strong>the</strong> necessary political will and acti<strong>on</strong>,<br />
hunger can be elim<strong>in</strong>ated earlier than normally c<strong>on</strong>sidered possible.<br />
This updated report <strong>on</strong> urban food <strong>in</strong>security is an important tool for policy makers and o<strong>the</strong>r stakeholders<br />
who are work<strong>in</strong>g towards achiev<strong>in</strong>g <strong>the</strong> UN Millennium Development Goals by 2015. <strong>Urban</strong> food<br />
<strong>in</strong>security deserves serious attenti<strong>on</strong> s<strong>in</strong>ce an important comp<strong>on</strong>ent <strong>of</strong> urbanisati<strong>on</strong> is <strong>the</strong> proliferati<strong>on</strong><br />
<strong>of</strong> slums caused by <strong>the</strong> unplanned migrati<strong>on</strong> <strong>of</strong> <strong>the</strong> rural poor to urban areas <strong>in</strong> search <strong>of</strong> livelihoods.In<br />
prepar<strong>in</strong>g <strong>the</strong>se reports, we are deeply aware <strong>of</strong> <strong>the</strong> limitati<strong>on</strong>s imposed by <strong>the</strong> quality and availability<br />
xi
<strong>of</strong> data, as well as limitati<strong>on</strong>s <strong>in</strong> <strong>the</strong> scope <strong>of</strong> <strong>the</strong> study. It is probable that certa<strong>in</strong> situati<strong>on</strong>s described<br />
with<strong>in</strong> <strong>the</strong> report will have changed <strong>in</strong> view <strong>of</strong> recent progress made s<strong>in</strong>ce <strong>the</strong> time <strong>of</strong> data collecti<strong>on</strong>. We<br />
hope <strong>the</strong> report will stimulate fur<strong>the</strong>r research <strong>in</strong>to urban vulnerability, to help guide policy makers and<br />
implementers <strong>on</strong> <strong>the</strong> type <strong>of</strong> <strong>in</strong>terventi<strong>on</strong>s that really work.<br />
Our gratitude goes to all our colleagues at MSSRF and WFP. Our special thanks to Pr<strong>of</strong>essor Venkatesh<br />
Athreya for his guidance <strong>in</strong> <strong>the</strong> preparati<strong>on</strong> <strong>of</strong> this report as well as to Ms. R. V. Bhavani, Dr. R. Rukmani,<br />
Ms. G. Anuradha and Mr. R. Gop<strong>in</strong>ath at MSSRF and Ms. Pradnya Paithankar, Dr. K. S. Murali and Mr.<br />
Balparitosh Dash at WFP, for <strong>the</strong>ir dedicated efforts <strong>in</strong> br<strong>in</strong>g<strong>in</strong>g out a mean<strong>in</strong>gful report which can be an<br />
effective <strong>in</strong>strument for public acti<strong>on</strong>.<br />
M. S. Swam<strong>in</strong>athan Mihoko Tamamura<br />
Chairman, MSSRF Country Director, WFP<br />
Chennai New Delhi<br />
xii
EXECUTIVE SUMMARY<br />
Executive Summary<br />
In 2001, The M. S. Swam<strong>in</strong>athan Research Foundati<strong>on</strong> and <strong>the</strong> World <strong>Food</strong> Programme released<br />
<strong>the</strong> <strong>Food</strong> <strong>Insecurity</strong> Atlas <strong>of</strong> Rural <strong>India</strong>. In 2002, <strong>the</strong> <strong>Food</strong> <strong>Insecurity</strong> Atlas <strong>of</strong> <strong>Urban</strong> <strong>India</strong> (FIAUI) was<br />
published. Aga<strong>in</strong>, <strong>in</strong> 2008, MSSRF and WFP brought out <strong>the</strong> <str<strong>on</strong>g>Report</str<strong>on</strong>g> <strong>on</strong> <strong>the</strong> <strong>State</strong> <strong>of</strong> <strong>Food</strong> <strong>Insecurity</strong> <strong>in</strong><br />
Rural <strong>India</strong> (RSFIRI). The current <str<strong>on</strong>g>Report</str<strong>on</strong>g> <strong>on</strong> <strong>the</strong> <strong>State</strong> <strong>of</strong> <strong>Food</strong> <strong>Insecurity</strong> <strong>in</strong> <strong>Urban</strong> <strong>India</strong> is an updat<strong>in</strong>g<br />
<strong>of</strong> FIAUI and a compani<strong>on</strong> exercise to RSFIRI, us<strong>in</strong>g new and enlarged data that has become available<br />
from sources like NSSO, NFHS and Census 2001. The focus is <strong>on</strong> chr<strong>on</strong>ic food <strong>in</strong>security, with <strong>the</strong><br />
ma<strong>in</strong> c<strong>on</strong>cern be<strong>in</strong>g with describ<strong>in</strong>g and analys<strong>in</strong>g <strong>the</strong> status and challenge <strong>of</strong> urban food security <strong>in</strong> <strong>the</strong><br />
c<strong>on</strong>temporary c<strong>on</strong>text across <strong>the</strong> major <strong>State</strong>s <strong>of</strong> <strong>India</strong>. Mapp<strong>in</strong>g <strong>the</strong> relative positi<strong>on</strong> <strong>of</strong> <strong>the</strong> <strong>State</strong>s <strong>on</strong> a<br />
food <strong>in</strong>security scale <strong>on</strong> <strong>the</strong> basis <strong>of</strong> a select set <strong>of</strong> <strong>in</strong>dicators is part <strong>of</strong> this exercise.<br />
A review <strong>of</strong> <strong>the</strong> global c<strong>on</strong>text <strong>in</strong> respect <strong>of</strong> food security po<strong>in</strong>ts out that <strong>the</strong> slow<strong>in</strong>g down <strong>of</strong><br />
<strong>the</strong> growth rate <strong>of</strong> food producti<strong>on</strong> has led to a decl<strong>in</strong>e <strong>in</strong> per capita output <strong>of</strong> gra<strong>in</strong> between <strong>the</strong> 1970s<br />
and <strong>the</strong> first decade <strong>of</strong> <strong>the</strong> twenty-first century, due <strong>in</strong> most part to <strong>the</strong> reduced ability/will<strong>in</strong>gness <strong>of</strong><br />
governments to raise and spend <strong>the</strong> required amount <strong>of</strong> resources by way <strong>of</strong> public <strong>in</strong>vestment <strong>on</strong> rural<br />
and agricultural development. This is equally apparent <strong>in</strong> <strong>the</strong> areas <strong>of</strong> urban <strong>in</strong>frastructure and public<br />
health, given <strong>the</strong> policy framework <strong>of</strong> far greater reliance <strong>on</strong> markets and private <strong>in</strong>vestments, and a<br />
much lesser role for governments. The result has been difficulties <strong>in</strong> tackl<strong>in</strong>g problems relat<strong>in</strong>g to all<br />
three dimensi<strong>on</strong>s <strong>of</strong> food security, namely, availability, access and absorpti<strong>on</strong>, especially affect<strong>in</strong>g <strong>the</strong><br />
world’s poor, <strong>in</strong>clud<strong>in</strong>g <strong>the</strong> urban poor.<br />
The <strong>India</strong>n c<strong>on</strong>text – <strong>in</strong> particular, <strong>the</strong> urban situati<strong>on</strong> – is no different. Ris<strong>in</strong>g urban <strong>in</strong>equality,<br />
significant under<strong>in</strong>vestment <strong>in</strong> urban health and nutriti<strong>on</strong> <strong>in</strong>frastructure, an <strong>in</strong>creas<strong>in</strong>gly <strong>in</strong>secure<br />
workforce with mostly casual or c<strong>on</strong>tract employment or even less remunerative self-employment,<br />
growth <strong>of</strong> slums and slum populati<strong>on</strong>s lack<strong>in</strong>g <strong>in</strong> <strong>the</strong> most elementary health and hygiene facilities<br />
<strong>in</strong>clud<strong>in</strong>g shelter, safe dr<strong>in</strong>k<strong>in</strong>g water, sanitati<strong>on</strong> and dra<strong>in</strong>age, all taken toge<strong>the</strong>r, make for a situati<strong>on</strong> <strong>of</strong><br />
a permanent food and nutriti<strong>on</strong> emergency <strong>in</strong> urban <strong>India</strong>. The mere availability <strong>of</strong> food <strong>in</strong> urban markets<br />
does not guarantee food security <strong>in</strong> an envir<strong>on</strong>ment <strong>in</strong> which access has been seriously compromised<br />
both by patterns <strong>of</strong> employment and earn<strong>in</strong>gs, and by <strong>the</strong> rapid rise <strong>in</strong> <strong>the</strong> prices <strong>of</strong> essential commodities<br />
beg<strong>in</strong>n<strong>in</strong>g with food and shelter (Chapter 1).<br />
The c<strong>on</strong>cept <strong>of</strong> food <strong>in</strong>security is multidimensi<strong>on</strong>al <strong>in</strong> nature and is determ<strong>in</strong>ed by a whole range<br />
<strong>of</strong> issues such as domestic producti<strong>on</strong> <strong>of</strong> food, import and export <strong>of</strong> food, purchas<strong>in</strong>g power <strong>of</strong> people to<br />
access food as well as factors that <strong>in</strong>fluence absorpti<strong>on</strong> <strong>of</strong> food <strong>in</strong> <strong>the</strong> body. The different elements that<br />
<strong>in</strong>fluence food security can be classified <strong>in</strong>to three broad dimensi<strong>on</strong>s – food availability, food access and<br />
food absorpti<strong>on</strong>.<br />
The various elements that have a bear<strong>in</strong>g <strong>on</strong> <strong>the</strong> status <strong>of</strong> food <strong>in</strong>security <strong>of</strong> <strong>the</strong> urban <strong>India</strong>n<br />
populati<strong>on</strong> <strong>in</strong>clude <strong>the</strong> extent and nature <strong>of</strong> employment opportunities available, accessibility to basic<br />
amenities, level and pattern <strong>of</strong> food c<strong>on</strong>sumpti<strong>on</strong>, and <strong>the</strong> nutriti<strong>on</strong>al status <strong>of</strong> <strong>the</strong> urban populati<strong>on</strong><br />
across <strong>the</strong> different <strong>State</strong>s and across various size classes <strong>of</strong> urban units . An analysis <strong>of</strong> <strong>the</strong>se factors has<br />
brought out <strong>the</strong> follow<strong>in</strong>g salient po<strong>in</strong>ts. First, <strong>the</strong> employment pattern shows that <strong>the</strong>re is a significant<br />
<strong>in</strong>crease <strong>in</strong> <strong>the</strong> proporti<strong>on</strong> <strong>of</strong> both male and female workers <strong>in</strong> <strong>the</strong> self-employment category <strong>in</strong> <strong>the</strong><br />
xiii
REPORT ON THE STATE OF FOOD INSECURITY IN URBAN INDIA<br />
urban areas across all <strong>the</strong> <strong>State</strong>s <strong>of</strong> <strong>India</strong>. A predom<strong>in</strong>ant secti<strong>on</strong> <strong>of</strong> workers are unorganised, and earn<br />
less than <strong>the</strong> m<strong>in</strong>imum wages. There is also a tendency towards us<strong>in</strong>g more weakly placed, especially<br />
females. The rate <strong>of</strong> unemployment is also higher for females. In general, smaller towns exhibit higher<br />
unemployment rates as well as greater casualisati<strong>on</strong> <strong>of</strong> <strong>the</strong> workforce. At <strong>the</strong> same time, s<strong>in</strong>ce slum<br />
populati<strong>on</strong>s display <strong>the</strong> expected pattern <strong>of</strong> higher <strong>in</strong>cidence <strong>of</strong> marg<strong>in</strong>al workers compared to n<strong>on</strong>-slum<br />
populati<strong>on</strong>s, and slums account for significant proporti<strong>on</strong>s <strong>of</strong> <strong>the</strong> populati<strong>on</strong>s <strong>of</strong> metropolitan cities and<br />
big towns, <strong>the</strong> problem <strong>of</strong> urban food <strong>in</strong>security is quite severe <strong>in</strong> <strong>the</strong>se categories <strong>of</strong> urban areas too.<br />
Sec<strong>on</strong>d, significant secti<strong>on</strong>s <strong>of</strong> <strong>the</strong> urban populati<strong>on</strong> are not yet covered by basic amenities and <strong>the</strong>re is<br />
vast scope to improve hous<strong>in</strong>g c<strong>on</strong>diti<strong>on</strong>s, sanitati<strong>on</strong> and dr<strong>in</strong>k<strong>in</strong>g water supplies for urban households<br />
across <strong>the</strong> country. The availability <strong>of</strong> basic amenities is much more <strong>of</strong> a problem for households <strong>in</strong><br />
small towns compared to those who reside <strong>in</strong> large towns. Third, <strong>the</strong>re has been a decl<strong>in</strong>e <strong>in</strong> <strong>the</strong> average<br />
c<strong>on</strong>sumpti<strong>on</strong> <strong>of</strong> cereals, pulses, meat and sugar by an average urban c<strong>on</strong>sumer <strong>in</strong> <strong>the</strong> country as a whole<br />
<strong>in</strong> 2004-05 compared to 1993-94. Every <strong>State</strong> has exhibited a decl<strong>in</strong>e <strong>in</strong> cereal <strong>in</strong>take over this period,<br />
irrespective <strong>of</strong> <strong>the</strong> <strong>in</strong>itial levels <strong>of</strong> c<strong>on</strong>sumpti<strong>on</strong>. Moreover, <strong>the</strong> prevail<strong>in</strong>g level <strong>of</strong> c<strong>on</strong>sumpti<strong>on</strong> is also<br />
lower than <strong>the</strong> recommended dietary allowance (RDA) prescribed by <strong>the</strong> <strong>India</strong>n Council <strong>of</strong> Medical<br />
Research. Fourth, as regards nutriti<strong>on</strong> levels, <strong>the</strong> extent <strong>of</strong> child undernutriti<strong>on</strong> rema<strong>in</strong>s quite high <strong>in</strong><br />
urban <strong>India</strong>. About half <strong>the</strong> women <strong>in</strong> urban areas are estimated to be anaemic and undernutriti<strong>on</strong> am<strong>on</strong>g<br />
women, <strong>in</strong>dicated by chr<strong>on</strong>ic energy deficiency, is <strong>in</strong>creas<strong>in</strong>g. Despite rapid ec<strong>on</strong>omic growth s<strong>in</strong>ce<br />
<strong>the</strong> early 1980s, and especially s<strong>in</strong>ce <strong>the</strong> 1990s, <strong>the</strong> access and absorpti<strong>on</strong> <strong>in</strong>dicators <strong>of</strong> urban food<br />
<strong>in</strong>security tell a dismal story <strong>of</strong> relatively little improvement <strong>in</strong> nutriti<strong>on</strong>al <strong>in</strong>take and worsen<strong>in</strong>g <strong>in</strong> terms<br />
<strong>of</strong> livelihood <strong>in</strong>security. Smaller towns are significantly worse <strong>of</strong>f than large cities and metropolitan<br />
areas with regard to <strong>the</strong> status <strong>of</strong> food security (Chapter 2).<br />
An important exercise undertaken <strong>in</strong> this <str<strong>on</strong>g>Report</str<strong>on</strong>g> has been <strong>the</strong> c<strong>on</strong>structi<strong>on</strong> <strong>of</strong> an <strong>in</strong>dex <strong>of</strong> food<br />
<strong>in</strong>security and a computati<strong>on</strong> <strong>of</strong> <strong>the</strong> values <strong>of</strong> this <strong>in</strong>dex for <strong>the</strong> major <strong>State</strong>s <strong>of</strong> <strong>India</strong> to provide an<br />
analytical comparis<strong>on</strong> at two different po<strong>in</strong>ts <strong>in</strong> time. S<strong>in</strong>ce it would be difficult to get a reliable measure<br />
<strong>of</strong> food availability <strong>in</strong> <strong>the</strong> urban sett<strong>in</strong>g, <strong>in</strong>dicators that capture <strong>the</strong> access and absorpti<strong>on</strong> dimensi<strong>on</strong>s <strong>of</strong><br />
food security have been relied up<strong>on</strong>. In all, 11 <strong>in</strong>dicators have been exam<strong>in</strong>ed:<br />
•<br />
•<br />
•<br />
•<br />
•<br />
•<br />
•<br />
•<br />
•<br />
•<br />
•<br />
Percentage <strong>of</strong> urban populati<strong>on</strong> c<strong>on</strong>sum<strong>in</strong>g less than 1890 Kcal per c<strong>on</strong>sumer unit per day<br />
Number per 1000 <strong>of</strong> urban male workers not “regularly employed”<br />
Number per 1000 <strong>of</strong> urban female workers not “regularly employed”<br />
Percentage <strong>of</strong> urban households without access to safe dr<strong>in</strong>k<strong>in</strong>g water<br />
Percentage <strong>of</strong> urban households without access to toilets<br />
Percentage <strong>of</strong> ever-married women (15-49 years) with any anaemia<br />
Percentage <strong>of</strong> ever-married women (15-49 years) with chr<strong>on</strong>ic energy deficiency (CED)<br />
Percentage <strong>of</strong> children (6-35 m<strong>on</strong>ths) with any anaemia<br />
Percentage <strong>of</strong> children (6-35 m<strong>on</strong>ths) who are stunted<br />
Percentage <strong>of</strong> children (6-35 m<strong>on</strong>ths) who are underweight for age<br />
Percentage <strong>of</strong> children (6-35 m<strong>on</strong>ths) who are wast<strong>in</strong>g<br />
xiv
EXECUTIVE SUMMARY<br />
The first three <strong>in</strong>dicators relate to <strong>the</strong> dimensi<strong>on</strong> <strong>of</strong> access to food. The sec<strong>on</strong>d and third <strong>in</strong>dicators<br />
reflect material deprivati<strong>on</strong> as well as <strong>in</strong>stability <strong>in</strong> earn<strong>in</strong>gs, both <strong>of</strong> which have implicati<strong>on</strong>s for food<br />
security. The fourth and fifth <strong>in</strong>dicators, relat<strong>in</strong>g to absorpti<strong>on</strong>, are <strong>in</strong>put <strong>in</strong>dicators that have implicati<strong>on</strong>s<br />
for nutriti<strong>on</strong>al outcomes and thus for food and nutriti<strong>on</strong> security. The rema<strong>in</strong><strong>in</strong>g 6 <strong>in</strong>dicators are all<br />
outcome <strong>in</strong>dicators. The overall urban food <strong>in</strong>security <strong>in</strong>dex has been worked out <strong>in</strong> several variants,<br />
alternat<strong>in</strong>g <strong>the</strong> child nutriti<strong>on</strong> outcome <strong>in</strong>dicators am<strong>on</strong>g <strong>the</strong>mselves as well as try<strong>in</strong>g <strong>the</strong> <strong>in</strong>dex with and<br />
without <strong>the</strong> <strong>in</strong>dicator <strong>of</strong> proporti<strong>on</strong> <strong>of</strong> households without access to safe dr<strong>in</strong>k<strong>in</strong>g water.<br />
The <strong>in</strong>dex is <strong>in</strong>tended as a summary measure <strong>of</strong> a complex, multidimensi<strong>on</strong>al c<strong>on</strong>cept, which cannot<br />
be captured by a s<strong>in</strong>gle <strong>in</strong>dicator al<strong>on</strong>e. The analysis assigns equal weights to all <strong>the</strong> <strong>in</strong>dicators, after<br />
normalis<strong>in</strong>g <strong>the</strong> <strong>in</strong>dividual <strong>in</strong>dicators through <strong>the</strong> use <strong>of</strong> a relative distance measure. Thus, <strong>in</strong> compar<strong>in</strong>g<br />
<strong>the</strong> different <strong>State</strong>s, for any given <strong>in</strong>dicator, <strong>the</strong> difference between <strong>the</strong> value <strong>of</strong> <strong>the</strong> <strong>in</strong>dicator and <strong>the</strong><br />
m<strong>in</strong>imum value is taken as a proporti<strong>on</strong> <strong>of</strong> <strong>the</strong> difference between <strong>the</strong> maximum and <strong>the</strong> m<strong>in</strong>imum<br />
values. A map has been obta<strong>in</strong>ed for each <strong>in</strong>dicator and also <strong>the</strong> f<strong>in</strong>al composite <strong>in</strong>dex, for two different<br />
time <strong>in</strong>tervals, – 1998-2000 and 2004-06. This will help assess <strong>the</strong> relative changes <strong>in</strong> <strong>the</strong> positi<strong>on</strong> <strong>of</strong><br />
<strong>the</strong> <strong>State</strong>s with regard to <strong>the</strong>se <strong>in</strong>dicators.<br />
Based <strong>on</strong> <strong>the</strong> level <strong>of</strong> food and nutriti<strong>on</strong> <strong>in</strong>security, <strong>the</strong> <strong>State</strong>s have been placed <strong>in</strong>to <strong>on</strong>e <strong>of</strong> five<br />
categories: very low, low, moderate, high and very high. The picture emerg<strong>in</strong>g from a study <strong>of</strong> <strong>the</strong><br />
performance <strong>in</strong> terms <strong>of</strong> each <strong>in</strong>dicator is ra<strong>the</strong>r mixed. At <strong>the</strong> all-<strong>India</strong> level, <strong>the</strong> positi<strong>on</strong> seems to<br />
have improved with respect to access to toilets, proporti<strong>on</strong> <strong>of</strong> female workers regularly employed and<br />
percentage <strong>of</strong> children underweight. In respect <strong>of</strong> <strong>the</strong> o<strong>the</strong>r <strong>in</strong>dicators, <strong>the</strong> situati<strong>on</strong> has worsened between<br />
1998-2000 and 2004-06. The deteriorati<strong>on</strong> at <strong>the</strong> nati<strong>on</strong>al level is marg<strong>in</strong>al with regard to most <strong>in</strong>dicators<br />
but is somewhat substantial with regard to <strong>the</strong> percentage <strong>of</strong> women with anaemia and children wast<strong>in</strong>g,<br />
with <strong>the</strong> situati<strong>on</strong> worsen<strong>in</strong>g <strong>in</strong> 14 out <strong>of</strong> 15 <strong>State</strong>s. With regard to women with CED, <strong>the</strong> situati<strong>on</strong> has<br />
worsened <strong>in</strong> 11 <strong>State</strong>s, although marg<strong>in</strong>ally <strong>in</strong> most <strong>of</strong> <strong>the</strong>m. With regard to <strong>the</strong> percentage <strong>of</strong> children<br />
stunted, <strong>the</strong> situati<strong>on</strong> has become worse <strong>in</strong> 9 <strong>State</strong>s. The percentage <strong>of</strong> urban children wast<strong>in</strong>g has risen<br />
<strong>in</strong> 12 <strong>State</strong>s. In respect <strong>of</strong> <strong>the</strong> <strong>in</strong>dicators <strong>of</strong> access to toilets, female workers regularly employed and<br />
percentage <strong>of</strong> children underweight, <strong>the</strong> situati<strong>on</strong> has improved <strong>in</strong> 10 or more <strong>State</strong>s. However, many <strong>of</strong><br />
<strong>the</strong> nutriti<strong>on</strong>al outcome <strong>in</strong>dicators suggest an unacceptably high level <strong>of</strong> <strong>in</strong>security.<br />
Six variants <strong>of</strong> <strong>the</strong> <strong>in</strong>dex were computed, <strong>of</strong> which <strong>on</strong>e was identified as most appropriate. While<br />
<strong>the</strong>re has been improvement between 1998-2000 and 2004-06 <strong>in</strong> <strong>the</strong> food security situati<strong>on</strong> <strong>in</strong> urban<br />
<strong>India</strong> as measured by any <strong>of</strong> <strong>the</strong> six variants, it must also be noted that <strong>the</strong> improvement has been<br />
ra<strong>the</strong>r modest. The rank<strong>in</strong>gs across <strong>the</strong> <strong>State</strong>s did not change dramatically across <strong>the</strong> different variants<br />
c<strong>on</strong>sidered. The most appropriate variant <strong>in</strong> terms <strong>of</strong> <strong>the</strong> quality <strong>of</strong> data and <strong>the</strong> issue <strong>of</strong> chr<strong>on</strong>ic food<br />
and nutriti<strong>on</strong> <strong>in</strong>security excludes both lack <strong>of</strong> access to safe dr<strong>in</strong>k<strong>in</strong>g water and percentage <strong>of</strong> children<br />
underweight, but <strong>in</strong>cludes <strong>the</strong> percentage <strong>of</strong> children stunted. In terms <strong>of</strong> this variant (variant 1), <strong>the</strong><br />
decl<strong>in</strong>e <strong>in</strong> <strong>the</strong> composite urban food <strong>in</strong>security <strong>in</strong>dex is quite small, from 0.542 <strong>in</strong> 1998-2000 to 0.538 <strong>in</strong><br />
2004-06. This is <strong>the</strong> performance dur<strong>in</strong>g a period when <strong>India</strong>’s GDP growth rate has been <strong>in</strong> excess <strong>of</strong><br />
6 per cent per annum compound. Clearly, <strong>the</strong>re has to be more than <strong>the</strong> rhetoric <strong>of</strong> <strong>in</strong>clusive growth if a<br />
significant improvement <strong>in</strong> <strong>the</strong> food security situati<strong>on</strong> <strong>in</strong> urban <strong>India</strong> is to occur (Chapter 3).<br />
xv
REPORT ON THE STATE OF FOOD INSECURITY IN URBAN INDIA<br />
In an ec<strong>on</strong>omy where a substantial proporti<strong>on</strong> <strong>of</strong> <strong>the</strong> populati<strong>on</strong> is food <strong>in</strong>secure and where markets<br />
for foodgra<strong>in</strong>s are poorly <strong>in</strong>tegrated, besides be<strong>in</strong>g characterised by significant elements <strong>of</strong> m<strong>on</strong>opoly,<br />
<strong>the</strong>re is an obvious need for public food delivery systems. It can, <strong>in</strong> fact, be claimed that public food<br />
delivery systems have an even more important role <strong>in</strong> <strong>the</strong> urban c<strong>on</strong>text vis-à-vis <strong>the</strong> rural, where<br />
some amount <strong>of</strong> own or subsistence cultivati<strong>on</strong> and c<strong>on</strong>sumpti<strong>on</strong> may be expected <strong>of</strong> owner-cultivator<br />
households and <strong>the</strong>re is also sometimes payment <strong>in</strong> k<strong>in</strong>d for labour. The urban populati<strong>on</strong>, <strong>on</strong> <strong>the</strong> o<strong>the</strong>r<br />
hand, is largely dependent <strong>on</strong> <strong>the</strong> market, mak<strong>in</strong>g <strong>the</strong> urban poor <strong>in</strong> particular more vulnerable to price<br />
shocks and food and nutriti<strong>on</strong> <strong>in</strong>security.<br />
Historically, <strong>the</strong> most important <strong>of</strong> such systems <strong>in</strong> <strong>India</strong> has been PDS, which has been an<br />
extremely important <strong>in</strong>strument <strong>of</strong> food security <strong>in</strong> urban <strong>India</strong> for more than six decades now. In <strong>the</strong><br />
1980s, expansi<strong>on</strong> <strong>of</strong> PDS <strong>on</strong> a large scale to cover n<strong>on</strong>-urban and n<strong>on</strong>-food-deficit areas took place. In<br />
a major policy shift, a targeted PDS (TPDS) was <strong>in</strong>troduced <strong>in</strong> 1997 by <strong>the</strong> Government <strong>of</strong> <strong>India</strong>, and<br />
most <strong>State</strong>s fell <strong>in</strong> l<strong>in</strong>e. TPDS, by restrict<strong>in</strong>g access to <strong>on</strong>ly <strong>the</strong> BPL households as per <strong>the</strong> c<strong>on</strong>sumer<br />
expenditure figure derived from apply<strong>in</strong>g <strong>the</strong> methodology <strong>of</strong> <strong>the</strong> 1993 <str<strong>on</strong>g>Report</str<strong>on</strong>g> <strong>of</strong> <strong>the</strong> Expert Committee<br />
set up by <strong>the</strong> Plann<strong>in</strong>g Commissi<strong>on</strong>, seems to be exclud<strong>in</strong>g large numbers <strong>of</strong> undernourished BPL as well<br />
as APL households. The universalisati<strong>on</strong> <strong>of</strong> PDS is imperative to counter food <strong>in</strong>security <strong>in</strong> urban <strong>India</strong>.<br />
The exercise presented <strong>in</strong> this <str<strong>on</strong>g>Report</str<strong>on</strong>g> shows that <strong>the</strong> fiscal burden <strong>of</strong> universal PDS to provide 35 kg per<br />
m<strong>on</strong>th to all households at two rupees a kg may not be prohibitive. It has to be emphasised, however, that<br />
it is important to improve <strong>the</strong> functi<strong>on</strong><strong>in</strong>g <strong>of</strong> PDS, which is far from satisfactory <strong>in</strong> many respects.<br />
The Nati<strong>on</strong>al Programme <strong>of</strong> Nutriti<strong>on</strong>al Support to Primary Educati<strong>on</strong> (NPNSPE), popularly<br />
known as <strong>the</strong> Mid-Day Meal Scheme (MDMS), started by <strong>the</strong> Government <strong>of</strong> <strong>India</strong> <strong>in</strong> 1995, seeks to<br />
improve <strong>the</strong> nutriti<strong>on</strong>al status <strong>of</strong> children <strong>in</strong> classes I-VIII <strong>in</strong> government, local body, government body<br />
and government-aided schools; children study<strong>in</strong>g <strong>in</strong> <strong>the</strong> centres under <strong>the</strong> Educati<strong>on</strong> Guarantee Scheme<br />
(EGS); and <strong>in</strong> Alternative and Innovative Educati<strong>on</strong> (AIE) centres. The scheme <strong>in</strong>itially provided for<br />
distributi<strong>on</strong> <strong>of</strong> fixed quantities <strong>of</strong> dry foodgra<strong>in</strong>s to schoolchildren. This was replaced by cooked meals<br />
with effect from September 2004. While <strong>the</strong> scheme has had a significant positive impact <strong>on</strong> enrolment<br />
and retenti<strong>on</strong> across <strong>the</strong> country, c<strong>on</strong>current m<strong>on</strong>itor<strong>in</strong>g and evaluati<strong>on</strong> systems <strong>of</strong> a participatory nature<br />
need to be streng<strong>the</strong>ned to ensure better delivery.<br />
The Integrated Child Development Services (ICDS) scheme launched <strong>in</strong> 1975 aims at holistic<br />
development <strong>of</strong> children up to six years <strong>of</strong> age as well as adolescent girls and pregnant and lactat<strong>in</strong>g<br />
mo<strong>the</strong>rs by provid<strong>in</strong>g a package <strong>of</strong> services compris<strong>in</strong>g supplementary nutriti<strong>on</strong>, immunisati<strong>on</strong>, health<br />
check up, referral services, n<strong>on</strong>-formal pre-school educati<strong>on</strong> and health and nutriti<strong>on</strong> educati<strong>on</strong>. The<br />
Government <strong>of</strong> <strong>India</strong> is resp<strong>on</strong>sible for <strong>the</strong> programme plann<strong>in</strong>g and <strong>in</strong>frastructure fund<strong>in</strong>g and <strong>the</strong> <strong>State</strong><br />
Governments for programme implementati<strong>on</strong> and supplementary nutriti<strong>on</strong>. The services under ICDS<br />
are <strong>of</strong>fered through a network <strong>of</strong> anganwadi centres. As <strong>on</strong> 31 March 2009, around 1 milli<strong>on</strong> anganwadi<br />
centres were <strong>in</strong> operati<strong>on</strong> <strong>in</strong> <strong>the</strong> country, cover<strong>in</strong>g around 72 milli<strong>on</strong> children <strong>in</strong> <strong>the</strong> 6 m<strong>on</strong>ths to 6<br />
years age group as well as 15 milli<strong>on</strong> pregnant women and lactat<strong>in</strong>g mo<strong>the</strong>rs under <strong>the</strong> supplementary<br />
nutriti<strong>on</strong> programme. The Uni<strong>on</strong> Budget for 2009-10 has proposed that all services under ICDS would<br />
be extended to every child under <strong>the</strong> age <strong>of</strong> six by March 2012 – a tall order, c<strong>on</strong>sider<strong>in</strong>g that <strong>on</strong>ly<br />
about 30 per cent <strong>of</strong> <strong>the</strong> children were covered as <strong>on</strong> 31 March 2006. The allocati<strong>on</strong>s for ICDS <strong>in</strong> <strong>the</strong><br />
xvi
EXECUTIVE SUMMARY<br />
2009-10 and <strong>2010</strong>-11 budgets have been ra<strong>the</strong>r <strong>in</strong>adequate, given <strong>the</strong> ground to be covered, let al<strong>on</strong>e run<br />
<strong>the</strong> exist<strong>in</strong>g ICDS centres properly (Chapter 4).<br />
The <str<strong>on</strong>g>Report</str<strong>on</strong>g> <strong>on</strong> <strong>the</strong> <strong>State</strong> <strong>of</strong> <strong>Food</strong> <strong>Insecurity</strong> <strong>in</strong> <strong>Urban</strong> <strong>India</strong> c<strong>on</strong>cludes by <strong>of</strong>fer<strong>in</strong>g some policy<br />
recommendati<strong>on</strong>s to promote urban food security. These <strong>in</strong>clude:<br />
Detailed recommendati<strong>on</strong>s have been made <strong>in</strong> <strong>the</strong> <str<strong>on</strong>g>Report</str<strong>on</strong>g> <strong>on</strong> <strong>the</strong> <strong>State</strong> <strong>of</strong> <strong>Food</strong> <strong>Insecurity</strong> <strong>in</strong><br />
Rural <strong>India</strong> (RSFIRI) (MSSRF-WFP 2008) c<strong>on</strong>cern<strong>in</strong>g policies to promote food and nutriti<strong>on</strong><br />
security for all. Many <strong>of</strong> those recommendati<strong>on</strong>s are not specific to rural <strong>India</strong>, and are applicable<br />
to urban areas as well. This is especially true for all proposals perta<strong>in</strong><strong>in</strong>g to <strong>in</strong>creas<strong>in</strong>g food<br />
availability. The <strong>on</strong>ly additi<strong>on</strong>al recommendati<strong>on</strong> <strong>in</strong> <strong>the</strong> c<strong>on</strong>text <strong>of</strong> urban <strong>India</strong> is that <strong>the</strong><br />
potentialities <strong>of</strong> urban agriculture should be seriously explored.<br />
<br />
<br />
Access and absorpti<strong>on</strong> are <strong>the</strong> ma<strong>in</strong> issues <strong>in</strong> urban food security. In respect <strong>of</strong> access, <strong>the</strong><br />
key is <strong>the</strong> quality and quantity <strong>of</strong> employment. <strong>Urban</strong> asset distributi<strong>on</strong> is, <strong>of</strong> course, quite<br />
skewed, with large <strong>in</strong>dustrial and service sector establishments be<strong>in</strong>g an important feature <strong>of</strong><br />
<strong>the</strong> urban landscape. The central issue is <strong>the</strong>refore <strong>of</strong> enabl<strong>in</strong>g expansi<strong>on</strong> <strong>of</strong> productive and<br />
remunerative employment. This will <strong>in</strong>volve special assistance to <strong>the</strong> numerous small and t<strong>in</strong>y<br />
enterprises <strong>in</strong> <strong>the</strong> urban ec<strong>on</strong>omy. While such support is necessary to help enhance <strong>the</strong> <strong>in</strong>comes<br />
<strong>of</strong> <strong>the</strong> self-employed and <strong>the</strong>reby <strong>the</strong>ir access to food, it is equally important to enhance<br />
both <strong>the</strong> quantity and quality <strong>of</strong> wage-paid employment. The real need is to ensure that <strong>the</strong><br />
workers <strong>in</strong> <strong>the</strong> unorganised sector and those <strong>in</strong> <strong>in</strong>formal employment <strong>in</strong> <strong>the</strong> formal sector are<br />
provided decent wages and work<strong>in</strong>g c<strong>on</strong>diti<strong>on</strong>s as well as a modicum <strong>of</strong> social security. Skill<br />
development, both for <strong>the</strong> self-employed and those seek<strong>in</strong>g or already <strong>in</strong> wage employment, is<br />
an important <strong>in</strong>put to improve <strong>the</strong> quality <strong>of</strong> employment as well as enhance <strong>the</strong> probability <strong>of</strong><br />
f<strong>in</strong>d<strong>in</strong>g employment. Any effort <strong>in</strong> this directi<strong>on</strong> has necessarily to be <strong>on</strong> a very large scale and<br />
appropriately decentralised for effective implementati<strong>on</strong>. Most importantly, al<strong>on</strong>g <strong>the</strong> l<strong>in</strong>es <strong>of</strong><br />
<strong>the</strong> Nati<strong>on</strong>al Rural Employment Guarantee Act, an <strong>Urban</strong> Employment Guarantee Act should<br />
be urgently enacted. This can be <strong>in</strong>tegrated <strong>in</strong> a synergistic manner with <strong>the</strong> need to improve<br />
urban amenities, especially <strong>in</strong> <strong>the</strong> small and medium towns.<br />
Absorpti<strong>on</strong> is <strong>the</strong> o<strong>the</strong>r key issue <strong>in</strong> urban food security. In essence, improv<strong>in</strong>g absorpti<strong>on</strong><br />
requires easy and guaranteed access to safe dr<strong>in</strong>k<strong>in</strong>g water <strong>in</strong> adequate quantities and as and when<br />
needed; toilet facilities, ideally <strong>in</strong>side <strong>on</strong>e’s own premises, and if not, at a locati<strong>on</strong> sufficiently<br />
close to residence, with adequate water and appropriate arrangements for ma<strong>in</strong>tenance and<br />
upkeep; hygienic sanitati<strong>on</strong> and dra<strong>in</strong>age facilities for all urban areas <strong>in</strong>clud<strong>in</strong>g slums; and<br />
nutriti<strong>on</strong> educati<strong>on</strong>, cover<strong>in</strong>g both undernutriti<strong>on</strong> and “overnutriti<strong>on</strong>”. Adequate <strong>in</strong>vestments<br />
have to be made <strong>in</strong> this regard. Special attenti<strong>on</strong> has to be paid to small and medium towns<br />
which happen to be most poorly provided for <strong>in</strong> this respect so far. While <strong>the</strong> fund<strong>in</strong>g has to<br />
come from higher levels <strong>of</strong> government, design and implementati<strong>on</strong> have to be decentralised<br />
and vested with elected local bodies. <strong>Urban</strong> health facilities are important to m<strong>in</strong>imis<strong>in</strong>g<br />
urban morbidity and <strong>the</strong>reby improv<strong>in</strong>g <strong>the</strong> absorpti<strong>on</strong> dimensi<strong>on</strong> <strong>of</strong> food security. Currently,<br />
municipalities with populati<strong>on</strong> levels below 100,000 are very poorly served by <strong>the</strong> public<br />
xvii
REPORT ON THE STATE OF FOOD INSECURITY IN URBAN INDIA<br />
health care system. The town panchayats come under <strong>the</strong> service area <strong>of</strong> primary health centres<br />
and <strong>the</strong> health subcentres under <strong>the</strong>m. Municipalities (<strong>in</strong>clud<strong>in</strong>g corporati<strong>on</strong>s) with populati<strong>on</strong><br />
exceed<strong>in</strong>g 100,000 are covered under nati<strong>on</strong>al programmes like <strong>the</strong> <strong>India</strong> Populati<strong>on</strong> Project<br />
and its successors. So, <strong>the</strong>re is need for a special focus <strong>on</strong> <strong>the</strong> smaller towns and municipalities<br />
<strong>in</strong> <strong>the</strong> Nati<strong>on</strong>al <strong>Urban</strong> Health Missi<strong>on</strong>.<br />
There are some general po<strong>in</strong>ts to be kept <strong>in</strong> m<strong>in</strong>d. JNNURM and o<strong>the</strong>r urban development/<br />
urban poverty alleviati<strong>on</strong> programmes tend to emphasise <strong>the</strong> urban unit as a whole, which<br />
de facto means privileg<strong>in</strong>g <strong>the</strong> more affluent secti<strong>on</strong>s <strong>of</strong> <strong>the</strong> urban populati<strong>on</strong>. It is important<br />
to focus urban <strong>in</strong>terventi<strong>on</strong>s <strong>in</strong> JNNURM and o<strong>the</strong>r programmes <strong>on</strong> <strong>the</strong> needs <strong>of</strong> small and<br />
medium towns and <strong>on</strong> <strong>the</strong> needs <strong>of</strong> urban slums <strong>in</strong> all cities, tak<strong>in</strong>g care to address <strong>the</strong> needs<br />
<strong>of</strong> <strong>the</strong> poor with regard to shelter, water, sanitati<strong>on</strong>, dra<strong>in</strong>age and nutriti<strong>on</strong> educati<strong>on</strong>. It is a<br />
matter <strong>of</strong> political will that adequate resources be found through <strong>the</strong> regular fiscal mechanisms<br />
to undertake <strong>the</strong> necessary <strong>in</strong>frastructure <strong>in</strong>vestments <strong>in</strong> urban areas that address <strong>the</strong>se basic<br />
needs. It is also important to ensure that PDS, ICDS and MDMS reach <strong>the</strong> poor effectively.<br />
The elected urban local bodies need to be <strong>in</strong>vested with both power and resp<strong>on</strong>sibility for<br />
design<strong>in</strong>g and implement<strong>in</strong>g all food and nutriti<strong>on</strong> programmes, and provided <strong>the</strong> necessary<br />
f<strong>in</strong>ancial support by <strong>the</strong> higher levels <strong>of</strong> government, especially <strong>the</strong> Central government.<br />
To ensure effective devoluti<strong>on</strong>, <strong>the</strong> capabilities <strong>of</strong> local bodies need to be streng<strong>the</strong>ned<br />
c<strong>on</strong>siderably through appropriate programmes <strong>of</strong> capacity build<strong>in</strong>g. Elected urban local bodies<br />
could be encouraged to <strong>in</strong>volve local communities <strong>in</strong> promot<strong>in</strong>g hygiene and sanitati<strong>on</strong>, with<br />
<strong>the</strong> voluntary support <strong>of</strong> <strong>the</strong> numerous community organisati<strong>on</strong>s work<strong>in</strong>g <strong>on</strong> <strong>the</strong>se issues.<br />
Educati<strong>on</strong>, social mobilisati<strong>on</strong> and regulati<strong>on</strong> will all be needed.<br />
A Nutriti<strong>on</strong> Literacy Movement should be launched and home gardens promoted, wherever<br />
this is feasible, based <strong>on</strong> <strong>the</strong> pr<strong>in</strong>ciple <strong>of</strong> f<strong>in</strong>d<strong>in</strong>g a horticultural remedy for every nutriti<strong>on</strong>al<br />
malady (with particular reference to micr<strong>on</strong>utrient deficiencies).<br />
Based <strong>on</strong> <strong>the</strong> recent experience with food prices <strong>in</strong>flati<strong>on</strong>, it will be desirable to promote<br />
c<strong>on</strong>sumer cooperatives <strong>in</strong> urban areas to m<strong>in</strong>imise <strong>the</strong> very wide gap between wholesale and<br />
retail prices. C<strong>on</strong>sumer cooperatives can be a supplement to fair price shops.<br />
The m<strong>in</strong>imum support price announced for a number <strong>of</strong> crops is be<strong>in</strong>g implemented <strong>on</strong>ly <strong>in</strong> <strong>the</strong><br />
case <strong>of</strong> wheat and rice. It is necessary to broaden <strong>the</strong> food basket by <strong>in</strong>clud<strong>in</strong>g nutritious millets,<br />
legumes and tubers. Provid<strong>in</strong>g appropriate remunerative prices for <strong>the</strong>se crops will help expand<br />
<strong>the</strong>ir producti<strong>on</strong> PDS can cover o<strong>the</strong>r nutritious foods, <strong>in</strong> additi<strong>on</strong> to basic staples.<br />
The need to l<strong>in</strong>k nutriti<strong>on</strong> with disease management is particularly important <strong>in</strong> cases like<br />
tuberculosis, HIV/AIDS, leprosy, etc., where a drug-based approach al<strong>on</strong>e will not help to cure<br />
<strong>the</strong> patient. A food-cum-drug based approach will be important.<br />
F<strong>in</strong>ally, urban food security is not a matter <strong>of</strong> urban policy al<strong>on</strong>e. It is bound up with <strong>the</strong> urban<br />
ec<strong>on</strong>omic structure characterised by a high degree <strong>of</strong> <strong>in</strong>equality and also with <strong>the</strong> impact <strong>of</strong><br />
xviii
EXECUTIVE SUMMARY<br />
macroec<strong>on</strong>omic policies that imp<strong>in</strong>ge <strong>on</strong> urban areas. <strong>Urban</strong> food security is as much a matter<br />
<strong>of</strong> <strong>the</strong> fiscal policy framework as it is <strong>of</strong> programme implementati<strong>on</strong> <strong>on</strong> <strong>the</strong> ground. While<br />
outcomes are <strong>in</strong>deed important, a prec<strong>on</strong>diti<strong>on</strong> for achiev<strong>in</strong>g targeted outcomes is adequate<br />
outlays. This is crucially dependent <strong>on</strong> <strong>the</strong> macroec<strong>on</strong>omic policy framework. Ec<strong>on</strong>omic<br />
reforms, <strong>the</strong>refore, need to be re-formed if <strong>in</strong>clusive urban development that addresses <strong>the</strong><br />
needs <strong>of</strong> urban food security for all is to occur (Chapter 5).<br />
xix
1.1 The C<strong>on</strong>text<br />
CHAPTER 1<br />
Introducti<strong>on</strong> and Overview<br />
At <strong>the</strong> beg<strong>in</strong>n<strong>in</strong>g <strong>of</strong> <strong>the</strong> twentieth century,<br />
<strong>the</strong>re were less than 20 cities <strong>in</strong> <strong>the</strong> world with a<br />
populati<strong>on</strong> <strong>of</strong> <strong>on</strong>e milli<strong>on</strong> or more. Most <strong>of</strong> <strong>the</strong>se<br />
cities were <strong>in</strong> advanced <strong>in</strong>dustrial ec<strong>on</strong>omies. By<br />
<strong>the</strong> turn <strong>of</strong> <strong>the</strong> twenty-first century, this figure had<br />
crossed 400. Around 75 per cent <strong>of</strong> <strong>the</strong>se cities<br />
were <strong>in</strong> low and middle <strong>in</strong>come countries (Cohen<br />
2004). By 2008, more than half <strong>of</strong> <strong>the</strong> world’s<br />
populati<strong>on</strong> lived <strong>in</strong> urban areas. This figure is<br />
expected to <strong>in</strong>crease to 70 per cent by 2050.<br />
Most <strong>of</strong> this growth will be <strong>in</strong> <strong>the</strong> develop<strong>in</strong>g<br />
world (UN HABITAT 2008). Clearly, manag<strong>in</strong>g<br />
urbanisati<strong>on</strong> is a key c<strong>on</strong>temporary challenge<br />
across <strong>the</strong> develop<strong>in</strong>g world.<br />
As <strong>the</strong> Third World urbanises rapidly,<br />
ensur<strong>in</strong>g food security has become ano<strong>the</strong>r<br />
daunt<strong>in</strong>g challenge. For <strong>the</strong> first time s<strong>in</strong>ce<br />
1970, <strong>the</strong> number <strong>of</strong> hungry people <strong>in</strong> <strong>the</strong> world<br />
has crossed <strong>on</strong>e billi<strong>on</strong>. The proporti<strong>on</strong> <strong>of</strong> <strong>the</strong><br />
undernourished <strong>in</strong> <strong>the</strong> develop<strong>in</strong>g world which had<br />
steadily decl<strong>in</strong>ed from 34 per cent <strong>in</strong> 1969-71 to<br />
16 per cent by 2004-06 has risen to nearly 20 per<br />
cent <strong>in</strong> 2009 (FAO 2009). Global food prices rose<br />
by 83 per cent between 2005 and 2008. Between<br />
January 2005 and June 2008, <strong>the</strong> price <strong>of</strong> rice rose<br />
by 170 per cent and that <strong>of</strong> wheat by 127 per cent<br />
while <strong>the</strong> price <strong>of</strong> maize nearly tripled. Despite<br />
<strong>the</strong> price decl<strong>in</strong>e follow<strong>in</strong>g <strong>the</strong> f<strong>in</strong>ancial crisis, <strong>the</strong><br />
FAO food price <strong>in</strong>dex <strong>in</strong> October 2008 was still<br />
28 per cent higher than <strong>in</strong> October 2005 (Mittal<br />
2009). Liberalisati<strong>on</strong> policies across <strong>the</strong> Third<br />
World have led to serious decl<strong>in</strong>es <strong>in</strong> productive<br />
<strong>in</strong>vestments <strong>in</strong> agriculture as well as decl<strong>in</strong>es <strong>in</strong><br />
<strong>the</strong> rate <strong>of</strong> growth <strong>of</strong> output <strong>of</strong> gra<strong>in</strong> and oilseeds<br />
s<strong>in</strong>ce 1990 as compared to <strong>the</strong> period 1970 to 1990.<br />
While output growth rate has decl<strong>in</strong>ed from 2.2 per<br />
cent per annum between 1970 and 1990 to 1.3 per<br />
cent between 1990 and 2007, yield growth rates<br />
decl<strong>in</strong>ed from 2.0 per cent to 1.10 per cent over<br />
<strong>the</strong> time frame. Also, ‘… <strong>the</strong> greater participati<strong>on</strong><br />
<strong>of</strong> hedge funds, <strong>in</strong>dex funds, and sovereign wealth<br />
funds <strong>in</strong> agricultural commodity markets, has<br />
been a key force beh<strong>in</strong>d <strong>the</strong> recent hyper<strong>in</strong>flati<strong>on</strong><br />
<strong>of</strong> basic food staples’ (Mittal 2009). Globally, per<br />
capita annual availability <strong>of</strong> gra<strong>in</strong> has decl<strong>in</strong>ed<br />
between <strong>the</strong> 1970s and <strong>the</strong> 2000s.<br />
It rema<strong>in</strong>s true that, <strong>on</strong> <strong>the</strong> average, urban<br />
areas seem to do better than rural areas <strong>in</strong> terms<br />
<strong>of</strong> food and nutriti<strong>on</strong> security. For <strong>in</strong>stance, global<br />
data suggest that <strong>the</strong> prevalence <strong>of</strong> under-nutriti<strong>on</strong><br />
am<strong>on</strong>g urban children is c<strong>on</strong>sistently lower than<br />
that am<strong>on</strong>g rural children. However, <strong>the</strong>se average<br />
figures hide c<strong>on</strong>siderable <strong>in</strong>tra-urban <strong>in</strong>equalities.<br />
Specifically, as Ruel and Garret (2004: 248) po<strong>in</strong>t<br />
out, ‘…studies have shown that i) <strong>the</strong>re are large<br />
socioec<strong>on</strong>omic differentials <strong>in</strong> childhood stunt<strong>in</strong>g;<br />
ii) <strong>the</strong>se differentials are comm<strong>on</strong>ly greater <strong>in</strong> urban<br />
than <strong>in</strong> rural areas; and iii) <strong>the</strong> most disadvantaged<br />
urban children have rates <strong>of</strong> stunt<strong>in</strong>g that are <strong>on</strong><br />
average <strong>on</strong>ly slightly lower than those <strong>of</strong> <strong>the</strong> most<br />
disadvantaged rural children’.
2 REPORT ON THE STATE OF FOOD INSECURITY IN URBAN INDIA<br />
An important aspect for c<strong>on</strong>siderati<strong>on</strong> is <strong>the</strong><br />
impact <strong>of</strong> <strong>the</strong> current global f<strong>in</strong>ancial and ec<strong>on</strong>omic<br />
crisis. The global crisis began with <strong>the</strong> ec<strong>on</strong>omy<br />
<strong>of</strong> <strong>the</strong> United <strong>State</strong>s go<strong>in</strong>g <strong>in</strong>to recessi<strong>on</strong> <strong>in</strong> <strong>the</strong><br />
last quarter <strong>of</strong> 2007 – well before <strong>the</strong> collapse <strong>of</strong><br />
Lehman Bro<strong>the</strong>rs <strong>in</strong> September 2008 – and is still<br />
with us. While <strong>the</strong> prognosis for <strong>the</strong> world ec<strong>on</strong>omy<br />
<strong>in</strong> <strong>the</strong> period ahead is mixed, even optimists who<br />
see ‘green shoots’ <strong>in</strong> <strong>the</strong> sense <strong>of</strong> an impend<strong>in</strong>g<br />
recovery <strong>of</strong> output do not see unemployment<br />
rates <strong>in</strong> <strong>the</strong> advanced countries com<strong>in</strong>g down <strong>in</strong><br />
<strong>the</strong> near future. This has serious implicati<strong>on</strong>s<br />
for poor countries as it will greatly impact <strong>the</strong>ir<br />
exports by streng<strong>the</strong>n<strong>in</strong>g protecti<strong>on</strong>ism <strong>in</strong> <strong>the</strong><br />
advanced countries and thus deepen<strong>in</strong>g <strong>the</strong> crisis<br />
<strong>in</strong> <strong>the</strong> export sector. These developments have<br />
particularly om<strong>in</strong>ous implicati<strong>on</strong>s for urban areas<br />
<strong>in</strong> <strong>the</strong> Third World which have already seen huge<br />
job losses, s<strong>in</strong>ce <strong>the</strong> urban ec<strong>on</strong>omy is tied up with<br />
<strong>the</strong> export sector <strong>in</strong> many ways.<br />
In additi<strong>on</strong> to tak<strong>in</strong>g <strong>in</strong>to account <strong>the</strong><br />
outcome <strong>of</strong> <strong>the</strong> current global recessi<strong>on</strong>, <strong>on</strong>e<br />
must also c<strong>on</strong>sider <strong>the</strong> impact <strong>of</strong> <strong>the</strong> processes <strong>of</strong><br />
globalisati<strong>on</strong> underway for over two decades and<br />
more <strong>on</strong> urban areas <strong>of</strong> <strong>the</strong> Third World. While<br />
globalisati<strong>on</strong> has been associated with a relatively<br />
high rate <strong>of</strong> growth <strong>of</strong> GDP <strong>in</strong> countries like <strong>India</strong>,<br />
it is also a fact that this has been accompanied by<br />
rapid growth <strong>of</strong> urban slums and envir<strong>on</strong>mental<br />
degradati<strong>on</strong>, with <strong>in</strong>frastructure development<br />
lagg<strong>in</strong>g beh<strong>in</strong>d GDP growth, and with employment<br />
<strong>in</strong>tensity be<strong>in</strong>g low. It has been noted that:<br />
Much <strong>of</strong> <strong>the</strong> ec<strong>on</strong>omic and political<br />
envir<strong>on</strong>ment <strong>in</strong> which globalisati<strong>on</strong><br />
has accelerated over <strong>the</strong> last 20<br />
years has been <strong>in</strong>stituted under <strong>the</strong><br />
guid<strong>in</strong>g hand <strong>of</strong> a major change <strong>in</strong><br />
ec<strong>on</strong>omic paradigm – neo-liberalism,<br />
which is associated with <strong>the</strong> retreat<br />
<strong>of</strong> <strong>the</strong> nati<strong>on</strong>al state, liberalisati<strong>on</strong> <strong>of</strong><br />
trade, markets and f<strong>in</strong>ancial systems<br />
and privatisati<strong>on</strong> <strong>of</strong> urban services.<br />
Globally, <strong>the</strong>se neo-liberal policies<br />
have re-established a ra<strong>the</strong>r similar<br />
<strong>in</strong>ternati<strong>on</strong>al regime to that which<br />
existed <strong>in</strong> <strong>the</strong> mercantilist period <strong>of</strong><br />
<strong>the</strong> 19 th century when ec<strong>on</strong>omic booms<br />
and busts followed each o<strong>the</strong>r with<br />
m<strong>on</strong>ot<strong>on</strong>ous regularity, when slums<br />
were at <strong>the</strong>ir worst <strong>in</strong> Western cities<br />
and col<strong>on</strong>ialism held global sway<br />
(UN-HABITAT 2003: 2).<br />
It has also been po<strong>in</strong>ted out that:<br />
The major disadvantage (<strong>of</strong><br />
globalisati<strong>on</strong>) is <strong>the</strong> wholesale loss<br />
<strong>of</strong> formal-sector job opportunities <strong>in</strong><br />
both <strong>the</strong> public sector and <strong>the</strong> private<br />
import-substituti<strong>on</strong> <strong>in</strong>dustries, so<br />
that <strong>in</strong>formal-sector jobs, with no<br />
security and <strong>of</strong>ten with subsistence<br />
wages, are all that is left. As well,<br />
<strong>in</strong>equality <strong>in</strong>creases as <strong>the</strong> part <strong>of</strong><br />
urban society able to access global<br />
opportunities <strong>in</strong>creases its <strong>in</strong>come.<br />
This means that <strong>the</strong> prime resources <strong>of</strong><br />
<strong>the</strong> city are <strong>in</strong>creas<strong>in</strong>gly appropriated<br />
by <strong>the</strong> affluent. And globalisati<strong>on</strong> is<br />
<strong>in</strong>flati<strong>on</strong>ary as <strong>the</strong> new rich are able to<br />
pay much more for a range <strong>of</strong> key goods,<br />
especially land. This is exacerbated by<br />
removal <strong>of</strong> price fix<strong>in</strong>g <strong>on</strong> subsistence<br />
goods, and <strong>in</strong>creased utility charges<br />
through privatisati<strong>on</strong> and <strong>the</strong> removal<br />
<strong>of</strong> cross subsidy. The poor are<br />
marg<strong>in</strong>alised <strong>in</strong> <strong>the</strong> worst parts <strong>of</strong> <strong>the</strong><br />
city – <strong>the</strong> slums. The ability <strong>of</strong> nati<strong>on</strong>al<br />
governments to act <strong>on</strong> <strong>the</strong>ir behalf is<br />
curtailed, while local governments<br />
<strong>in</strong> poor areas have no tax base with<br />
which to assist (UN-HABITAT<br />
2003: 52).
The rapid growth <strong>of</strong> slums, which typically<br />
have poor access to safe dr<strong>in</strong>k<strong>in</strong>g water, sanitati<strong>on</strong><br />
and dra<strong>in</strong>age, is <strong>of</strong> particular relevance for <strong>the</strong><br />
issue <strong>of</strong> food security. By 2001, nearly a third <strong>of</strong><br />
<strong>the</strong> world’s populati<strong>on</strong> was <strong>in</strong> slums.<br />
While <strong>in</strong> general urban poverty ratios <strong>in</strong> <strong>the</strong><br />
Third World tend to be lower than rural <strong>on</strong>es, it is<br />
also true that over <strong>the</strong> late 1990s and early 2000s<br />
<strong>of</strong>ficial poverty ratios seem to be c<strong>on</strong>verg<strong>in</strong>g<br />
across rural and urban areas. Data from eight<br />
develop<strong>in</strong>g countries c<strong>on</strong>ta<strong>in</strong><strong>in</strong>g two-thirds <strong>of</strong> <strong>the</strong><br />
develop<strong>in</strong>g world’s populati<strong>on</strong> <strong>in</strong>dicate that <strong>the</strong><br />
proporti<strong>on</strong> and absolute number <strong>of</strong> poor people<br />
liv<strong>in</strong>g <strong>in</strong> urban areas have grown over <strong>the</strong> last<br />
twenty years and that from <strong>the</strong> early to mid-1990s,<br />
<strong>the</strong> share <strong>of</strong> malnourished children <strong>in</strong> urban areas<br />
has <strong>in</strong>creased. The rate <strong>of</strong> growth <strong>of</strong> <strong>the</strong> number<br />
<strong>of</strong> urban poor and undernourished has been higher<br />
than <strong>in</strong> rural areas over <strong>the</strong> last two decades <strong>of</strong> <strong>the</strong><br />
twentieth century (UNWFP 2002).<br />
Thus, <strong>the</strong> study <strong>of</strong> urban food security is <strong>of</strong><br />
c<strong>on</strong>siderable importance and policy relevance.<br />
1.2 <strong>Urban</strong> <strong>India</strong><br />
1.2.1 <strong>Urban</strong> GDP<br />
The Eleventh Five Year Plan <strong>of</strong> <strong>the</strong><br />
Government <strong>of</strong> <strong>India</strong> notes that ‘….<strong>the</strong> c<strong>on</strong>tributi<strong>on</strong><br />
<strong>of</strong> <strong>the</strong> urban sector to <strong>India</strong>’s GDP has <strong>in</strong>creased<br />
from 29 per cent <strong>in</strong> 1950-51 to 47 per cent <strong>in</strong><br />
1980-81. The urban sector presently c<strong>on</strong>tributes<br />
about 62 per cent to 63 per cent <strong>of</strong> <strong>the</strong> GDP and<br />
this is expected to <strong>in</strong>crease to 75 per cent by 2021’..<br />
By <strong>on</strong>e estimate, per capita urban GDP <strong>in</strong>creased<br />
by 29 per cent between 1980-81 and 1993-94, and<br />
by 60 per cent between 1993-94 and 1999-2000.<br />
A large share <strong>of</strong> urban GDP is c<strong>on</strong>tributed by four<br />
key sectors: (a) manufactur<strong>in</strong>g, (b) trade, hotels<br />
and restaurants, (c) f<strong>in</strong>anc<strong>in</strong>g, <strong>in</strong>surance, real<br />
estate and bus<strong>in</strong>ess services, and (d) community,<br />
social and pers<strong>on</strong>al services (Narayana 2008).<br />
INTRODUCTION AND OVERVIEW 3<br />
While urban share <strong>of</strong> GDP has grown rapidly<br />
over <strong>the</strong> last decade or more, <strong>the</strong> share <strong>of</strong> urban<br />
populati<strong>on</strong> to total has grown ra<strong>the</strong>r more slowly,<br />
imply<strong>in</strong>g a widen<strong>in</strong>g disparity between urban and<br />
rural per capita <strong>in</strong>comes. While this is true <strong>of</strong> per<br />
capita <strong>in</strong>comes, it must also be kept <strong>in</strong> m<strong>in</strong>d that<br />
urban <strong>in</strong>equality has been grow<strong>in</strong>g so that <strong>on</strong>e<br />
cannot assume that <strong>the</strong> rise <strong>in</strong> per capita urban<br />
<strong>in</strong>come implies significant reducti<strong>on</strong> <strong>in</strong> urban<br />
poverty. It has been noted that for most <strong>State</strong>s, <strong>the</strong><br />
already high urban <strong>in</strong>equality worsened <strong>in</strong> 2004-<br />
05. <strong>Urban</strong> <strong>in</strong>equality for all <strong>of</strong> <strong>India</strong>, <strong>in</strong> terms <strong>of</strong><br />
c<strong>on</strong>sumer expenditure, <strong>in</strong>creased substantially<br />
from a Lorenz ratio <strong>of</strong> 0.354 <strong>in</strong> 1987-88 to 0.372<br />
<strong>in</strong> 2004-05 (Chand 2007).<br />
1.2.2 <strong>Urban</strong> C<strong>on</strong>centrati<strong>on</strong><br />
As per <strong>the</strong> Census <strong>of</strong> 2001, <strong>India</strong>’s urban<br />
populati<strong>on</strong> was 286.1 milli<strong>on</strong> compris<strong>in</strong>g 27.8 per<br />
cent <strong>of</strong> <strong>the</strong> total populati<strong>on</strong> <strong>of</strong> 1028.6 milli<strong>on</strong>. Cities<br />
with a populati<strong>on</strong> <strong>of</strong> over 100,000 each accounted<br />
for about 68 per cent <strong>of</strong> <strong>the</strong> total urban populati<strong>on</strong>,<br />
thus signify<strong>in</strong>g a c<strong>on</strong>t<strong>in</strong>ued c<strong>on</strong>centrati<strong>on</strong> <strong>of</strong> urban<br />
populati<strong>on</strong> <strong>in</strong> <strong>the</strong> large cities.<br />
A graphic descripti<strong>on</strong> <strong>of</strong> <strong>the</strong> <strong>in</strong>creas<strong>in</strong>g<br />
c<strong>on</strong>centrati<strong>on</strong> <strong>of</strong> urban populati<strong>on</strong> occurr<strong>in</strong>g <strong>in</strong> <strong>the</strong><br />
country can be had from <strong>the</strong> follow<strong>in</strong>g extracts:<br />
The process <strong>of</strong> urbanisati<strong>on</strong> <strong>in</strong> <strong>India</strong> is<br />
marked by <strong>in</strong>creas<strong>in</strong>g c<strong>on</strong>centrati<strong>on</strong><br />
<strong>in</strong> comparatively larger cities. In<br />
2001, 68.7 per cent <strong>of</strong> <strong>the</strong> total urban<br />
populati<strong>on</strong> was liv<strong>in</strong>g <strong>in</strong> Class I cities<br />
(with a populati<strong>on</strong> <strong>of</strong> over <strong>on</strong>e lakh).<br />
The shares <strong>of</strong> medium and small<br />
towns stood at 21.9 per cent and 9.4<br />
per cent respectively. The number and<br />
proporti<strong>on</strong> <strong>of</strong> cities with a populati<strong>on</strong><br />
<strong>of</strong> <strong>on</strong>e milli<strong>on</strong> or more have grown<br />
significantly <strong>in</strong> recent decades. From<br />
12 cities <strong>in</strong> 1981 with 26.8 per cent
4 REPORT ON THE STATE OF FOOD INSECURITY IN URBAN INDIA<br />
share <strong>of</strong> <strong>the</strong> total urban populati<strong>on</strong>,<br />
<strong>the</strong> number <strong>of</strong> milli<strong>on</strong> plus cities<br />
has <strong>in</strong>creased to 35 <strong>in</strong> 2001 with<br />
37 per cent share <strong>of</strong> <strong>the</strong> total urban<br />
populati<strong>on</strong>. The seven magnet cities<br />
with a populati<strong>on</strong> <strong>of</strong> over 4 milli<strong>on</strong>,<br />
namely, Mumbai, Kolkata, Delhi,<br />
Chennai, Bangalore, Hyderabad and<br />
Ahmedabad have a total populati<strong>on</strong> <strong>of</strong><br />
64.54 milli<strong>on</strong> which was 22.56 per cent<br />
<strong>of</strong> <strong>the</strong> total populati<strong>on</strong> at <strong>the</strong> beg<strong>in</strong>n<strong>in</strong>g<br />
<strong>of</strong> <strong>the</strong> 21 st century (2001). Exclud<strong>in</strong>g<br />
Bangalore, <strong>the</strong> average annual growth<br />
rate between 1991-2001 <strong>in</strong> ‘peripheral<br />
areas’ <strong>of</strong> <strong>the</strong>se large cities ranged<br />
between 1.70 per cent to 4.18 per cent<br />
as compared to <strong>on</strong>ly 0.40 per cent<br />
to 3.90 per cent <strong>in</strong> ‘core areas’. The<br />
outward expansi<strong>on</strong> <strong>of</strong> <strong>the</strong>se cities had<br />
led to urban sprawl or what can also<br />
be termed as metropolitisati<strong>on</strong> <strong>of</strong> large<br />
cities. The <strong>in</strong>terven<strong>in</strong>g space between<br />
large urban agglomerates and <strong>the</strong>ir<br />
rural h<strong>in</strong>terland is marked by <strong>in</strong>tense<br />
f<strong>in</strong>ancial speculati<strong>on</strong> related to salepurchase<br />
<strong>of</strong> land (MoHUPA 2009).<br />
In 1991, <strong>the</strong>re were 3768 urban<br />
agglomerati<strong>on</strong>s (UAs)/towns. About <strong>on</strong>e-third<br />
<strong>of</strong> <strong>the</strong> urban populati<strong>on</strong> <strong>in</strong> 1991 resided <strong>in</strong> 23<br />
metropolitan cities; ano<strong>the</strong>r <strong>on</strong>e-third <strong>in</strong> <strong>the</strong><br />
rema<strong>in</strong><strong>in</strong>g 277 Class I cities and <strong>the</strong> rest <strong>in</strong> <strong>the</strong> 3468<br />
UAs/towns. In 2001, <strong>the</strong>re are 4368 UAs/towns.<br />
About 38 per cent <strong>of</strong> <strong>the</strong> total urban populati<strong>on</strong><br />
are resid<strong>in</strong>g <strong>in</strong> 35 metro cities, 30.6 per cent <strong>in</strong><br />
rema<strong>in</strong><strong>in</strong>g 358 Class I cities and <strong>the</strong> rest <strong>in</strong> 3975<br />
UAs/towns (Sivaramakrishnan and S<strong>in</strong>gh 2005).<br />
A l<strong>on</strong>ger term view is provided by<br />
Figure 1.1.<br />
A feature <strong>of</strong> urban growth between 1991 and<br />
2001 was that <strong>the</strong> core metro city exhibited a much<br />
Source: Datta 2006<br />
slower growth <strong>of</strong> populati<strong>on</strong> than its expand<strong>in</strong>g<br />
periphery. This pattern was evident <strong>in</strong> Mumbai<br />
and Delhi. Thus, <strong>the</strong> populati<strong>on</strong> <strong>of</strong> <strong>the</strong> city <strong>of</strong><br />
Mumbai grew at 1.5 per cent annually from 1991<br />
to 2001, but <strong>the</strong> brand new satellite city <strong>of</strong> Navi<br />
Mumbai grew at <strong>the</strong> rate <strong>of</strong> 6.9 per cent. A survey<br />
<strong>in</strong> 2000 estimated that 43 per cent <strong>of</strong> <strong>the</strong> families<br />
currently settled <strong>in</strong> Navi Mumbai migrated from<br />
Mumbai. Similarly, New Delhi (not <strong>in</strong>clud<strong>in</strong>g <strong>the</strong><br />
whole metropolitan area) experienced negative<br />
populati<strong>on</strong> growth between 1991 and 2001 but<br />
Noida, a city adjacent to New Delhi and home to<br />
a part <strong>of</strong> <strong>the</strong> Delhi workforce, grew at 5.8 per cent<br />
per year. The same was true <strong>of</strong> many o<strong>the</strong>r feeder<br />
towns <strong>in</strong> and around New Delhi (UN-HABITAT<br />
2008).<br />
While <strong>the</strong> big cities and urban agglomerati<strong>on</strong>s<br />
have been grow<strong>in</strong>g, underly<strong>in</strong>g processes have also<br />
led to <strong>the</strong> growth <strong>of</strong> large numbers <strong>of</strong> slums across<br />
<strong>the</strong> country’s urban centres.<br />
1.2.3 Slums<br />
The Census <strong>of</strong> <strong>India</strong> 2001 def<strong>in</strong>es slums as<br />
follows:<br />
i.<br />
Figure 1.1 Growth <strong>of</strong> City by Size Class<br />
Percentage <strong>of</strong> urban<br />
populati<strong>on</strong> by size class I<br />
Percentage <strong>of</strong> urban<br />
populati<strong>on</strong> by size class II<br />
Percentage <strong>of</strong> urban<br />
populati<strong>on</strong> by size class III<br />
Percentage <strong>of</strong> urban<br />
populati<strong>on</strong> by size class IV<br />
Percentage <strong>of</strong> urban<br />
populati<strong>on</strong> by size class V<br />
Percentage <strong>of</strong> urban<br />
populati<strong>on</strong> by size class VI<br />
All specified areas <strong>in</strong> a town or<br />
city notified as ‘Slum’ by <strong>State</strong>, UT<br />
Adm<strong>in</strong>istrati<strong>on</strong> or Local Government<br />
under any Act <strong>in</strong>clud<strong>in</strong>g a ‘Slum Act’.
ii.<br />
All areas recognised as ‘Slum’ by<br />
<strong>State</strong>, UT Adm<strong>in</strong>istrati<strong>on</strong> or Local<br />
Government, Hous<strong>in</strong>g and Slum<br />
Boards, which may have not been<br />
formally notified as slum under any act;<br />
iii. A compact area <strong>of</strong> at least 300 populati<strong>on</strong><br />
or about 60-70 households <strong>of</strong> poorly<br />
built c<strong>on</strong>gested tenements, <strong>in</strong> unhygienic<br />
envir<strong>on</strong>ment usually with <strong>in</strong>adequate<br />
<strong>in</strong>frastructure and lack<strong>in</strong>g <strong>in</strong> proper<br />
sanitary and dr<strong>in</strong>k<strong>in</strong>g water facilities.<br />
The slum populati<strong>on</strong> <strong>in</strong> <strong>India</strong> was estimated<br />
at 61.82 milli<strong>on</strong> <strong>in</strong> 2001 by <strong>the</strong> Census. While this<br />
was <strong>the</strong> estimate <strong>of</strong> slum populati<strong>on</strong> for <strong>the</strong> country<br />
as a whole, 640 towns, each with a populati<strong>on</strong><br />
exceed<strong>in</strong>g 50,000, reported a total slum populati<strong>on</strong><br />
<strong>of</strong> 42.58 milli<strong>on</strong> based <strong>on</strong> enumerati<strong>on</strong>. This figure<br />
c<strong>on</strong>stituted 23.1 percent <strong>of</strong> <strong>the</strong> populati<strong>on</strong> <strong>of</strong> <strong>the</strong>se<br />
towns.<br />
It is to be noted that both <strong>the</strong> 2001 Census<br />
and <strong>the</strong> Nati<strong>on</strong>al Sample Survey <strong>of</strong> 2002 estimated<br />
that every seventh pers<strong>on</strong> <strong>in</strong> urban <strong>India</strong> was a<br />
slum dweller. Out <strong>of</strong> <strong>the</strong> 640 towns report<strong>in</strong>g slum<br />
populati<strong>on</strong>s <strong>in</strong> 2001, <strong>the</strong>re was a c<strong>on</strong>siderable<br />
c<strong>on</strong>centrati<strong>on</strong> <strong>of</strong> slum populati<strong>on</strong> <strong>in</strong> 27 large cities,<br />
each with a populati<strong>on</strong> <strong>of</strong> <strong>on</strong>e milli<strong>on</strong> or more.<br />
These accounted for 41.6 per cent <strong>of</strong> <strong>the</strong> total<br />
slum populati<strong>on</strong> <strong>of</strong> <strong>the</strong> country. Greater Mumbai<br />
Municipal Corporati<strong>on</strong> al<strong>on</strong>e accounted for <strong>on</strong>eseventh<br />
<strong>of</strong> <strong>India</strong>’s slum populati<strong>on</strong> while <strong>the</strong> four<br />
metropolitan municipal corporati<strong>on</strong>s <strong>of</strong> Greater<br />
Mumbai, Delhi, Kolkata and Chennai toge<strong>the</strong>r<br />
accounted for 25 per cent. These four cities also<br />
accounted for 60 per cent <strong>of</strong> <strong>the</strong> total populati<strong>on</strong><br />
liv<strong>in</strong>g <strong>in</strong> cities with a populati<strong>on</strong> <strong>of</strong> <strong>on</strong>e milli<strong>on</strong> or<br />
more (Chandramouli 2003).<br />
INTRODUCTION AND OVERVIEW 5<br />
Slums have particular relevance <strong>in</strong> <strong>the</strong> c<strong>on</strong>text<br />
<strong>of</strong> urban food security. This has been recognised<br />
<strong>in</strong> <strong>the</strong> articulati<strong>on</strong> <strong>of</strong> <strong>the</strong> Millenium Development<br />
Goals (MDG). One <strong>of</strong> <strong>the</strong> MDGs is to improve <strong>the</strong><br />
lives <strong>of</strong> at least 100 milli<strong>on</strong> slum dwellers. Also,<br />
Goal 7 <strong>of</strong> MDGs talks <strong>of</strong> ‘halv<strong>in</strong>g <strong>the</strong> proporti<strong>on</strong><br />
<strong>of</strong> people without susta<strong>in</strong>able access to safe<br />
dr<strong>in</strong>k<strong>in</strong>g water and basic sanitati<strong>on</strong> by 2015’ and<br />
achiev<strong>in</strong>g 100 per cent access by 2025, which <strong>in</strong><br />
<strong>the</strong> urban sett<strong>in</strong>g is a challenge primarily related<br />
to slums. S<strong>in</strong>ce urban food security is especially<br />
about <strong>the</strong> access and absorpti<strong>on</strong> aspects <strong>of</strong> food<br />
and nutriti<strong>on</strong>, <strong>the</strong> prevalence <strong>of</strong> slums becomes an<br />
important issue.<br />
1.2.4 <strong>Urban</strong> Poverty<br />
Poverty as <strong>of</strong>ficially measured – <strong>in</strong> <strong>the</strong> <strong>India</strong>n<br />
c<strong>on</strong>text, <strong>in</strong> terms <strong>of</strong> a household’s m<strong>on</strong>thly per capita<br />
c<strong>on</strong>sumer expenditure – is not identical with food<br />
and nutriti<strong>on</strong> <strong>in</strong>security. <strong>Food</strong> and nutriti<strong>on</strong> security<br />
relate not <strong>on</strong>ly to <strong>the</strong> <strong>in</strong>take <strong>of</strong> food that would<br />
provide <strong>the</strong> required calories but also <strong>the</strong> effective<br />
biological utilisati<strong>on</strong> <strong>of</strong> food by <strong>the</strong> <strong>in</strong>dividual. So,<br />
it is clearly not coterm<strong>in</strong>ous with poverty 1 . Also,<br />
<strong>on</strong> <strong>the</strong> o<strong>the</strong>r side, a mean<strong>in</strong>gful measure <strong>of</strong> poverty<br />
would recognise <strong>the</strong> multidimensi<strong>on</strong>al nature<br />
<strong>of</strong> poverty and thus not limit it to food security<br />
<strong>in</strong> <strong>the</strong> sense <strong>of</strong> a specified level <strong>of</strong> calorie <strong>in</strong>take.<br />
Never<strong>the</strong>less, poverty and food <strong>in</strong>security are<br />
clearly related, though not identical. It is <strong>the</strong>refore<br />
<strong>of</strong> <strong>in</strong>terest to take a brief look at trends <strong>in</strong> urban<br />
poverty <strong>in</strong> a discussi<strong>on</strong> <strong>of</strong> urban food security.<br />
Globally, <strong>the</strong>re is some evidence to suggest<br />
that poverty is gett<strong>in</strong>g ‘urbanised’. This is at least<br />
partly <strong>the</strong> result <strong>of</strong> <strong>in</strong>creas<strong>in</strong>g urbanisati<strong>on</strong> itself <strong>in</strong><br />
<strong>the</strong> sense <strong>of</strong> <strong>in</strong>crease <strong>in</strong> <strong>the</strong> proporti<strong>on</strong> <strong>of</strong> populati<strong>on</strong><br />
1 In additi<strong>on</strong>, Patnaik (2007, 2009) has drawn our attenti<strong>on</strong>, <strong>in</strong> <strong>the</strong> <strong>India</strong>n c<strong>on</strong>text, to <strong>the</strong> <strong>in</strong>creas<strong>in</strong>g disc<strong>on</strong>nect between <strong>the</strong> proporti<strong>on</strong> <strong>of</strong><br />
populati<strong>on</strong> with a m<strong>on</strong>thly per capita c<strong>on</strong>sumer expenditure level at <strong>the</strong> ‘poverty l<strong>in</strong>e’ ostensibly based <strong>on</strong> a calorie norm and <strong>the</strong> actual<br />
per capita calorie <strong>in</strong>take at that level <strong>of</strong> per capita expenditure, as brought out by a careful exam<strong>in</strong>ati<strong>on</strong> <strong>of</strong> NSSO data <strong>on</strong> c<strong>on</strong>sumer<br />
expenditure.
6 REPORT ON THE STATE OF FOOD INSECURITY IN URBAN INDIA<br />
liv<strong>in</strong>g <strong>in</strong> urban areas. But it also reflects <strong>in</strong>creas<strong>in</strong>g<br />
urban <strong>in</strong>equality whereby, even as per capita<br />
<strong>in</strong>comes <strong>in</strong> cities rise, <strong>the</strong> worsen<strong>in</strong>g distributi<strong>on</strong><br />
<strong>of</strong> <strong>in</strong>come and wealth serves to <strong>in</strong>crease <strong>the</strong><br />
numbers <strong>of</strong> <strong>the</strong> urban poor and possibly <strong>the</strong>ir share<br />
<strong>in</strong> urban populati<strong>on</strong>. In <strong>India</strong>, <strong>the</strong>re is evidence to<br />
suggest that <strong>the</strong> rate <strong>of</strong> reducti<strong>on</strong> <strong>in</strong> poverty has<br />
slowed down s<strong>in</strong>ce <strong>the</strong> <strong>on</strong>set <strong>of</strong> ec<strong>on</strong>omic reforms<br />
<strong>in</strong> 1991, and that this slow<strong>in</strong>g down is particularly<br />
significant <strong>in</strong> <strong>the</strong> case <strong>of</strong> urban <strong>India</strong>, even by <strong>the</strong><br />
<strong>of</strong>ficial poverty count.<br />
Us<strong>in</strong>g <strong>the</strong> uniform recall period, <strong>the</strong><br />
populati<strong>on</strong> below <strong>the</strong> poverty l<strong>in</strong>e <strong>in</strong> urban <strong>India</strong> is<br />
estimated to have risen from 7.63 crores <strong>in</strong> 1993-<br />
94 to 8.08 crores <strong>in</strong> 2004-05 (Damodaran 2007).<br />
The Nati<strong>on</strong>al <strong>Urban</strong> Hous<strong>in</strong>g and Habitat Policy<br />
2007, which goes by <strong>the</strong> <strong>of</strong>ficial poverty count,<br />
notes that:<br />
Poverty <strong>in</strong> <strong>India</strong> has decl<strong>in</strong>ed from 320.3<br />
milli<strong>on</strong> <strong>in</strong> 1993-94 to 301.7 milli<strong>on</strong> <strong>in</strong> 2004-<br />
05. While <strong>the</strong>re has been a decl<strong>in</strong>e <strong>of</strong> 18 milli<strong>on</strong><br />
pers<strong>on</strong>s <strong>in</strong> <strong>the</strong> total numbers <strong>of</strong> <strong>the</strong> poor <strong>in</strong> <strong>India</strong>,<br />
<strong>the</strong> NSSO reports that <strong>the</strong> number <strong>of</strong> <strong>the</strong> urban<br />
poor has risen by 4.4 milli<strong>on</strong> pers<strong>on</strong>s dur<strong>in</strong>g <strong>the</strong><br />
same period. One fourth <strong>of</strong> <strong>the</strong> country’s total<br />
urban populati<strong>on</strong>, number<strong>in</strong>g 80.7 milli<strong>on</strong> pers<strong>on</strong>s<br />
is below <strong>the</strong> poverty l<strong>in</strong>e. The urban poor c<strong>on</strong>stitute<br />
26.7 per cent <strong>of</strong> <strong>the</strong> total poor <strong>in</strong> <strong>the</strong> country. The<br />
fact that <strong>the</strong> number <strong>of</strong> urban poor has risen is <strong>in</strong><br />
stark c<strong>on</strong>trast with rural poverty, where both <strong>the</strong><br />
total number <strong>of</strong> rural poor and its <strong>in</strong>cidence visà-vis<br />
<strong>the</strong> rural populati<strong>on</strong> has fallen (Plann<strong>in</strong>g<br />
Commissi<strong>on</strong> 2007).<br />
Leav<strong>in</strong>g aside <strong>the</strong> claim that <strong>the</strong> numbers <strong>of</strong><br />
poor people <strong>in</strong> <strong>the</strong> country as a whole as well as<br />
<strong>in</strong> its rural areas have decl<strong>in</strong>ed between 1993-94<br />
and 2004-05, what is strik<strong>in</strong>g about <strong>the</strong> passage<br />
quoted is that it provides <strong>of</strong>ficial recogniti<strong>on</strong> <strong>of</strong> <strong>the</strong><br />
<strong>in</strong>crease <strong>in</strong> <strong>the</strong> number <strong>of</strong> urban poor.<br />
2 ‘ppa’ refers to percentage po<strong>in</strong>t reducti<strong>on</strong> per annum<br />
Similarly, c<strong>on</strong>f<strong>in</strong><strong>in</strong>g <strong>the</strong>mselves to <strong>the</strong><br />
<strong>of</strong>ficial method <strong>of</strong> measur<strong>in</strong>g poverty, Sen and<br />
Himanshu po<strong>in</strong>t out that ‘….poverty reducti<strong>on</strong> by<br />
comparable uniform recall period (URP) between<br />
1993-94 and 2004-05 was 0.82 ppa 2 <strong>in</strong> rural areas<br />
and 0.30 ppa <strong>in</strong> urban areas, so that <strong>the</strong> rural poverty<br />
reducti<strong>on</strong> rate appears to have <strong>in</strong>creased but urban<br />
poverty reducti<strong>on</strong> decreased <strong>on</strong>ce comparis<strong>on</strong>s<br />
are so shifted, avoid<strong>in</strong>g <strong>the</strong> period <strong>of</strong> disrupti<strong>on</strong><br />
immediately follow<strong>in</strong>g <strong>the</strong> reforms <strong>of</strong> 1991’ (Sen<br />
and Himanshu 2007).<br />
Utsa Patnaik argues that ‘directly measured<br />
by count<strong>in</strong>g <strong>the</strong> pers<strong>on</strong>s unable to access <strong>the</strong> <strong>of</strong>ficial<br />
nutriti<strong>on</strong> norm <strong>of</strong> 2100 calories through <strong>the</strong>ir<br />
total m<strong>on</strong>thly spend<strong>in</strong>g <strong>on</strong> all goods and services,<br />
urban poverty decl<strong>in</strong>ed slightly between 1983 and<br />
1993-94, but has risen substantially between 1993-<br />
94 and 2004-05 while poverty depth has <strong>in</strong>creased.<br />
This is particularly evident <strong>in</strong> <strong>the</strong> states with <strong>the</strong><br />
c<strong>on</strong>urbati<strong>on</strong>s – Delhi, Mumbai, Chennai and<br />
Kolkata – while states with smaller urban centres<br />
have fared better’ (Patnaik 2009).<br />
Thus, while <strong>the</strong> <strong>of</strong>ficial head count ratio<br />
(HCR) <strong>of</strong> urban poverty decl<strong>in</strong>ed from 33.2 per<br />
cent <strong>in</strong> 1993-94 to 25.7 per cent <strong>in</strong> 2004-05, <strong>the</strong><br />
direct measure <strong>of</strong> HCR us<strong>in</strong>g <strong>the</strong> per capita calorie<br />
<strong>in</strong>take data rose from 57 per cent <strong>in</strong> 1993-94 to<br />
64.5 per cent <strong>in</strong> 2004-05.<br />
While <strong>the</strong> absolute number <strong>of</strong> <strong>the</strong> urban<br />
poor has risen dur<strong>in</strong>g <strong>the</strong> period between 1993-94<br />
and 2004-05 even by <strong>the</strong> uni-dimensi<strong>on</strong>al <strong>of</strong>ficial<br />
measure, several o<strong>the</strong>r aspects <strong>of</strong> poverty <strong>in</strong> urban<br />
areas also need to be taken <strong>in</strong>to account. A study <strong>of</strong><br />
<strong>the</strong> poor <strong>in</strong> Mumbai po<strong>in</strong>ts out that ‘… <strong>the</strong> urban<br />
poor are forced to settle <strong>on</strong> hazardous areas such<br />
as toxic dumps, near ref<strong>in</strong>eries, near railroads and<br />
highways. The slum habitats have no <strong>in</strong>frastructure<br />
to speak <strong>of</strong>. There is no sanitati<strong>on</strong> facility and<br />
no provisi<strong>on</strong> <strong>of</strong> dr<strong>in</strong>k<strong>in</strong>g water. In Mumbai <strong>the</strong>
sanitati<strong>on</strong> ratio is <strong>on</strong>e toilet seat per 500 <strong>in</strong>habitants’<br />
(Sridhar 2006). <strong>Urban</strong> poverty <strong>in</strong> Mumbai, it has<br />
also been observed, was ‘...characterised by nearly<br />
70 per cent households liv<strong>in</strong>g <strong>in</strong> flimsy shacks<br />
and temporary dwell<strong>in</strong>gs, 2m x 2m hous<strong>in</strong>g space<br />
per pers<strong>on</strong>, 28 LPCD water c<strong>on</strong>sumpti<strong>on</strong>, 1.5<br />
per cent households hav<strong>in</strong>g access to sewer and<br />
<strong>on</strong>ly half <strong>of</strong> <strong>the</strong> people hav<strong>in</strong>g access to toilets.<br />
Similarly, health status was shown as nearly 11 per<br />
cent people sick at any po<strong>in</strong>t <strong>of</strong> time; and TB and<br />
asthma patients number<strong>in</strong>g as many as 18 and 11<br />
per thousand populati<strong>on</strong> respectively. The annual<br />
(number <strong>of</strong>) cases <strong>of</strong> water-related diseases such<br />
as diarrhoea, typhoid and malaria is estimated<br />
as 614,68,126 per thousand <strong>of</strong> populati<strong>on</strong><br />
respectively’ (Karn et al. 2003). More generally,<br />
it is known that <strong>on</strong>ly about 18.5 per cent <strong>of</strong> <strong>the</strong><br />
urban poor have access to piped water at home as<br />
compared to 62.2 per cent <strong>of</strong> <strong>the</strong> “urban not poor”<br />
and less than half <strong>of</strong> urban poor households have<br />
sanitary facilities (NFHS 2007).<br />
It has been suggested that ‘although <strong>the</strong><br />
recent urban growth was much higher than <strong>in</strong> <strong>the</strong><br />
past, not <strong>on</strong>ly was this associated with <strong>in</strong>creased<br />
urban <strong>in</strong>equality but also many urban areas failed<br />
to <strong>of</strong>fer ei<strong>the</strong>r l<strong>in</strong>kage to <strong>the</strong>ir rural h<strong>in</strong>terlands or<br />
escape for <strong>the</strong> rural poor. This suggests that urban<br />
poverty is a phenomen<strong>on</strong> <strong>in</strong> itself, ra<strong>the</strong>r than a<br />
mere overflow <strong>of</strong> rural poverty’ (Awasthi et al.<br />
2009). Child, <strong>in</strong>fant and ne<strong>on</strong>atal survival am<strong>on</strong>g<br />
<strong>the</strong> urban poor was similar to those <strong>of</strong> <strong>the</strong> rural<br />
populati<strong>on</strong>. In many <strong>State</strong>s, undernutriti<strong>on</strong> am<strong>on</strong>g<br />
urban poor children was worse than <strong>in</strong> rural areas<br />
(Agarwal and Sangar 2005).<br />
Dur<strong>in</strong>g <strong>the</strong> period <strong>of</strong> ec<strong>on</strong>omic reforms <strong>in</strong><br />
<strong>India</strong>, it is clear that <strong>the</strong> annual compound rate <strong>of</strong><br />
growth <strong>of</strong> GDP s<strong>in</strong>ce 1991 has been impressive at<br />
over 6 per cent. However, with <strong>in</strong>creas<strong>in</strong>g urban<br />
<strong>in</strong>equality, it appears that urban poverty has not<br />
decl<strong>in</strong>ed significantly. What can be said about <strong>the</strong><br />
trends <strong>in</strong> food security dur<strong>in</strong>g this period?<br />
INTRODUCTION AND OVERVIEW 7<br />
1.2.5 <strong>Urban</strong> Livelihoods: Dom<strong>in</strong>ance <strong>of</strong><br />
<strong>the</strong> Informal Sector<br />
The overall global food security situati<strong>on</strong> has<br />
worsened <strong>in</strong> recent years and <strong>the</strong> trend <strong>of</strong> decl<strong>in</strong>e <strong>in</strong><br />
<strong>the</strong> number <strong>of</strong> hungry pers<strong>on</strong>s has been reversed. In<br />
most develop<strong>in</strong>g countries, <strong>the</strong>re has been a rise <strong>in</strong><br />
<strong>the</strong> number <strong>of</strong> undernourished pers<strong>on</strong>s, with <strong>on</strong>ly a<br />
few countries such as Ch<strong>in</strong>a and Vietnam show<strong>in</strong>g<br />
significant absolute decl<strong>in</strong>e (FAO 2009). With<strong>in</strong><br />
this c<strong>on</strong>text, urban food security has also become<br />
a greater challenge than earlier. In an analysis <strong>of</strong><br />
nati<strong>on</strong>ally representative c<strong>on</strong>sumpti<strong>on</strong>/expenditure<br />
surveys from ten African countries, <strong>the</strong> percentage<br />
<strong>of</strong> <strong>the</strong> populati<strong>on</strong> found to be energy deficient<br />
surpris<strong>in</strong>gly turned out to be higher <strong>in</strong> urban areas<br />
<strong>in</strong> six <strong>of</strong> <strong>the</strong> ten countries studied (Ruel and Garrett<br />
2004).<br />
<strong>Urban</strong> areas typically have more retail<br />
outlets and average urban <strong>in</strong>comes make stock<strong>in</strong>g<br />
<strong>of</strong> food viable. This may generally imply that<br />
physical availability <strong>of</strong> food is not a critical issue<br />
<strong>in</strong> urban sett<strong>in</strong>gs except when <strong>the</strong>re is severe<br />
overall physical shortage and unavailability <strong>in</strong> <strong>the</strong><br />
ec<strong>on</strong>omy as a whole. However, both access and<br />
absorpti<strong>on</strong> pose serious challenges for urban food<br />
security.<br />
The two most important factors that<br />
determ<strong>in</strong>e <strong>the</strong> access <strong>of</strong> a household to food<br />
are household <strong>in</strong>come and prevail<strong>in</strong>g prices <strong>of</strong><br />
essentials. Income, <strong>in</strong> turn, depends <strong>on</strong> ownership<br />
and utilisati<strong>on</strong> <strong>of</strong> productive assets as well as <strong>on</strong><br />
access to remunerative employment.<br />
It is well recognised that even <strong>in</strong> many<br />
ec<strong>on</strong>omies experienc<strong>in</strong>g rapid rates <strong>of</strong> GDP<br />
growth, <strong>the</strong> accompany<strong>in</strong>g urbanisati<strong>on</strong> does not<br />
automatically translate <strong>in</strong>to similar growth <strong>in</strong><br />
better-paid and more stable employment. It has<br />
been po<strong>in</strong>ted out that <strong>in</strong> most urban areas, ‘…<br />
employment opportunities <strong>in</strong> <strong>the</strong> <strong>in</strong>formal sector are<br />
grow<strong>in</strong>g, while those <strong>in</strong> <strong>the</strong> formal sector are rapidly
8 REPORT ON THE STATE OF FOOD INSECURITY IN URBAN INDIA<br />
shr<strong>in</strong>k<strong>in</strong>g. The absence <strong>of</strong> formal employment<br />
limits <strong>the</strong> livelihood opportunities available to <strong>the</strong><br />
urban poor. Informal-sector employment is highly<br />
unstable, poorly remunerated and susceptible to<br />
seas<strong>on</strong>al variati<strong>on</strong>s. Much <strong>of</strong> <strong>the</strong> <strong>in</strong>formal-sector<br />
activity takes place outdoors (c<strong>on</strong>structi<strong>on</strong>, street<br />
vend<strong>in</strong>g, or rickshaw draw<strong>in</strong>g) mak<strong>in</strong>g <strong>the</strong> ra<strong>in</strong>y<br />
seas<strong>on</strong> an especially difficult period.’ Moreover,<br />
even where urban agriculture or rural to urban<br />
food transfers are significant, most food <strong>in</strong> urban<br />
areas is purchased, ‘highlight<strong>in</strong>g <strong>the</strong> importance<br />
<strong>of</strong> markets and <strong>in</strong>come-earn<strong>in</strong>g opportunities to<br />
urban livelihoods and household food security’<br />
(UNWFP 2002).<br />
Ruel and Garret (2004) observe that ‘<strong>the</strong><br />
poor work <strong>in</strong> a variety <strong>of</strong> jobs, but work<strong>in</strong>g l<strong>on</strong>g<br />
hours <strong>in</strong> <strong>of</strong>ten precarious c<strong>on</strong>diti<strong>on</strong>s for low wages<br />
is a c<strong>on</strong>stant. Jobs tend to be irregular and tenure<br />
<strong>in</strong>secure. The poor may work <strong>in</strong> clo<strong>the</strong>s factories,<br />
run small shops, sell food or cigarettes <strong>in</strong> <strong>the</strong> street,<br />
scavenge <strong>in</strong> rubbish dumps, sweep streets and<br />
clean latr<strong>in</strong>es, drive rickshaws, or seek day work<br />
<strong>in</strong> c<strong>on</strong>structi<strong>on</strong>’.<br />
The ESCAP report <strong>on</strong> poverty reducti<strong>on</strong><br />
argues that ‘urban food security depends <strong>on</strong><br />
issues related to access and utilisati<strong>on</strong> ra<strong>the</strong>r than<br />
availability…. In many cases, <strong>the</strong> urban poor pay<br />
up to 30 per cent more for <strong>the</strong>ir food than <strong>the</strong> rural<br />
poor, and spend 60 per cent or more <strong>of</strong> <strong>the</strong>ir total<br />
expenditure <strong>on</strong> food’ (ESCAP 2007).<br />
The <strong>India</strong>n experience with urbanisati<strong>on</strong><br />
dur<strong>in</strong>g <strong>the</strong> period <strong>of</strong> ec<strong>on</strong>omic reforms has shown<br />
that urban <strong>in</strong>equality has <strong>in</strong>creased. Access to<br />
productive assets is ei<strong>the</strong>r m<strong>in</strong>imal or n<strong>on</strong>-existent<br />
for a majority <strong>of</strong> urban households. A significant<br />
secti<strong>on</strong> <strong>of</strong> <strong>the</strong> urban populati<strong>on</strong> does not even<br />
own a place <strong>of</strong> shelter, not to speak <strong>of</strong> ownership<br />
<strong>of</strong> productive assets. With more than 23 per cent<br />
<strong>of</strong> <strong>the</strong> urban populati<strong>on</strong> liv<strong>in</strong>g <strong>in</strong> slums, and this<br />
percentage be<strong>in</strong>g much higher for metropolitan<br />
cities like Mumbai (54 per cent), a substantial<br />
chunk <strong>of</strong> <strong>the</strong> urban populati<strong>on</strong> faces highly <strong>in</strong>secure<br />
tenure <strong>in</strong> respect <strong>of</strong> shelter.<br />
The emerg<strong>in</strong>g picture <strong>in</strong> terms <strong>of</strong> employment<br />
and earn<strong>in</strong>gs is also discourag<strong>in</strong>g. The rate <strong>of</strong><br />
growth <strong>of</strong> urban employment fell from 3.20 per<br />
cent per annum compound from1983 to 1993-94<br />
to 3.12 per cent between 1993-94 and 2004-05.<br />
The growth <strong>in</strong> employment between 1993-94 and<br />
2004-05 c<strong>on</strong>sisted <strong>of</strong> two dist<strong>in</strong>ct and c<strong>on</strong>trast<strong>in</strong>g<br />
phases. Between 1993-94 and 1999-2000, <strong>the</strong><br />
growth <strong>of</strong> employment was very slow. Between<br />
1999-2000 and 2004-05, employment grew<br />
much more rapidly, but most <strong>of</strong> this growth was<br />
<strong>in</strong> self-employment, with low average earn<strong>in</strong>gs,<br />
reflect<strong>in</strong>g more <strong>of</strong> distress and lack <strong>of</strong> access to<br />
better-paid wage employment than <strong>of</strong> expansi<strong>on</strong> <strong>in</strong><br />
productive self-employment opportunities. Most<br />
<strong>of</strong> <strong>the</strong> growth <strong>in</strong> employment – nearly all <strong>of</strong> it,<br />
<strong>in</strong> fact – between 1999-2000 and 2004-05 was <strong>in</strong><br />
<strong>in</strong>formal employment, which carries no provisi<strong>on</strong><br />
<strong>of</strong> any social security. The total employment figure,<br />
<strong>in</strong>clud<strong>in</strong>g both rural and urban areas, between 1999-<br />
2000 and 2004-05 was 59.3 milli<strong>on</strong>. Of this, 57.9<br />
milli<strong>on</strong> was <strong>in</strong> <strong>the</strong> category <strong>of</strong> <strong>in</strong>formal employment<br />
– both self- and wage-paid. As <strong>the</strong> NCEUS f<strong>in</strong>al<br />
report po<strong>in</strong>ts out: ‘Although employment <strong>in</strong>creased<br />
by 14 per cent <strong>in</strong> <strong>the</strong> organised sector over this<br />
period, <strong>the</strong> entire <strong>in</strong>crease has been mostly <strong>in</strong>formal<br />
<strong>in</strong> nature, i.e., without any job or social security.’<br />
More than three-fourths <strong>of</strong> wage workers <strong>in</strong><br />
agriculture (77 per cent) and all workers <strong>in</strong> n<strong>on</strong>agriculture<br />
(75 per cent) were ei<strong>the</strong>r landless or<br />
land-poor (NCEUS 2009).
INTRODUCTION AND OVERVIEW 9<br />
Populati<strong>on</strong><br />
Segments<br />
Worker Status<br />
1983 to 1993-94<br />
Agriculture N<strong>on</strong>-Agriculture<br />
1993-94 to 2004-05<br />
Agriculture N<strong>on</strong>-Agriculture<br />
Rural male Regular 4.6<br />
4.4<br />
4.1<br />
2.6<br />
Casual 3.6<br />
4.0<br />
2.2<br />
2.4<br />
Rural female<br />
Regular 2.5<br />
3.5<br />
3.4<br />
3.1<br />
Casual 3.6<br />
4.1<br />
2.2<br />
3.8<br />
<strong>Urban</strong> male<br />
Regular 4.5<br />
3.1<br />
0.2<br />
2.0<br />
Casual 2.1<br />
2.3<br />
0.9<br />
1.2<br />
<strong>Urban</strong> female<br />
Regular 5.0<br />
4.0<br />
0.2<br />
1.9<br />
Casual 3.1<br />
3.6<br />
0.5<br />
1.6<br />
Growth rate <strong>in</strong> GDP 2.8 6.1 2.5 7.5<br />
Source: NCEUS 2009<br />
What is <strong>the</strong> story <strong>on</strong> earn<strong>in</strong>gs? The growth<br />
rates <strong>of</strong> daily earn<strong>in</strong>gs <strong>of</strong> workers has been<br />
reproduced <strong>in</strong> Table 1.1. The data show that<br />
<strong>the</strong> growth rate <strong>of</strong> average daily earn<strong>in</strong>gs for all<br />
categories <strong>of</strong> urban wage workers – male or female,<br />
regular or casual, work<strong>in</strong>g <strong>in</strong> agriculture or n<strong>on</strong>agriculture<br />
– has decl<strong>in</strong>ed significantly between<br />
1983 to1993-94 and 1993-94 to 2004-05.<br />
From 1999-2000 to 2004-05, <strong>the</strong><br />
average daily earn<strong>in</strong>gs for almost all categories<br />
<strong>of</strong> paid urban workers (male and female,<br />
<strong>in</strong> agriculture and <strong>in</strong> n<strong>on</strong>-agriculture) – with<br />
<strong>the</strong> t<strong>in</strong>y excepti<strong>on</strong> <strong>of</strong> women workers <strong>in</strong><br />
agriculture <strong>in</strong> urban areas – has actually<br />
decl<strong>in</strong>ed <strong>in</strong> real terms. This is shown <strong>in</strong><br />
Table 1.2.<br />
Table 1.2<br />
Growth Rate <strong>of</strong> Average Daily Earn<strong>in</strong>gs <strong>of</strong> Workers <strong>in</strong> <strong>the</strong> Age Group 15-59 Years<br />
(1993-94 Prices) between 1999-2000 and 2004-05, <strong>India</strong><br />
Populati<strong>on</strong> Segments Status Agriculture N<strong>on</strong>-Agriculture<br />
Rural male<br />
Rural female<br />
<strong>Urban</strong> male<br />
<strong>Urban</strong> female<br />
Source: NCEUS 2009<br />
Table 1.1<br />
Growth Rates <strong>of</strong> Daily Earn<strong>in</strong>gs <strong>of</strong> Workers Aged 15-59 Years <strong>in</strong> <strong>India</strong><br />
Regular salaried -1.44 -0.58<br />
Casual workers 1.74 1.04<br />
Regular salaried 0.32 -10.79<br />
Casual workers 1.40 1.89<br />
Regular Salaried -10.92 -0.98<br />
Casual workers -1.30 -0.57<br />
Regular salaried 0.36 -4.70<br />
Casual workers -2.38 -0.82
10 REPORT ON THE STATE OF FOOD INSECURITY IN URBAN INDIA<br />
The situati<strong>on</strong> <strong>of</strong> self-employed is possibly<br />
worse <strong>in</strong> many respects than even that <strong>of</strong> <strong>the</strong> casual<br />
workers. For <strong>in</strong>stance, accord<strong>in</strong>g to data analysed by<br />
NCEUS, <strong>the</strong> average daily <strong>in</strong>come <strong>of</strong> a male vendor<br />
was Rs.70 <strong>in</strong> most cities while women vendors<br />
earned an even more paltry Rs.40 per day, and this<br />
is despite l<strong>on</strong>g hours <strong>of</strong> work. The picture was hardly<br />
any different for urban rickshaw pullers.<br />
NCEUS estimates <strong>the</strong> urban labour force<br />
at 119.7 milli<strong>on</strong>s (Males 94.0m, Females 25.7m)<br />
and <strong>the</strong> urban workforce at 114.3 milli<strong>on</strong>s. (Males<br />
90.37m, Females 23.99m). Of <strong>the</strong> urban work force<br />
<strong>in</strong> 2004-05, 45.16 per cent were self-employed<br />
(Males 44.62 per cent, Females 47.19 per cent),<br />
up from 42.24 per cent <strong>in</strong> 1993-94. Am<strong>on</strong>g <strong>the</strong><br />
urban self-employed, nearly two-thirds were own<br />
account workers or employers and <strong>the</strong> rema<strong>in</strong><strong>in</strong>g<br />
were unpaid family workers. But <strong>the</strong>se proporti<strong>on</strong>s<br />
were very different between men and women, with<br />
<strong>on</strong>ly a fifth <strong>of</strong> <strong>the</strong> male self-employed be<strong>in</strong>g unpaid<br />
family workers as aga<strong>in</strong>st nearly half for females.<br />
As po<strong>in</strong>ted out by <strong>the</strong> NCEUS f<strong>in</strong>al report: ‘In n<strong>on</strong>agriculture,<br />
majority <strong>of</strong> <strong>the</strong> self-employed are own<br />
account workers i.e., work<strong>in</strong>g as t<strong>in</strong>y enterprises<br />
<strong>of</strong>ten with <strong>the</strong> help <strong>of</strong> family labour or with <strong>on</strong>e or<br />
two workers, although women “helpers” or “unpaid<br />
workers” predom<strong>in</strong>ate’ (NCEUS 2009). Most <strong>of</strong><br />
<strong>the</strong>se own account workers operate <strong>on</strong> an extremely<br />
small scale, and at very low productivity. A high<br />
percentage <strong>of</strong> ‘own account enterprises' (OAEs)<br />
were engaged <strong>in</strong> a struggle for survival ra<strong>the</strong>r than<br />
be<strong>in</strong>g pr<strong>of</strong>it-oriented bus<strong>in</strong>ess enterprises.<br />
The data from <strong>the</strong> Ec<strong>on</strong>omic Census <strong>of</strong> 2005<br />
estimated <strong>the</strong> total number <strong>of</strong> urban enterprises<br />
at 16.135 milli<strong>on</strong>. Only 2.2 per cent <strong>of</strong> all urban<br />
enterprises employed 10 or more workers while<br />
nearly <strong>on</strong>e-sixth operated without any premises. The<br />
estimated numbers employed <strong>in</strong> <strong>the</strong>se enterprises<br />
amounted to 48.8 milli<strong>on</strong>, <strong>of</strong> whom 63.6 per cent<br />
were hired workers and <strong>the</strong> rest self-employed.<br />
Of <strong>the</strong> total number <strong>of</strong> pers<strong>on</strong>s employed, about<br />
<strong>on</strong>e-seventh c<strong>on</strong>sisted <strong>of</strong> females. These figures<br />
make clear that most enterprises were t<strong>in</strong>y and<br />
unlikely to have provided comfortable levels <strong>of</strong><br />
<strong>in</strong>come for <strong>the</strong>ir owners and workers alike. While<br />
systematic and comprehensive data <strong>on</strong> <strong>the</strong> earn<strong>in</strong>gs<br />
<strong>of</strong> <strong>the</strong> self-employed are not available, <strong>in</strong>terest<strong>in</strong>g<br />
nuggets <strong>of</strong> <strong>in</strong>formati<strong>on</strong> from NCEUS <strong>on</strong> <strong>the</strong>ir<br />
work<strong>in</strong>g c<strong>on</strong>diti<strong>on</strong>s are very likely not atypical.<br />
For handloom workers, who may number around<br />
3 milli<strong>on</strong> <strong>in</strong>clud<strong>in</strong>g both rural and urban areas,<br />
‘a major c<strong>on</strong>stra<strong>in</strong>t was <strong>the</strong> poor and traditi<strong>on</strong>al<br />
premises <strong>in</strong> which <strong>the</strong> looms were set up. The<br />
thatched ro<strong>of</strong>, if not repaired regularly, resulted<br />
<strong>in</strong> leakage. The water drops sta<strong>in</strong>ed <strong>the</strong> cloth and<br />
rendered large losses. The orders for such sta<strong>in</strong>ed<br />
products were <strong>of</strong>ten cancelled.’ Ano<strong>the</strong>r important<br />
category <strong>of</strong> self-employment was street vend<strong>in</strong>g.<br />
‘The number <strong>of</strong> street vendors ranges from 1.5<br />
-2 lakhs <strong>in</strong> metropolis like Mumbai and Kolkata<br />
to 30000 <strong>in</strong> small cities like Bhubaneswar…The<br />
SCs and o<strong>the</strong>r backward castes dom<strong>in</strong>ate <strong>the</strong><br />
trade. Approximately 25-30 per cent <strong>of</strong> <strong>the</strong> street<br />
vendors <strong>in</strong> <strong>the</strong> cities are illiterates and ano<strong>the</strong>r 20-<br />
24 per cent has <strong>on</strong>ly primary educati<strong>on</strong>.’ (NCEUS<br />
2009) Rickshaw pullers, ano<strong>the</strong>r significant<br />
category, are primarily migrants. They generally<br />
own no land and have a low level <strong>of</strong> literacy. In <strong>the</strong><br />
compell<strong>in</strong>g descripti<strong>on</strong> <strong>of</strong> NCEUS: ‘Most <strong>of</strong> <strong>the</strong><br />
rickshaw pullers stay <strong>in</strong> jhuggies or unauthorised<br />
col<strong>on</strong>ies, owner’s workshops or below staircases,<br />
<strong>on</strong> footpaths, under hang<strong>in</strong>g balc<strong>on</strong>ies <strong>on</strong> <strong>the</strong><br />
roadside, <strong>in</strong> <strong>the</strong> rickshaws or even <strong>in</strong> open space.<br />
The stressful life with no rest day coupled with<br />
unhygienic liv<strong>in</strong>g c<strong>on</strong>diti<strong>on</strong>s and limited food<br />
results <strong>in</strong> poor health <strong>of</strong> most workers. Diseases<br />
like backache, tuberculosis, asthma, hernia, weak<br />
eyesight and underweight are comm<strong>on</strong>. They have<br />
no medical <strong>in</strong>surance or access to health care<br />
facilities…’. The self-employed operat<strong>in</strong>g small<br />
and t<strong>in</strong>y units c<strong>on</strong>fr<strong>on</strong>t a situati<strong>on</strong> <strong>of</strong> ‘…a very low<br />
penetrati<strong>on</strong> <strong>of</strong> formal credit, low overall access to<br />
credit, and a high unmet credit need’.
Rustagi et al. (2009) po<strong>in</strong>t out that ‘<strong>the</strong><br />
urban areas have registered a decl<strong>in</strong>e <strong>in</strong> <strong>the</strong><br />
casual employment, even for poor women. An<br />
<strong>in</strong>creas<strong>in</strong>g trend <strong>of</strong> recourse to self-employment<br />
is noted with a majority <strong>of</strong> poor women work<strong>in</strong>g<br />
as helpers <strong>in</strong> household enterprises’.<br />
F<strong>in</strong>ally, while data <strong>on</strong> <strong>the</strong> earn<strong>in</strong>gs <strong>of</strong> <strong>the</strong><br />
self-employed are not readily available, <strong>the</strong><br />
fact that when <strong>in</strong>terviewed and asked what <strong>the</strong>y<br />
would c<strong>on</strong>sider a satisfactory level <strong>of</strong> earn<strong>in</strong>g<br />
from <strong>the</strong>ir self employment, half <strong>of</strong> <strong>the</strong>m<br />
reported a figure <strong>of</strong> Rs.3000 a year, which<br />
amounts to less than Rs.8 a day3 !<br />
While <strong>the</strong> discussi<strong>on</strong> has been <strong>on</strong> <strong>the</strong><br />
situati<strong>on</strong> <strong>of</strong> those <strong>in</strong> paid employment and those<br />
<strong>in</strong> self-employment, it must also be noted that<br />
over 1993-94 to 2004-05, <strong>the</strong> unemployment<br />
INTRODUCTION AND OVERVIEW 11<br />
rate as measured by <strong>the</strong> current daily status has<br />
g<strong>on</strong>e up. This is evident for <strong>the</strong> period 1993-<br />
94 to 1999-2000, when, as shown <strong>in</strong> Table 1.3,<br />
both urban and rural employment growth rates<br />
fell sharply compared to 1987-88 to<br />
1993-94, while additi<strong>on</strong>s to <strong>the</strong> labour force<br />
c<strong>on</strong>t<strong>in</strong>ued unabated. Despite <strong>the</strong> more rapid growth<br />
<strong>of</strong> employment between 1999-2000, and 2004-05,<br />
however, <strong>the</strong> rate <strong>of</strong> unemployment as measured by<br />
<strong>the</strong> current daily status rose over <strong>the</strong> same period<br />
for both males and females, and <strong>in</strong> both rural and<br />
urban areas as shown <strong>in</strong> Table 1.4.<br />
Thus, <strong>the</strong> livelihood situati<strong>on</strong> <strong>in</strong> urban <strong>India</strong><br />
causes c<strong>on</strong>cern, from <strong>the</strong> aspect <strong>of</strong> access to food<br />
and nutriti<strong>on</strong> security.<br />
Table 1.3<br />
Annual Rate <strong>of</strong> Growth <strong>of</strong> Total Employment <strong>in</strong> <strong>India</strong> (per cent)<br />
Period Rural <strong>Urban</strong><br />
1983 to 1987-88 1.36 2.77<br />
1987-88 to 1993-94 2.03 3.39<br />
1993-94 to 1999-2000 0.58 2.55<br />
Source: Adapted from Chandrasekhar and Ghosh 2001<br />
Table 1.4<br />
Unemployment Rates by Current Daily Status <strong>in</strong> <strong>India</strong> (per cent)<br />
Period Rural Male Rural Female <strong>Urban</strong> Male <strong>Urban</strong> Female<br />
1999-2000 7.2 7.0 7.3 9.4<br />
2004-05 8.0 8.7 7.5 11.6<br />
Source: M<strong>in</strong>istry <strong>of</strong> F<strong>in</strong>ance 2007<br />
3 Even if <strong>on</strong>e were to reck<strong>on</strong> 300 ‘work<strong>in</strong>g days’, <strong>the</strong> implicit average daily earn<strong>in</strong>g per work<strong>in</strong>g day would <strong>on</strong>ly amount to Rs.10, a truly<br />
miserable figure. If this were to be perceived as satisfactory, <strong>on</strong>e can imag<strong>in</strong>e <strong>the</strong> plight <strong>of</strong> <strong>the</strong> self-employed.
12 REPORT ON THE STATE OF FOOD INSECURITY IN URBAN INDIA<br />
1.2.6 <strong>Urban</strong> Amenities<br />
It is evident that, despite rapid ec<strong>on</strong>omic<br />
growth, <strong>the</strong> urban livelihoods scenario is not<br />
encourag<strong>in</strong>g for a significant part <strong>of</strong> <strong>the</strong> urban<br />
populati<strong>on</strong>, both those <strong>in</strong> paid employment and<br />
those self-employed. This has obvious implicati<strong>on</strong>s<br />
for <strong>the</strong> access aspect <strong>of</strong> urban food security. What is<br />
particularly relevant for <strong>the</strong> absorpti<strong>on</strong> dimensi<strong>on</strong><br />
<strong>of</strong> food security is <strong>the</strong> provisi<strong>on</strong> <strong>of</strong> safe dr<strong>in</strong>k<strong>in</strong>g<br />
water, sanitati<strong>on</strong>, dra<strong>in</strong>age and shelter facilities. In<br />
this sub-secti<strong>on</strong>, <strong>the</strong> positi<strong>on</strong> <strong>in</strong> urban <strong>India</strong> with<br />
respect to <strong>the</strong>se amenities is discussed.<br />
On a global level, it had been po<strong>in</strong>ted out <strong>in</strong> 2003<br />
that:<br />
It has been estimated that <strong>on</strong>e third <strong>of</strong> <strong>the</strong><br />
world’s urban populati<strong>on</strong> today do not<br />
have access to adequate hous<strong>in</strong>g, and<br />
lack access to safe water and sanitati<strong>on</strong>.<br />
These people live <strong>in</strong> overcrowded and<br />
unserviced slums, <strong>of</strong>ten situated <strong>on</strong><br />
marg<strong>in</strong>al and dangerous land. They<br />
lack access to clean water, for which<br />
<strong>the</strong>y will pay a premium. Their waste<br />
not <strong>on</strong>ly rema<strong>in</strong>s untreated, it surrounds<br />
<strong>the</strong>m and <strong>the</strong>ir daily activities and<br />
affects <strong>the</strong>ir health, especially <strong>the</strong>ir<br />
children’s (UN HABITAT 2003).<br />
ESCAP (2007) notes that <strong>the</strong> urban poor ‘…<br />
<strong>of</strong>ten suffer health problems as a result <strong>of</strong> unhealthy<br />
liv<strong>in</strong>g c<strong>on</strong>diti<strong>on</strong>s and this prevents <strong>the</strong> proper<br />
utilisati<strong>on</strong> <strong>of</strong> food, <strong>in</strong> particular <strong>the</strong> absorpti<strong>on</strong> <strong>of</strong><br />
<strong>the</strong> necessary nutrients….Data <strong>in</strong>dicate a higher<br />
<strong>in</strong>cidence <strong>of</strong> diarrhea am<strong>on</strong>g urban children than<br />
am<strong>on</strong>g rural children less than 5 years <strong>of</strong> age’.<br />
Even though Millennium Development Goal<br />
7 talks <strong>of</strong> halv<strong>in</strong>g <strong>the</strong> proporti<strong>on</strong> <strong>of</strong> people without<br />
susta<strong>in</strong>able access to safe dr<strong>in</strong>k<strong>in</strong>g water and basic<br />
sanitati<strong>on</strong> by 2015 and 100 per cent access by<br />
2025, this seems to be a very difficult challenge,<br />
especially given <strong>the</strong> policy climate across <strong>the</strong> world<br />
<strong>of</strong> rely<strong>in</strong>g primarily <strong>on</strong> markets and deregulati<strong>on</strong>,<br />
with <strong>on</strong>ly a m<strong>in</strong>imal role for <strong>the</strong> state.<br />
Rapid urban growth <strong>in</strong> <strong>India</strong> <strong>in</strong> recent years<br />
has exacerbated problems <strong>of</strong> <strong>in</strong>adequate urban<br />
<strong>in</strong>frastructure <strong>in</strong> <strong>the</strong> areas <strong>of</strong> shelter, sanitati<strong>on</strong>,<br />
dr<strong>in</strong>k<strong>in</strong>g water and dra<strong>in</strong>age. More than 40 per<br />
cent <strong>of</strong> urban <strong>India</strong> lived <strong>in</strong> <strong>on</strong>e-room tenements.<br />
The nati<strong>on</strong>al average floor area per pers<strong>on</strong> is<br />
6.89 sq.m, but <strong>on</strong>e third <strong>of</strong> <strong>the</strong> populati<strong>on</strong> had<br />
an average area <strong>of</strong> 5 sq.m or less (Aldrich and<br />
Sandhu 1998).<br />
The Nati<strong>on</strong>al <strong>Urban</strong> Hous<strong>in</strong>g and Habitat<br />
Policy 2007 notes: ‘At <strong>the</strong> advent <strong>of</strong> <strong>the</strong> 21st<br />
Century (2001), <strong>the</strong> hous<strong>in</strong>g stock <strong>in</strong> <strong>India</strong> stood at<br />
50.95 milli<strong>on</strong> for 55.8 milli<strong>on</strong> urban households.<br />
Significant segments <strong>of</strong> this hous<strong>in</strong>g stock were<br />
characterised by c<strong>on</strong>gesti<strong>on</strong> and obsolescence.<br />
C<strong>on</strong>gesti<strong>on</strong> is particularly acute <strong>in</strong> <strong>in</strong>ner city slums<br />
and peripheral slums’.<br />
Accord<strong>in</strong>g to Sivaramakrishnan and S<strong>in</strong>gh<br />
(2005), ‘… <strong>the</strong> urban envir<strong>on</strong>ment, particularly <strong>in</strong><br />
large cities, is deteriorat<strong>in</strong>g very rapidly. All cities<br />
have severe shortage <strong>of</strong> water supply, sewerage,<br />
developed land, hous<strong>in</strong>g, transportati<strong>on</strong> and o<strong>the</strong>r<br />
facilities. The level, quality and distributi<strong>on</strong> <strong>of</strong><br />
services have been very poor. Several studies have<br />
<strong>in</strong>dicated large segments <strong>of</strong> urban populati<strong>on</strong> do<br />
not have access to dr<strong>in</strong>k<strong>in</strong>g water, sanitati<strong>on</strong>, basic<br />
health services and educati<strong>on</strong>. These deficiencies<br />
have serious health impacts particularly affect<strong>in</strong>g<br />
<strong>the</strong> urban poor’.<br />
Shaw Annapurna (2007), compar<strong>in</strong>g select<br />
states with regard to urban amenities, observes that,<br />
‘… while <strong>the</strong>re has been progress <strong>in</strong> <strong>the</strong> coverage<br />
<strong>of</strong> basic amenities across urban <strong>India</strong>, it has been <strong>of</strong><br />
a qualitatively different order <strong>in</strong> <strong>the</strong> higher <strong>in</strong>come<br />
states compared to <strong>the</strong> lower and middle <strong>in</strong>come<br />
states…. The poorer states will need c<strong>on</strong>t<strong>in</strong>ued<br />
assistance from <strong>the</strong> central government to catch
up with <strong>the</strong>ir ec<strong>on</strong>omically well <strong>of</strong>f counterparts<br />
and this should be factored <strong>in</strong>to <strong>the</strong> Eleventh Plan<br />
deliberati<strong>on</strong>s <strong>on</strong> ‘<strong>in</strong>clusive growth’.<br />
An <strong>of</strong>ficial document <strong>of</strong> <strong>the</strong> Government <strong>of</strong> <strong>India</strong><br />
provides some sober<strong>in</strong>g statistics:<br />
12.04 milli<strong>on</strong> (7.87 per cent) urban<br />
households do not have access to<br />
latr<strong>in</strong>es and defecate <strong>in</strong> <strong>the</strong> open.<br />
5.48 milli<strong>on</strong> (8.13 per cent) urban<br />
households use community latr<strong>in</strong>es<br />
and 13.4 milli<strong>on</strong> households (19.49 per<br />
cent) use shared latr<strong>in</strong>es. 12.47 milli<strong>on</strong><br />
(18.5 per cent) households do not have<br />
access to a dra<strong>in</strong>age network. 26.83<br />
milli<strong>on</strong> (39.8 per cent) households are<br />
c<strong>on</strong>nected to open dra<strong>in</strong>s. The status<br />
<strong>in</strong> respect <strong>of</strong> <strong>the</strong> urban poor is even<br />
worse. The percentage <strong>of</strong> notified and<br />
n<strong>on</strong>-notified slums without latr<strong>in</strong>es is<br />
17 per cent and 51 per cent respectively.<br />
In respect <strong>of</strong> septic latr<strong>in</strong>es, <strong>the</strong><br />
availability is 66 per cent and 35<br />
per cent. In respect <strong>of</strong> underground<br />
sewerage, <strong>the</strong> availability is 30 per cent<br />
and 15 per cent respectively. More than<br />
37 per cent <strong>of</strong> <strong>the</strong> total human excreta<br />
generated <strong>in</strong> urban <strong>India</strong> is unsafely<br />
disposed. This imposes significant<br />
public health and envir<strong>on</strong>mental costs<br />
to urban areas that c<strong>on</strong>tribute more<br />
than 60 per cent <strong>of</strong> <strong>the</strong> country’s<br />
GDP. Impacts <strong>of</strong> poor sanitati<strong>on</strong> are<br />
especially significant for <strong>the</strong> urban poor<br />
(22 per cent <strong>of</strong> total urban populati<strong>on</strong>),<br />
women, children and <strong>the</strong> elderly.<br />
The document goes <strong>on</strong> to add:<br />
The loss due to diseases caused<br />
by poor sanitati<strong>on</strong> for children<br />
under 14 years al<strong>on</strong>e <strong>in</strong> urban areas<br />
amounts to Rs.500 crore at 2001 prices.<br />
INTRODUCTION AND OVERVIEW 13<br />
Inadequate discharge <strong>of</strong> untreated<br />
domestic/municipal wastewater has<br />
resulted <strong>in</strong> c<strong>on</strong>tam<strong>in</strong>ati<strong>on</strong> <strong>of</strong> 75 per<br />
cent <strong>of</strong> all surface water across <strong>India</strong><br />
(MoUD, GoI).<br />
The Eleventh Five Year Plan provides<br />
<strong>in</strong>formati<strong>on</strong> <strong>on</strong> urban amenities as <strong>of</strong> 2001 <strong>in</strong><br />
Table 1.5.<br />
Table 1.5<br />
<strong>Urban</strong> Amenities <strong>in</strong> <strong>India</strong>, 2001<br />
Total <strong>Urban</strong> Hous<strong>in</strong>g Stock 52.0 milli<strong>on</strong><br />
Pucca houses 79.16 per cent<br />
Semi-pucca houses 15.58 per cent<br />
Katcha houses 5.27 per cent<br />
Tenure Status <strong>of</strong> Households<br />
Owned dwell<strong>in</strong>g 66.8 per cent<br />
Rented dwell<strong>in</strong>g 28.5 per cent<br />
O<strong>the</strong>r 4.7 per cent<br />
Households hav<strong>in</strong>g Access to<br />
Safe dr<strong>in</strong>k<strong>in</strong>g water 90.01 per cent<br />
Electricity 87.59 per cent<br />
Toilet 73.72 per cent<br />
Dra<strong>in</strong>age 77.86 per cent<br />
Kitchen with<strong>in</strong> <strong>the</strong> house 75.96 per cent<br />
LPG for cook<strong>in</strong>g 47.96 per cent<br />
Electricity for cook<strong>in</strong>g 0.31 per cent<br />
Biogas for cook<strong>in</strong>g 0.37 per cent<br />
Source: MoHUPA 2009<br />
While <strong>the</strong>se numbers appear to suggest<br />
substantial achievement <strong>in</strong> provisi<strong>on</strong> <strong>of</strong> basic<br />
amenities, this is not quite reflective <strong>of</strong> <strong>the</strong><br />
situati<strong>on</strong> <strong>on</strong> <strong>the</strong> ground. First, <strong>the</strong>se are all-<strong>India</strong><br />
urban figures. There is c<strong>on</strong>siderable variati<strong>on</strong>,<br />
both across size classes <strong>of</strong> urban units and across<br />
<strong>State</strong>s. More important, across different secti<strong>on</strong>s<br />
<strong>of</strong> <strong>the</strong> urban populati<strong>on</strong> <strong>the</strong>re are critical <strong>in</strong>tra-
14 REPORT ON THE STATE OF FOOD INSECURITY IN URBAN INDIA<br />
urban <strong>in</strong>equalities that call for a ra<strong>the</strong>r more sober<br />
assessment <strong>of</strong> access to <strong>in</strong>frastructure facilities.<br />
For <strong>in</strong>stance, with regard to access to dr<strong>in</strong>k<strong>in</strong>g<br />
water, <strong>on</strong> <strong>the</strong> average 73 per cent <strong>of</strong> households<br />
liv<strong>in</strong>g <strong>in</strong> cities with a populati<strong>on</strong> <strong>of</strong> 100,000 and<br />
above are covered. This figure drops to 63 per<br />
cent for cities with populati<strong>on</strong> between 50,000<br />
and 100,000, 61 per cent for cities with populati<strong>on</strong><br />
between 20,000 and 50,000 and 58 per cent for<br />
cities with populati<strong>on</strong> below 20,000. Similarly, a<br />
survey <strong>of</strong> municipalities found that <strong>on</strong>ly 2.7 per<br />
cent reported supply<strong>in</strong>g more than 100 litres <strong>of</strong><br />
water per capita per day (lpcd), with 28 per cent<br />
provid<strong>in</strong>g less than 50 lpcd 4 . Though nearly half<br />
<strong>the</strong> urban populati<strong>on</strong> was said to be covered by<br />
sanitati<strong>on</strong> services, <strong>on</strong>ly 28 per cent <strong>of</strong> urban<br />
households were c<strong>on</strong>nected to <strong>the</strong> public sewerage<br />
system. Of 300 urban centres with sewerage<br />
systems, <strong>on</strong>ly 70 had sewage treatment facilities.<br />
Likewise, a significant proporti<strong>on</strong> <strong>of</strong> garbage – as<br />
much as 30 to 40 per cent – was left uncollected <strong>on</strong><br />
urban streets <strong>on</strong> <strong>the</strong> average (Mathur et al. 2007).<br />
43 per cent <strong>of</strong> households <strong>in</strong> urban areas ei<strong>the</strong>r<br />
had no latr<strong>in</strong>es or no c<strong>on</strong>necti<strong>on</strong> to a septic tank<br />
or sewerage. Sewerage c<strong>on</strong>necti<strong>on</strong>s varied from a<br />
low 48 per cent to a high 70 per cent. Data from<br />
<strong>the</strong> Central Polluti<strong>on</strong> C<strong>on</strong>trol Board <strong>in</strong>dicate that<br />
<strong>the</strong> waste water generated <strong>in</strong> 300 Class I cities<br />
was about 15800 milli<strong>on</strong> litres a day while <strong>the</strong><br />
treatment facilities existed for hardly 3750 milli<strong>on</strong><br />
litres per day. Out <strong>of</strong> total waste generated <strong>in</strong> <strong>the</strong><br />
milli<strong>on</strong> plus cities hardly 30 per cent was treated<br />
before disposal (Plann<strong>in</strong>g Commissi<strong>on</strong> 2007).<br />
The Eleventh Plan document itself po<strong>in</strong>ts<br />
out that<br />
Three-fourths <strong>of</strong> <strong>the</strong> surface water<br />
resources are polluted and 80 per cent<br />
<strong>of</strong> <strong>the</strong> polluti<strong>on</strong> is due to sewage al<strong>on</strong>e.<br />
Poor sanitati<strong>on</strong> c<strong>on</strong>diti<strong>on</strong>s, particularly<br />
<strong>in</strong> slums, are <strong>of</strong>ten l<strong>in</strong>ked to outbreaks<br />
<strong>of</strong> cholera and gastroenteritis. Waterborne<br />
diseases are <strong>on</strong>e <strong>of</strong> <strong>the</strong> major<br />
causes <strong>of</strong> mortality throughout <strong>India</strong><br />
and impose a huge burden <strong>in</strong> terms<br />
<strong>of</strong> loss <strong>of</strong> life and productivity. Water<br />
and sanitati<strong>on</strong> diseases are resp<strong>on</strong>sible<br />
for 60 per cent <strong>of</strong> <strong>the</strong> envir<strong>on</strong>mental<br />
health burden. The s<strong>in</strong>gle major cause<br />
<strong>of</strong> this burden <strong>of</strong> disease is diarrhoea,<br />
which disproporti<strong>on</strong>ately affects <strong>the</strong><br />
children under <strong>the</strong> age <strong>of</strong> five (Plann<strong>in</strong>g<br />
Commissi<strong>on</strong> 2007).<br />
It is also <strong>the</strong> case that 54.71 per cent <strong>of</strong> urban<br />
slums had no toilet facility (UNDP 2009).<br />
There would appear to have been some<br />
improvement s<strong>in</strong>ce <strong>the</strong> beg<strong>in</strong>n<strong>in</strong>g <strong>of</strong> this millenium.<br />
Thus, ‘as <strong>on</strong> 31.03.07, about 63 per cent <strong>of</strong> <strong>the</strong><br />
urban populati<strong>on</strong> have got access to sewerage,<br />
low cost sanitati<strong>on</strong> and septic tank facilities at<br />
present, i.e., about 30 per cent populati<strong>on</strong> have<br />
got access to sewerage and 33 per cent have<br />
got access to low cost sanitati<strong>on</strong> and septic tank<br />
facilities’(SACOSAN 2008). However, <strong>the</strong> same<br />
source also tells us that, ‘<strong>the</strong> coverage figures<br />
menti<strong>on</strong>ed above <strong>in</strong>dicate accessibility <strong>on</strong>ly and<br />
<strong>the</strong> quality and quantity <strong>of</strong> <strong>the</strong> services may not be<br />
as per norms <strong>in</strong> some cases’.<br />
While <strong>the</strong> discussi<strong>on</strong> <strong>of</strong> amenities so far<br />
has been ma<strong>in</strong>ly <strong>in</strong> terms <strong>of</strong> <strong>the</strong> average urban<br />
situati<strong>on</strong>, it must be noted that <strong>the</strong> situati<strong>on</strong> varies<br />
c<strong>on</strong>siderably across <strong>State</strong>s, across cities <strong>of</strong> different<br />
populati<strong>on</strong> size classes and with<strong>in</strong> any city as<br />
between <strong>the</strong> slum and n<strong>on</strong>-slum areas as well as<br />
between recognised and unrecognised slums. The<br />
worst placed <strong>in</strong> terms <strong>of</strong> amenities which have a<br />
significant bear<strong>in</strong>g <strong>on</strong> food absorpti<strong>on</strong>, and <strong>the</strong>reby<br />
<strong>on</strong> food security, are <strong>the</strong> unrecognised slums.<br />
4 It may be menti<strong>on</strong>ed here that <strong>the</strong> Nati<strong>on</strong>al Dr<strong>in</strong>k<strong>in</strong>g Water Missi<strong>on</strong> (NDWM) <strong>in</strong> <strong>the</strong> late 1980s fixed 140 lpcd as <strong>the</strong> norm.
In general, slums are present to a greater<br />
extent <strong>in</strong> <strong>the</strong> more urbanised /<strong>in</strong>dustrialised states.<br />
Accord<strong>in</strong>g to Risbud: ‘The c<strong>on</strong>centrati<strong>on</strong> <strong>of</strong><br />
slum populati<strong>on</strong> is <strong>in</strong> <strong>the</strong> states/uni<strong>on</strong> territories<br />
which are <strong>in</strong>dustrialised and have a higher level<br />
<strong>of</strong> urbanisati<strong>on</strong>’ (UNDP 2009). At <strong>the</strong> same time,<br />
as Kundu notes, ‘developed states generally<br />
report a high percentage <strong>of</strong> households hav<strong>in</strong>g<br />
access to dr<strong>in</strong>k<strong>in</strong>g water, electricity and toilet<br />
facilities. Similarly, Class I towns, particularly<br />
<strong>the</strong> metropolises, enjoy a dist<strong>in</strong>ctly higher level <strong>of</strong><br />
<strong>the</strong>se amenities compared to o<strong>the</strong>r urban centres. In<br />
<strong>the</strong> developed states, <strong>the</strong> smaller towns, too, report<br />
a modest coverage <strong>of</strong> households under different<br />
amenities. The situati<strong>on</strong> <strong>in</strong> less developed states is,<br />
however, quite different’ (Kundu 2009). It has also<br />
been noted that, <strong>in</strong> terms <strong>of</strong> availability <strong>of</strong> latr<strong>in</strong>es<br />
and dra<strong>in</strong>age, <strong>the</strong> n<strong>on</strong>-notified slums may be as<br />
poorly <strong>of</strong>f as rural areas (Chandrasekhar 2005).<br />
1.2.7 <strong>Urban</strong> <strong>Food</strong> Security<br />
Summaris<strong>in</strong>g, some aspects <strong>of</strong> <strong>the</strong> current<br />
global c<strong>on</strong>text <strong>in</strong> respect <strong>of</strong> food security <strong>in</strong>clude:<br />
•<br />
•<br />
•<br />
<strong>the</strong> slow<strong>in</strong>g down <strong>of</strong> <strong>the</strong> growth rate<br />
<strong>of</strong> food producti<strong>on</strong> globally, lead<strong>in</strong>g to<br />
a decl<strong>in</strong>e <strong>in</strong> per capita output <strong>of</strong> gra<strong>in</strong><br />
between <strong>the</strong> 1970s and <strong>the</strong> first decade<br />
<strong>of</strong> <strong>the</strong> twenty-first century.<br />
<strong>the</strong> impact <strong>of</strong> policies <strong>of</strong> ec<strong>on</strong>omic<br />
liberalisati<strong>on</strong> across <strong>the</strong> world <strong>on</strong> access<br />
to food for <strong>the</strong> world’s poor, <strong>in</strong>clud<strong>in</strong>g<br />
<strong>the</strong> urban poor.<br />
<strong>the</strong> reduced ability/will<strong>in</strong>gness <strong>of</strong><br />
governments to raise and spend <strong>the</strong><br />
required amount <strong>of</strong> resources by way<br />
<strong>of</strong> public <strong>in</strong>vestment <strong>on</strong> rural and<br />
agricultural development as well as <strong>on</strong><br />
urban <strong>in</strong>frastructure and public health,<br />
given <strong>the</strong> policy framework <strong>of</strong> far<br />
greater reliance <strong>on</strong> markets and private<br />
INTRODUCTION AND OVERVIEW 15<br />
•<br />
<strong>in</strong>vestments, and a much lesser role for<br />
governments.<br />
<strong>the</strong> result<strong>in</strong>g difficulties <strong>in</strong> tackl<strong>in</strong>g<br />
problems relat<strong>in</strong>g to all three dimensi<strong>on</strong>s<br />
<strong>of</strong> food security, namely, availability,<br />
access and absorpti<strong>on</strong>.<br />
While review<strong>in</strong>g <strong>the</strong> urban c<strong>on</strong>text <strong>in</strong> <strong>India</strong>,<br />
<strong>the</strong> focus has been <strong>on</strong> <strong>the</strong> pattern <strong>of</strong> urbanisati<strong>on</strong>,<br />
<strong>the</strong> growth <strong>of</strong> <strong>the</strong> urban ec<strong>on</strong>omy and urban<br />
<strong>in</strong>equality, <strong>the</strong> trends <strong>in</strong> urban poverty, urban<br />
livelihoods, employment and unemployment, and<br />
<strong>the</strong> growth <strong>of</strong> urban slums. All <strong>the</strong>se have a bear<strong>in</strong>g<br />
<strong>on</strong> urban food and nutriti<strong>on</strong> security. The issue <strong>of</strong><br />
urban food <strong>in</strong>security both at a general level and<br />
<strong>in</strong> <strong>the</strong> specific c<strong>on</strong>text <strong>of</strong> <strong>India</strong> today is briefly<br />
discussed below.<br />
Perhaps <strong>the</strong> most dist<strong>in</strong>ctive feature <strong>of</strong><br />
<strong>the</strong> urban food security situati<strong>on</strong> <strong>in</strong> much <strong>of</strong><br />
<strong>the</strong> develop<strong>in</strong>g world is <strong>the</strong> double burden<br />
<strong>of</strong> malnutriti<strong>on</strong> – <strong>the</strong> simultaneous existence<br />
<strong>of</strong> a large secti<strong>on</strong> <strong>of</strong> <strong>the</strong> populati<strong>on</strong> be<strong>in</strong>g<br />
undernourished and a smaller (but grow<strong>in</strong>g)<br />
secti<strong>on</strong> suffer<strong>in</strong>g from ‘overnutriti<strong>on</strong>’ – and<br />
associated morbidity patterns that impose a<br />
stra<strong>in</strong> <strong>on</strong> f<strong>in</strong>ancial resources available for public<br />
spend<strong>in</strong>g <strong>on</strong> health.<br />
A publicati<strong>on</strong> <strong>of</strong> <strong>the</strong> FAO from 1990 study<strong>in</strong>g<br />
<strong>the</strong> patterns <strong>in</strong> food c<strong>on</strong>sumpti<strong>on</strong> <strong>in</strong> develop<strong>in</strong>g<br />
countries drew attenti<strong>on</strong> to <strong>the</strong> health and ec<strong>on</strong>omic<br />
risks to which urban c<strong>on</strong>sumers are exposed when<br />
<strong>in</strong>tensive urbanisati<strong>on</strong> occurs. The grow<strong>in</strong>g supply<br />
<strong>of</strong> highly processed foods and dr<strong>in</strong>ks, usually <strong>of</strong><br />
lower nutriti<strong>on</strong>al quality than <strong>the</strong> unref<strong>in</strong>ed or<br />
traditi<strong>on</strong>ally processed foods, is <strong>on</strong>e such risk<br />
factor. Ensur<strong>in</strong>g food safety through appropriate<br />
regulati<strong>on</strong>s and m<strong>on</strong>itor<strong>in</strong>g systems becomes an<br />
important resp<strong>on</strong>sibility <strong>of</strong> <strong>the</strong> government <strong>in</strong> <strong>the</strong><br />
c<strong>on</strong>text <strong>of</strong> urban food security (Delisle 1990). The<br />
study also notes with prescience:
16 REPORT ON THE STATE OF FOOD INSECURITY IN URBAN INDIA<br />
Except <strong>in</strong> c<strong>on</strong>diti<strong>on</strong>s <strong>of</strong> extreme<br />
poverty, urban lifestyles and diets<br />
are c<strong>on</strong>ducive to obesity and o<strong>the</strong>r<br />
n<strong>on</strong>-communicable diseases <strong>of</strong><br />
“affluence”, particularly n<strong>on</strong>-<strong>in</strong>sul<strong>in</strong>dependent<br />
diabetes, cardio-vascular<br />
disease and hypertensi<strong>on</strong>. These may<br />
become major public health problems<br />
<strong>in</strong> <strong>the</strong> years to come.<br />
Mendez and Popk<strong>in</strong> (2004) po<strong>in</strong>t out that<br />
<strong>the</strong> forces <strong>of</strong> urbanisati<strong>on</strong> and globalisati<strong>on</strong> ‘…<br />
are associated with potentially beneficial dietary<br />
shifts such as <strong>in</strong>creases <strong>in</strong> energy sufficiency<br />
and greater c<strong>on</strong>sumpti<strong>on</strong> <strong>of</strong> fruit, but also appear<br />
to promote potentially obesogenic shifts such<br />
as <strong>in</strong>creased <strong>in</strong>takes <strong>of</strong> edible oils, animal foods<br />
and caloric sweeteners…overweight has become<br />
an <strong>in</strong>creas<strong>in</strong>g problem. Am<strong>on</strong>g adult women,<br />
overweight now exceeds underweight <strong>in</strong> almost<br />
all develop<strong>in</strong>g countries… <strong>Food</strong> availability and<br />
<strong>in</strong>take data suggest that adverse shifts <strong>in</strong> dietary<br />
compositi<strong>on</strong> are tak<strong>in</strong>g place at a much higher<br />
speed than potentially beneficial changes’.<br />
A syn<strong>the</strong>sis <strong>of</strong> country case studies<br />
(FAO 2004) def<strong>in</strong>es malnutriti<strong>on</strong> as follows:<br />
‘Malnutriti<strong>on</strong> is any state <strong>of</strong> nutriti<strong>on</strong>al imbalance<br />
and <strong>in</strong>cludes under- and overnutriti<strong>on</strong> and<br />
<strong>in</strong>adequacies <strong>in</strong> micr<strong>on</strong>utrients. Undernutriti<strong>on</strong><br />
is <strong>the</strong> preferred term for describ<strong>in</strong>g nutriti<strong>on</strong><br />
disorders related to lack <strong>of</strong> adequate dietary energy,<br />
while overnutriti<strong>on</strong> is used to describe excess<br />
dietary energy <strong>in</strong>take, most <strong>of</strong>ten also associated<br />
with low energy expenditure or reduced levels<br />
<strong>of</strong> physical activity’. It notes that, ‘even <strong>in</strong> some<br />
countries where chr<strong>on</strong>ic malnutriti<strong>on</strong> is prevalent<br />
<strong>in</strong> children… <strong>the</strong> prevalence <strong>of</strong> overweight and<br />
obese adults is <strong>of</strong> c<strong>on</strong>cern’. In o<strong>the</strong>r words, under<br />
urbanisati<strong>on</strong> <strong>in</strong> <strong>the</strong> c<strong>on</strong>text <strong>of</strong> globalisati<strong>on</strong>, even<br />
while ‘<strong>the</strong> issue <strong>of</strong> food and nutriti<strong>on</strong> security has<br />
not been resolved, yet ano<strong>the</strong>r level <strong>of</strong> complexity<br />
is be<strong>in</strong>g added to <strong>the</strong> problem as <strong>the</strong> <strong>in</strong>cidence <strong>of</strong><br />
diet-related n<strong>on</strong>-communicable diseases (NCD)<br />
<strong>in</strong>creases’. The study correctly c<strong>on</strong>cludes that<br />
‘a c<strong>on</strong>certed effort to dim<strong>in</strong>ish <strong>in</strong>equalities and<br />
focus <strong>on</strong> deliver<strong>in</strong>g positive ga<strong>in</strong>s is needed to<br />
stem <strong>the</strong> tide <strong>of</strong> <strong>the</strong> <strong>in</strong>creas<strong>in</strong>g double burden <strong>of</strong><br />
undernutriti<strong>on</strong> and overnutriti<strong>on</strong> coupled with<br />
excessive urbanisati<strong>on</strong> rates and grow<strong>in</strong>g poverty’.<br />
It also draws attenti<strong>on</strong> to <strong>the</strong> fact that, ‘<strong>the</strong> rapid<br />
pace <strong>of</strong> urbanisati<strong>on</strong> <strong>in</strong> many cities outstrips <strong>the</strong><br />
capability <strong>of</strong> municipalities to provide basic<br />
services such as water, sanitati<strong>on</strong> and hous<strong>in</strong>g. In<br />
this respect, <strong>the</strong> forces <strong>of</strong> globalisati<strong>on</strong> appear to<br />
drive <strong>the</strong> phenomen<strong>on</strong> <strong>of</strong> urbanisati<strong>on</strong> to a pace<br />
that is bey<strong>on</strong>d <strong>the</strong> accommodative capacity <strong>of</strong><br />
municipalities’.<br />
A later FAO study (2006) <strong>on</strong> <strong>the</strong> double<br />
burden <strong>of</strong> <strong>the</strong> simultaneous presence <strong>of</strong> over-<br />
and undernutriti<strong>on</strong> <strong>in</strong> urban areas <strong>of</strong> develop<strong>in</strong>g<br />
countries states <strong>the</strong> argument succ<strong>in</strong>ctly:<br />
Underweight and obesity are both<br />
am<strong>on</strong>g <strong>the</strong> top ten lead<strong>in</strong>g risk factors<br />
for <strong>the</strong> global burden <strong>of</strong> disease …The<br />
current double burden <strong>of</strong> malnutriti<strong>on</strong><br />
seen <strong>in</strong> many develop<strong>in</strong>g countries is<br />
brought about by a coupl<strong>in</strong>g <strong>of</strong> risk<br />
factors. Progress <strong>in</strong> improv<strong>in</strong>g water<br />
and sanitati<strong>on</strong> systems has been slow<br />
and <strong>the</strong> development <strong>of</strong> sound public<br />
health systems weak, thwart<strong>in</strong>g efforts<br />
to reduce undernutriti<strong>on</strong>. At <strong>the</strong> same<br />
time, <strong>in</strong>creas<strong>in</strong>g urbanisati<strong>on</strong> and<br />
chang<strong>in</strong>g dietary patterns and lifestyles<br />
are c<strong>on</strong>tribut<strong>in</strong>g to a rapid rise <strong>in</strong><br />
overweight and diet-related chr<strong>on</strong>ic<br />
diseases.<br />
Develop<strong>in</strong>g a typology <strong>of</strong> <strong>the</strong> double<br />
burden, <strong>the</strong> study po<strong>in</strong>ts out that <strong>India</strong>, al<strong>on</strong>g with<br />
<strong>the</strong> Philipp<strong>in</strong>es, is characterised by ‘… a high<br />
prevalence <strong>of</strong> undernutriti<strong>on</strong> <strong>in</strong> children and adults,<br />
a high prevalence <strong>of</strong> micr<strong>on</strong>utrient deficiency and
emerg<strong>in</strong>g problems <strong>of</strong> overnutriti<strong>on</strong>, diabetes and<br />
high blood pressure, ma<strong>in</strong>ly <strong>in</strong> urban areas’.<br />
A careful exam<strong>in</strong>ati<strong>on</strong> <strong>of</strong> <strong>the</strong> data for <strong>India</strong>,<br />
as part <strong>of</strong> <strong>the</strong> FAO 2006 study, c<strong>on</strong>cludes that<br />
‘data suggest that <strong>the</strong>re has not been much change<br />
<strong>in</strong> <strong>the</strong> predom<strong>in</strong>antly cereal-based dietary <strong>in</strong>take<br />
<strong>in</strong> <strong>India</strong> over <strong>the</strong> last three decades, except am<strong>on</strong>g<br />
affluent segments <strong>of</strong> <strong>the</strong> populati<strong>on</strong>. In spite <strong>of</strong><br />
<strong>in</strong>creas<strong>in</strong>g per capita <strong>in</strong>come and reduced poverty,<br />
dietary diversity is seen ma<strong>in</strong>ly am<strong>on</strong>g <strong>the</strong> affluent.<br />
Undernutriti<strong>on</strong> rates rema<strong>in</strong> high; start<strong>in</strong>g before<br />
birth, <strong>the</strong>y are aggravated throughout <strong>in</strong>fancy by<br />
poor <strong>in</strong>fant feed<strong>in</strong>g practices and perpetuated <strong>in</strong><br />
childhood by poor <strong>in</strong>tra-family distributi<strong>on</strong> <strong>of</strong> food<br />
and poor access to health care’ 5 .<br />
This MSSRF study is broadly <strong>in</strong> agreement<br />
with such an assessment. Ris<strong>in</strong>g urban <strong>in</strong>equality,<br />
significant under<strong>in</strong>vestment <strong>in</strong> urban health<br />
and nutriti<strong>on</strong> <strong>in</strong>frastructure, an <strong>in</strong>creas<strong>in</strong>gly<br />
<strong>in</strong>secure workforce with mostly casual or<br />
c<strong>on</strong>tract employment or even less remunerative<br />
self-employment, growth <strong>of</strong> slums and slum<br />
populati<strong>on</strong>s lack<strong>in</strong>g <strong>in</strong> <strong>the</strong> most elementary health<br />
and hygiene facilities – <strong>in</strong>clud<strong>in</strong>g shelter, safe<br />
dr<strong>in</strong>k<strong>in</strong>g water, sanitati<strong>on</strong> and dra<strong>in</strong>age – all <strong>the</strong>se<br />
make for a situati<strong>on</strong> <strong>of</strong> a permanent food and<br />
nutriti<strong>on</strong> emergency. Mere availability <strong>of</strong> food <strong>in</strong><br />
urban markets does not guarantee food security <strong>in</strong><br />
an envir<strong>on</strong>ment <strong>in</strong> which access has been seriously<br />
compromised both by patterns <strong>of</strong> employment and<br />
earn<strong>in</strong>gs, and by rapid rise <strong>in</strong> <strong>the</strong> prices <strong>of</strong> essential<br />
commodities beg<strong>in</strong>n<strong>in</strong>g with food and shelter. So, it<br />
would be broadly correct to identify undernutriti<strong>on</strong><br />
as <strong>the</strong> key issue for policy, even while recognis<strong>in</strong>g<br />
<strong>the</strong> need to address <strong>the</strong> ‘overnutriti<strong>on</strong>’ part <strong>of</strong><br />
<strong>the</strong> double burden through health and nutriti<strong>on</strong><br />
educati<strong>on</strong>.<br />
INTRODUCTION AND OVERVIEW 17<br />
1.3 Some New Challenges: Climate<br />
Change and <strong>Food</strong> Price Inflati<strong>on</strong><br />
Recent years have seen an emerg<strong>in</strong>g<br />
c<strong>on</strong>sensus that climate change is a major new<br />
challenge to humanity, and especially so with<br />
respect to <strong>the</strong> issue <strong>of</strong> food and nutriti<strong>on</strong> security.<br />
<strong>Urban</strong> food security will be directly and negatively<br />
impacted by climate change <strong>in</strong> so far as it implies<br />
greater volatility <strong>in</strong> climatic c<strong>on</strong>diti<strong>on</strong>s and thus<br />
also <strong>in</strong> foodgra<strong>in</strong> output and availability. Negative<br />
c<strong>on</strong>sequences will also occur from climate change<br />
lead<strong>in</strong>g to a greater frequency <strong>of</strong> extreme events,<br />
which can be especially catastrophic for urban<br />
settlements with high densities <strong>of</strong> populati<strong>on</strong>.<br />
The o<strong>the</strong>r important c<strong>on</strong>temporary challenge<br />
is <strong>the</strong> emergence <strong>of</strong> high rates <strong>of</strong> <strong>in</strong>flati<strong>on</strong> <strong>in</strong><br />
respect <strong>of</strong> food articles, someth<strong>in</strong>g that <strong>India</strong><br />
has been experienc<strong>in</strong>g <strong>of</strong> late. While a part <strong>of</strong><br />
this may be associated with supply-demand<br />
imbalances, it <strong>in</strong>creas<strong>in</strong>gly appears that <strong>the</strong> role<br />
<strong>of</strong> speculati<strong>on</strong> and futures trad<strong>in</strong>g <strong>in</strong> foodgra<strong>in</strong>s<br />
is also an important factor.<br />
It is important to emphasise that policies<br />
relat<strong>in</strong>g to urban food security will have to tackle<br />
<strong>the</strong>se two c<strong>on</strong>temporary challenges effectively and<br />
imag<strong>in</strong>atively. In particular, far greater attenti<strong>on</strong><br />
would have to be paid to ensur<strong>in</strong>g safe shelter<br />
through appropriate materials <strong>of</strong> c<strong>on</strong>structi<strong>on</strong> for<br />
vulnerable secti<strong>on</strong>s <strong>of</strong> <strong>the</strong> populati<strong>on</strong> as well as<br />
arrang<strong>in</strong>g dispersed and easily retrievable storage<br />
po<strong>in</strong>ts for foodgra<strong>in</strong>s <strong>in</strong> urban centres. Similarly,<br />
with food price <strong>in</strong>flati<strong>on</strong>, a dedicated and universal<br />
public distributi<strong>on</strong> system appropriately governed<br />
and m<strong>on</strong>itored, becomes crucial.<br />
5 The paper <strong>on</strong> <strong>India</strong> does po<strong>in</strong>t out, however, that over <strong>the</strong> decade from <strong>the</strong> mid-1990s to <strong>the</strong> mid-2000s, ‘<strong>in</strong> affluent urban segments,<br />
<strong>in</strong>creased energy <strong>in</strong>take from fats, ref<strong>in</strong>ed cereals and sugar, comb<strong>in</strong>ed with simultaneous reducti<strong>on</strong>s <strong>in</strong> physical activity have c<strong>on</strong>tributed<br />
to steep <strong>in</strong>creases <strong>in</strong> over nutriti<strong>on</strong> <strong>in</strong> all age groups’ (FAO 2006).
18 REPORT ON THE STATE OF FOOD INSECURITY IN URBAN INDIA<br />
1.4 Overview <strong>of</strong> <strong>the</strong> <str<strong>on</strong>g>Report</str<strong>on</strong>g><br />
In <strong>the</strong> chapters that follow, various aspects<br />
that have an effect <strong>on</strong> <strong>the</strong> status <strong>of</strong> food <strong>in</strong>security<br />
<strong>of</strong> <strong>the</strong> urban populati<strong>on</strong> will be discussed. These<br />
will <strong>in</strong>clude <strong>the</strong> extent and nature <strong>of</strong> employment<br />
opportunities, accessibility to basic amenities, level<br />
and pattern <strong>of</strong> food c<strong>on</strong>sumpti<strong>on</strong> and <strong>the</strong> nutriti<strong>on</strong>al<br />
status <strong>of</strong> <strong>the</strong> urban populati<strong>on</strong> across <strong>the</strong> different<br />
<strong>State</strong>s <strong>of</strong> <strong>India</strong>. S<strong>in</strong>ce <strong>the</strong> food security situati<strong>on</strong>s<br />
may be expected to vary significantly not <strong>on</strong>ly<br />
across <strong>State</strong>s but also across cities and towns <strong>of</strong><br />
different populati<strong>on</strong> size classes, <strong>the</strong> food security<br />
situati<strong>on</strong>s across various size classes <strong>of</strong> urban units<br />
will be exam<strong>in</strong>ed wherever possible. The <str<strong>on</strong>g>Report</str<strong>on</strong>g><br />
will go <strong>on</strong> to talk about <strong>the</strong> choice <strong>of</strong> <strong>in</strong>dicators<br />
for food <strong>in</strong>security, c<strong>on</strong>struct an Index <strong>of</strong> <strong>Food</strong><br />
<strong>Insecurity</strong>, compute <strong>the</strong> values <strong>of</strong> this Index for<br />
major <strong>State</strong>s <strong>of</strong> <strong>India</strong> at two different po<strong>in</strong>ts <strong>in</strong> time<br />
and, based <strong>on</strong> <strong>the</strong>se values, provide an analytical<br />
comparis<strong>on</strong> across <strong>State</strong>s. The c<strong>on</strong>tributi<strong>on</strong> made<br />
to food and nutriti<strong>on</strong> security by <strong>the</strong> three major<br />
food-related <strong>in</strong>terventi<strong>on</strong>s <strong>of</strong> <strong>the</strong> government,<br />
namely, <strong>the</strong> public distributi<strong>on</strong> system (PDS),<br />
<strong>the</strong> nati<strong>on</strong>al programme <strong>of</strong> nutriti<strong>on</strong>al support<br />
to educati<strong>on</strong> more comm<strong>on</strong>ly known as <strong>the</strong><br />
mid-day meal scheme (MDMS) and <strong>the</strong> <strong>in</strong>tegrated<br />
child development services (ICDS) will <strong>the</strong>n be<br />
explored. The f<strong>in</strong>al chapter will br<strong>in</strong>g toge<strong>the</strong>r <strong>the</strong><br />
f<strong>in</strong>d<strong>in</strong>gs and <strong>of</strong>fer some suggesti<strong>on</strong>s for policy.
CHAPTER 2<br />
Dimensi<strong>on</strong>s <strong>of</strong> <strong>Food</strong> <strong>Insecurity</strong><br />
<strong>in</strong> <strong>Urban</strong> <strong>India</strong><br />
The c<strong>on</strong>cept <strong>of</strong> food <strong>in</strong>security is<br />
multidimensi<strong>on</strong>al <strong>in</strong> nature and is determ<strong>in</strong>ed by a<br />
whole range <strong>of</strong> factors such as domestic producti<strong>on</strong><br />
<strong>of</strong> food, import and export <strong>of</strong> food, purchas<strong>in</strong>g<br />
power <strong>of</strong> people to access food as well as factors<br />
that <strong>in</strong>fluence absorpti<strong>on</strong> <strong>of</strong> food <strong>in</strong> <strong>the</strong> body. The<br />
different elements that <strong>in</strong>fluence food security can<br />
be classified <strong>in</strong>to three broad dimensi<strong>on</strong>s – food<br />
availability, food access and food absorpti<strong>on</strong>. In<br />
this chapter some key issues perta<strong>in</strong><strong>in</strong>g to food<br />
<strong>in</strong>security <strong>in</strong> urban areas across <strong>the</strong> major <strong>State</strong>s <strong>of</strong><br />
<strong>India</strong> are discussed. Analys<strong>in</strong>g <strong>the</strong> status <strong>of</strong> food<br />
<strong>in</strong>security across different <strong>State</strong>s would <strong>in</strong>dicate<br />
variati<strong>on</strong> <strong>in</strong> <strong>the</strong> nature <strong>of</strong> food <strong>in</strong>security c<strong>on</strong>cerns<br />
am<strong>on</strong>g <strong>the</strong>m. Aspects relat<strong>in</strong>g to food access would<br />
be a more important problem for urban households<br />
<strong>in</strong> some <strong>State</strong>s while lack <strong>of</strong> basic amenities that<br />
affect food absorpti<strong>on</strong> would be more crucial <strong>in</strong><br />
o<strong>the</strong>rs. Thus, classify<strong>in</strong>g <strong>the</strong> problem <strong>of</strong> food<br />
<strong>in</strong>security <strong>in</strong>to different dimensi<strong>on</strong>s would not <strong>on</strong>ly<br />
help <strong>in</strong> a better understand<strong>in</strong>g <strong>of</strong> <strong>the</strong> complexity but<br />
will also aid <strong>in</strong> identify<strong>in</strong>g appropriate <strong>in</strong>terventi<strong>on</strong>s<br />
to address <strong>the</strong> situati<strong>on</strong>. However, it is difficult<br />
to arrive at a measure <strong>of</strong> food availability across<br />
<strong>State</strong>s given <strong>the</strong> difficulty <strong>in</strong> collecti<strong>on</strong> <strong>of</strong> data <strong>on</strong><br />
net import <strong>of</strong> gra<strong>in</strong> <strong>in</strong>to a <strong>State</strong> <strong>on</strong> private account<br />
as well as changes <strong>in</strong> <strong>the</strong> amount <strong>of</strong> privately held<br />
stocks. Therefore, <strong>the</strong> discussi<strong>on</strong> <strong>in</strong> this chapter<br />
essentially relates to <strong>the</strong> o<strong>the</strong>r dimensi<strong>on</strong>s <strong>of</strong> food<br />
security, namely, aspects perta<strong>in</strong><strong>in</strong>g to food access<br />
and absorpti<strong>on</strong> as well as <strong>the</strong> nutriti<strong>on</strong>al status <strong>of</strong><br />
<strong>the</strong> populati<strong>on</strong>.<br />
Before enter<strong>in</strong>g <strong>in</strong>to a discussi<strong>on</strong> <strong>on</strong> urban<br />
food <strong>in</strong>security, it is important to c<strong>on</strong>sider <strong>the</strong><br />
broad pattern <strong>of</strong> urbanisati<strong>on</strong> experienced by <strong>the</strong><br />
country 6 . <strong>Urban</strong>isati<strong>on</strong> is <strong>the</strong> process whereby<br />
larger proporti<strong>on</strong>s <strong>of</strong> populati<strong>on</strong> live <strong>in</strong> urban<br />
areas. In any country, <strong>the</strong> specific manner <strong>in</strong> which<br />
<strong>the</strong> process <strong>of</strong> urbanisati<strong>on</strong> comes about is related<br />
to <strong>the</strong> nature <strong>of</strong> <strong>the</strong> overall development process<br />
experienced by that country. Table 2.1 <strong>in</strong>dicates<br />
<strong>the</strong> salient features <strong>of</strong> urbanisati<strong>on</strong> across <strong>the</strong> major<br />
<strong>State</strong>s <strong>of</strong> <strong>India</strong>. The overall level <strong>of</strong> urbanisati<strong>on</strong><br />
<strong>in</strong> <strong>the</strong> country was about 28 per cent <strong>in</strong> 2001.<br />
Given that <strong>the</strong> process <strong>of</strong> development is uneven<br />
across <strong>the</strong> country, <strong>the</strong> patterns <strong>of</strong> urbanisati<strong>on</strong><br />
are also not uniform. Tamil Nadu, Maharashtra<br />
and Gujarat have had more than <strong>on</strong>e-third <strong>of</strong> <strong>the</strong>ir<br />
populati<strong>on</strong> liv<strong>in</strong>g <strong>in</strong> urban areas <strong>in</strong> 1991 as well as<br />
2001, while <strong>in</strong> Madhya Pradesh, Rajasthan, Uttar<br />
Pradesh, Bihar, Orissa and Assam this proporti<strong>on</strong><br />
was less than <strong>on</strong>e-fourth. Town density, a measure<br />
<strong>of</strong> <strong>the</strong> spread <strong>of</strong> urbanisati<strong>on</strong>, <strong>in</strong>dicates that <strong>the</strong><br />
urban spread was relatively better <strong>in</strong> Tamil Nadu,<br />
<strong>the</strong> Punjab and Haryana while it was very low<br />
<strong>in</strong> Orissa and Rajasthan. From 1991 to 2001, <strong>the</strong><br />
annual populati<strong>on</strong> growth rate <strong>in</strong> urban areas <strong>in</strong><br />
6 C<strong>on</strong>sider<strong>in</strong>g that <strong>the</strong> latest data available is from <strong>the</strong> Census <strong>of</strong> <strong>India</strong> 2001, this secti<strong>on</strong> largely relies <strong>on</strong> <strong>the</strong> <strong>Food</strong> <strong>Insecurity</strong> Atlas <strong>of</strong> <strong>Urban</strong><br />
<strong>India</strong> (FIAUI) (MSSRF-WFP 2002).
20 REPORT ON THE STATE OF FOOD INSECURITY IN URBAN INDIA<br />
Table 2.1<br />
Salient Features <strong>of</strong> <strong>Urban</strong>isati<strong>on</strong> across <strong>the</strong> <strong>State</strong>s, 1991 and 2001<br />
Sl.<br />
No. <strong>State</strong>s Degree <strong>of</strong><br />
<strong>Urban</strong>isati<strong>on</strong><br />
Town Density<br />
Percentage<br />
<strong>of</strong><br />
populati<strong>on</strong><br />
liv<strong>in</strong>g <strong>in</strong><br />
large towns<br />
Rate <strong>of</strong><br />
growth <strong>of</strong><br />
urban<br />
populati<strong>on</strong><br />
URGD<br />
Percentage<br />
<strong>of</strong> slum<br />
populati<strong>on</strong><br />
1991 2001 1991 2001 2001 1991-2001 1991-2001 2001<br />
1 Andhra Pradesh 26.89 27.08 0.96 0.76 88.19 1.37 0.09 32.24<br />
2 Assam 11.10 12.72 1.19 1.59 54.22 3.14 1.59 6.00<br />
3 Bihar 13.14 13.36 1.56 1.45 66.65 2.59 0.19 12.00<br />
4 Gujarat 34.49 37.35 1.35 1.23 67.40 2.87 1.27 14.70<br />
5 Haryana 24.63 29.00 2.13 2.40 76.17 4.19 2.30 33.06<br />
6 Karnataka 30.92 33.98 1.60 1.41 75.12 2.57 1.42 12.73<br />
7 Kerala 26.39 25.97 5.07 4.09 63.87 0.74 -0.22 2.02<br />
8 Madhya Pradesh 23.18 24.98 1.05 1.10 66.44 2.83 1.01 27.85<br />
9 Maharashtra 38.69 42.40 1.09 1.23 85.19 2.99 1.57 33.31<br />
10 Orissa 13.38 14.97 0.80 0.89 59.36 2.64 1.34 22.20<br />
11 Punjab 29.55 33.95 2.38 3.12 74.38 3.21 2.08 20.49<br />
12 Rajasthan 22.88 23.38 0.65 0.65 71.04 2.75 0.29 16.88<br />
13 Tamil Nadu 34.15 43.86 3.61 6.40 57.48 3.63 4.16 20.00<br />
14 Uttar Pradesh 19.84 21.02 2.56 2.68 60.76 2.88 0.74 19.94<br />
15 West Bengal 27.48 28.03 4.30 4.23 53.23 1.86 0.28 27.11<br />
<strong>India</strong> 25.71 27.78 1.51 1.63 66.78 2.75 1.08 23.10<br />
Note:<br />
1. Large towns are towns with populati<strong>on</strong> 50,000 and above<br />
2. Census <strong>of</strong> <strong>India</strong>, 2001 c<strong>on</strong>ducted survey <strong>of</strong> slums <strong>on</strong>ly <strong>in</strong> large towns (with populati<strong>on</strong> 50,000 and above) <strong>of</strong> Census 1991<br />
and percentage <strong>of</strong> slum populati<strong>on</strong> is with reference to <strong>the</strong>se large towns<br />
3. Town density is number <strong>of</strong> towns per 1000 sq.km<br />
4. URGD – <strong>Urban</strong> - Rural growth differential<br />
5. The entire analysis <strong>in</strong> this study <strong>in</strong>cludes <strong>the</strong> <strong>State</strong>s <strong>of</strong> Jharkhand, Chhattisgarh and Uttarakhand <strong>in</strong> <strong>the</strong> <strong>State</strong>s <strong>of</strong> Bihar,<br />
Madhya Pradesh and Uttar Pradesh respectively. Weighted averages are used for clubb<strong>in</strong>g <strong>the</strong> <strong>State</strong>s<br />
Source: Census <strong>of</strong> <strong>India</strong> 1991; Census <strong>of</strong> <strong>India</strong> 2001
<strong>India</strong> was at 2.75 per cent while <strong>in</strong> rural areas it<br />
was 1.67 per cent. Thus <strong>the</strong> <strong>Urban</strong> Rural Growth<br />
Differential (URGD) for <strong>the</strong> country as a whole<br />
was at 1.08 per cent per annum. The nature <strong>of</strong><br />
<strong>the</strong> larger development process <strong>in</strong> <strong>India</strong> has been<br />
such that it has led to a low level <strong>of</strong> urbanisati<strong>on</strong><br />
comb<strong>in</strong>ed with a relatively high rate <strong>of</strong> growth<br />
<strong>of</strong> urban populati<strong>on</strong> and a high and <strong>in</strong>creas<strong>in</strong>g<br />
c<strong>on</strong>centrati<strong>on</strong> <strong>of</strong> urban populati<strong>on</strong> <strong>in</strong> large cities<br />
<strong>in</strong> <strong>the</strong> country.<br />
This chapter is an attempt to discuss various<br />
factors that have a bear<strong>in</strong>g <strong>on</strong> <strong>the</strong> food security <strong>of</strong><br />
<strong>the</strong> urban populati<strong>on</strong>. The first secti<strong>on</strong> discusses<br />
aspects relat<strong>in</strong>g to employment, <strong>the</strong> sec<strong>on</strong>d<br />
secti<strong>on</strong> is <strong>on</strong> basic amenities and <strong>the</strong> third secti<strong>on</strong><br />
analyses food c<strong>on</strong>sumpti<strong>on</strong>. The fourth secti<strong>on</strong><br />
briefly discusses <strong>the</strong> nutriti<strong>on</strong>al outcomes am<strong>on</strong>g<br />
slums and n<strong>on</strong>-slum areas <strong>in</strong> selected metropolitan<br />
cities.<br />
2.1 Employment<br />
For <strong>the</strong> urban populati<strong>on</strong>, access to food<br />
generally depends <strong>on</strong> <strong>the</strong> ability to buy food. In<br />
<strong>the</strong> absence <strong>of</strong> data <strong>on</strong> <strong>in</strong>come and wealth that<br />
would broadly determ<strong>in</strong>e <strong>the</strong> purchas<strong>in</strong>g power<br />
<strong>of</strong> <strong>the</strong> populati<strong>on</strong>, <strong>on</strong>e can use employment<br />
<strong>in</strong>dicators as a proxy for purchas<strong>in</strong>g power. The<br />
ability <strong>of</strong> people to access food <strong>in</strong> <strong>the</strong> market is<br />
likely to be low <strong>in</strong> an area where <strong>the</strong> availability<br />
<strong>of</strong> employment is low or unemployment is high.<br />
Apart from <strong>the</strong> availability <strong>of</strong> employment, it is<br />
also <strong>the</strong> quality <strong>of</strong> employment that determ<strong>in</strong>es<br />
<strong>the</strong> capacity <strong>of</strong> <strong>the</strong> populati<strong>on</strong> and <strong>the</strong>refore its<br />
means to purchase food <strong>in</strong> <strong>the</strong> market. The nature<br />
and extent <strong>of</strong> employment available <strong>in</strong> a society<br />
is related to <strong>the</strong> overall development process<br />
experienced by that society. The <strong>India</strong>n ec<strong>on</strong>omy is<br />
predom<strong>in</strong>antly rural <strong>in</strong> character, with 72 per cent<br />
<strong>of</strong> total populati<strong>on</strong> resid<strong>in</strong>g <strong>in</strong> villages accord<strong>in</strong>g<br />
to <strong>the</strong> Census <strong>of</strong> 2001. However, while just about<br />
28 per cent <strong>of</strong> <strong>the</strong> populati<strong>on</strong> lives <strong>in</strong> towns, <strong>in</strong><br />
DIMENSIONS OF FOOD INSECURITY IN URBAN INDIA 21<br />
terms <strong>of</strong> absolute size this means a stagger<strong>in</strong>g<br />
285 milli<strong>on</strong> pers<strong>on</strong>s. So, urban food security is<br />
a massive challenge. Moreover, <strong>the</strong>re are certa<strong>in</strong><br />
specificities <strong>in</strong> <strong>the</strong> pattern <strong>of</strong> urban growth <strong>in</strong> <strong>India</strong>,<br />
such as high c<strong>on</strong>centrati<strong>on</strong> <strong>of</strong> urban populati<strong>on</strong><br />
<strong>in</strong> large cities and high rates <strong>of</strong> urban expansi<strong>on</strong>,<br />
which have implicati<strong>on</strong>s for food security <strong>in</strong> urban<br />
areas. Fur<strong>the</strong>r, as discussed earlier, not <strong>on</strong>ly has<br />
<strong>the</strong> <strong>India</strong>n development process bypassed a large<br />
secti<strong>on</strong> <strong>of</strong> populati<strong>on</strong>, <strong>the</strong>re is also significant<br />
imbalance across sectors and across space. A<br />
specific c<strong>on</strong>sequence <strong>of</strong> this development process<br />
is <strong>the</strong> predom<strong>in</strong>ance <strong>of</strong> unorganised or <strong>in</strong>formal<br />
workers <strong>in</strong> urban areas <strong>of</strong> <strong>the</strong> country. In o<strong>the</strong>r<br />
words, <strong>the</strong> nature <strong>of</strong> urban growth <strong>in</strong> <strong>India</strong> entails<br />
<strong>in</strong>formal employment, underemployment as well<br />
as unemployment to a significant extent <strong>in</strong> urban<br />
areas. The Nati<strong>on</strong>al Commissi<strong>on</strong> for Enterprises<br />
<strong>in</strong> <strong>the</strong> Unorganised Sector (NCEUS) set up by <strong>the</strong><br />
Central Government <strong>in</strong> 2004, def<strong>in</strong>es unorganised<br />
workers thus: “Unorganised workers c<strong>on</strong>sist <strong>of</strong><br />
those work<strong>in</strong>g <strong>in</strong> <strong>the</strong> unorganised enterprises or<br />
households, exclud<strong>in</strong>g regular workers with social<br />
security benefits, and <strong>the</strong> workers <strong>in</strong> <strong>the</strong> formal<br />
sector without any employment/ social security<br />
benefits provided by <strong>the</strong> employers” (NCEUS<br />
2007:3). It would be reas<strong>on</strong>able to assume that<br />
access to secure, organised sector employment<br />
would guarantee better access to food. On <strong>the</strong><br />
o<strong>the</strong>r hand, employment <strong>in</strong> <strong>the</strong> unorganised or<br />
<strong>in</strong>formal sector as well as <strong>in</strong>formal employment<br />
<strong>in</strong> <strong>the</strong> organised sector usually fetches an <strong>in</strong>come<br />
that is not <strong>on</strong>ly low but also irregular and <strong>the</strong>refore<br />
provides relatively poorer access to food.<br />
NCEUS has made detailed computati<strong>on</strong>s<br />
us<strong>in</strong>g <strong>the</strong> Nati<strong>on</strong>al Sample Survey Organisati<strong>on</strong><br />
(NSSO) data for 2004-05 <strong>on</strong> <strong>the</strong> magnitude and<br />
nature <strong>of</strong> unorganised sector employment <strong>in</strong> <strong>the</strong><br />
country. Accord<strong>in</strong>g to this study, <strong>of</strong> <strong>the</strong> 198.5<br />
milli<strong>on</strong> n<strong>on</strong>-agricultural workers <strong>in</strong> <strong>the</strong> country <strong>in</strong><br />
2004-05, 166.5 milli<strong>on</strong>, that is, 84 per cent were
22 REPORT ON THE STATE OF FOOD INSECURITY IN URBAN INDIA<br />
unorganised workers. Even with<strong>in</strong> <strong>the</strong> organised<br />
sector engaged <strong>in</strong> n<strong>on</strong>-agricultural activities, out<br />
<strong>of</strong> 56.5 milli<strong>on</strong> workers, 24.5 milli<strong>on</strong>, that is,<br />
about 43 per cent were <strong>in</strong>formal workers.<br />
Total <strong>in</strong>formal workers c<strong>on</strong>sist <strong>of</strong> those <strong>in</strong><br />
<strong>the</strong> unorganised sector as well as <strong>in</strong>formal<br />
workers <strong>in</strong> <strong>the</strong> organised sector. Compar<strong>in</strong>g<br />
<strong>the</strong> extent <strong>of</strong> <strong>in</strong>formal workers <strong>in</strong> <strong>the</strong><br />
<strong>India</strong>n ec<strong>on</strong>omy <strong>in</strong> 1999-2000 and 2004-05,<br />
NCEUS c<strong>on</strong>cluded that <strong>the</strong> process <strong>of</strong><br />
<strong>in</strong>formalisati<strong>on</strong> <strong>of</strong> <strong>the</strong> formal or organised sector<br />
has <strong>in</strong>creased <strong>in</strong> <strong>the</strong> country.<br />
Sl.<br />
No.<br />
<strong>State</strong>s<br />
Table 2.2 provides data <strong>on</strong> Work<br />
Participati<strong>on</strong> Rate (WPR) for males and females<br />
<strong>in</strong> <strong>the</strong> urban areas <strong>of</strong> <strong>the</strong> major <strong>State</strong>s <strong>of</strong> <strong>India</strong><br />
for three employment rounds <strong>of</strong> NSSO, viz.,<br />
1993-94, 1999-2000 and 2004-05 7 . WPR provides<br />
<strong>the</strong> number <strong>of</strong> pers<strong>on</strong>s employed per 1000<br />
populati<strong>on</strong>. Here, total usually employed or all<br />
workers are taken <strong>in</strong>to account by c<strong>on</strong>sider<strong>in</strong>g<br />
usual pr<strong>in</strong>cipal and subsidiary activity toge<strong>the</strong>r.<br />
WPR thus provides a crude estimate <strong>of</strong> availability<br />
<strong>of</strong> employment for a given populati<strong>on</strong>. Table 2.2<br />
illustrates some trends:<br />
Table 2.2<br />
Work Participati<strong>on</strong> Rate (WPR) for Males and Females <strong>in</strong> <strong>Urban</strong> Areas <strong>of</strong><br />
Major <strong>State</strong>s <strong>of</strong> <strong>India</strong>, 1993-94 to 2004-05<br />
Work Participati<strong>on</strong> Rate<br />
Males Females<br />
1993-94 1999-2000 2004-05 1993-94 1999-2000 2004-05<br />
1 Andhra Pradesh 544 511 560 199 178 224<br />
2 Assam 528 522 551 92 112 109<br />
3 Bihar 439 432 466 69 75 112<br />
4 Gujarat 535 536 578 142 135 151<br />
5 Haryana 519 506 511 152 98 132<br />
6 Karnataka 542 545 576 181 178 181<br />
7 Kerala 559 558 547 203 203 200<br />
8 Madhya Pradesh 471 488 527 142 134 166<br />
9 Maharastra 526 532 560 169 137 190<br />
10 Orissa 510 475 504 151 145 148<br />
11 Punjab 553 549 572 93 125 133<br />
12 Rajasthan 490 486 508 163 138 182<br />
13 Tamil Nadu 575 563 593 230 215 241<br />
14 Uttar Pradesh 482 490 521 102 94 123<br />
15 West Bengal 550 567 595 143 117 155<br />
<strong>India</strong> 521 518 549 155 139 166<br />
Note: WPR is def<strong>in</strong>ed as usually employed pers<strong>on</strong>s (Pr<strong>in</strong>cipal Status + Subsidary Status) per 1000 pers<strong>on</strong>s<br />
Source: NSSO 1997b; NSSO 2001a; NSSO 2006<br />
7 The entire analysis <strong>in</strong> this chapter does not c<strong>on</strong>sider Jharkhand, Chhattisgarh and Uttarakhand separately but <strong>in</strong>cludes <strong>the</strong>m <strong>in</strong> <strong>the</strong>ir<br />
respective erstwhile undivided <strong>State</strong>s <strong>of</strong> Bihar, Madhya Pradesh and Uttar Pradesh. This has been d<strong>on</strong>e to enable comparis<strong>on</strong> with earlier<br />
years.
•<br />
•<br />
•<br />
DIMENSIONS OF FOOD INSECURITY IN URBAN INDIA 23<br />
First, <strong>in</strong> general, across all urban areas <strong>in</strong><br />
<strong>the</strong> country, WPR for females was lower<br />
than WPR for males and <strong>in</strong> urban <strong>India</strong><br />
as a whole, it was nearly three times<br />
lower compared to WPR for males <strong>in</strong> all<br />
<strong>the</strong> three years under c<strong>on</strong>siderati<strong>on</strong>.<br />
Sec<strong>on</strong>d, WPR for males was higher <strong>in</strong><br />
<strong>State</strong>s that are relatively more urbanised<br />
and more developed, <strong>the</strong> excepti<strong>on</strong> be<strong>in</strong>g<br />
Haryana8 . In Bihar, Madhya Pradesh,<br />
Uttar Pradesh, Rajasthan and Orissa WPR<br />
for males was lower than <strong>the</strong> all-<strong>India</strong><br />
average all through. In 2004-05, WPR<br />
for males was highest <strong>in</strong> West Bengal at<br />
595 workers per 1000 pers<strong>on</strong>s, closely<br />
followed by Tamil Nadu with a figure <strong>of</strong><br />
593. For females, Tamil Nadu registered<br />
<strong>the</strong> highest WPR am<strong>on</strong>gst all <strong>State</strong>s <strong>in</strong><br />
<strong>the</strong> three time po<strong>in</strong>ts under c<strong>on</strong>siderati<strong>on</strong>.<br />
The overall pattern exhibited by female<br />
WPR was not similar to that <strong>of</strong> males<br />
<strong>in</strong> that Assam, West Bengal, Gujarat<br />
and <strong>the</strong> Punjab that exhibited high work<br />
participati<strong>on</strong> rates for males showed a<br />
low participati<strong>on</strong> rate for females.<br />
Third, while for males as well as females,<br />
<strong>in</strong> general, WPR has <strong>in</strong>creased over<br />
<strong>the</strong> period 1993-94 to 2004-05 <strong>the</strong>re is<br />
variati<strong>on</strong> <strong>in</strong> <strong>the</strong> pattern exhibited. In most<br />
<strong>State</strong>s, WPR has dropped <strong>in</strong> 1999-2000<br />
compared to 1993-94, but has <strong>in</strong>creased<br />
dur<strong>in</strong>g <strong>the</strong> latter period, 1999-2000<br />
and 2004-05. Six <strong>State</strong>s (West Bengal,<br />
Uttar Pradesh, Maharashtra, Madhya<br />
Pradesh, Karnataka and Gujarat) <strong>in</strong> <strong>the</strong><br />
case <strong>of</strong> males and two <strong>State</strong>s (Bihar and<br />
<strong>the</strong> Punjab) <strong>in</strong> <strong>the</strong> case <strong>of</strong> females have<br />
registered an <strong>in</strong>crease <strong>in</strong> WPR s<strong>in</strong>ce<br />
1993-94, without a decl<strong>in</strong>e <strong>in</strong> 1999-<br />
2000. Kerala shows a different pattern<br />
8 In 2001, while <strong>the</strong> percentage <strong>of</strong> urban populati<strong>on</strong> <strong>in</strong> <strong>the</strong> country was 27.78, <strong>in</strong> Haryana it was 29.<br />
compared to all o<strong>the</strong>r <strong>State</strong>s <strong>in</strong> that WPR<br />
for males and females has not <strong>in</strong>creased<br />
over <strong>the</strong> years. In Haryana too, WPR<br />
for females has decl<strong>in</strong>ed over <strong>the</strong> period<br />
1993-94 to 2004-05.<br />
Table 2.3 provides data <strong>on</strong> status <strong>of</strong><br />
employment <strong>of</strong> 1000 usually employed males <strong>in</strong><br />
urban areas <strong>of</strong> <strong>the</strong> 15 major <strong>State</strong>s <strong>in</strong> <strong>the</strong> country.<br />
In urban <strong>India</strong>, 417 out <strong>of</strong> 1000 male workers <strong>in</strong><br />
1993-94 were self-employed and <strong>the</strong>ir proporti<strong>on</strong><br />
<strong>in</strong>creased to 448 <strong>in</strong> 2004-05. All <strong>State</strong>s except<br />
Assam and Uttar Pradesh have registered an<br />
<strong>in</strong>crease <strong>in</strong> male workers <strong>in</strong> <strong>the</strong> self-employment<br />
category. However, <strong>in</strong> both <strong>the</strong>se <strong>State</strong>s <strong>the</strong><br />
proporti<strong>on</strong> <strong>of</strong> self-employed has always been<br />
above <strong>the</strong> country’s average. Orissa and West<br />
Bengal have registered <strong>the</strong> highest <strong>in</strong>crease <strong>in</strong> <strong>the</strong><br />
proporti<strong>on</strong> <strong>of</strong> workers who are self-employed over<br />
<strong>the</strong> 12 years under c<strong>on</strong>siderati<strong>on</strong>. As a corollary<br />
to <strong>the</strong> pattern exhibited by <strong>the</strong> category <strong>of</strong> selfemployed<br />
workers, <strong>the</strong> proporti<strong>on</strong> <strong>of</strong> male workers<br />
<strong>in</strong> regular employment decl<strong>in</strong>ed from 422 to 406<br />
for every 1000 male workers, <strong>in</strong> <strong>the</strong> country as a<br />
whole over 1993-94 to 2004-05. However, Tamil<br />
Nadu, Uttar Pradesh, Gujarat and Assam did<br />
not exhibit a decl<strong>in</strong>e <strong>in</strong> regular employment. By<br />
2004-05, regular employment rema<strong>in</strong>ed <strong>the</strong> most<br />
important work category for male workers <strong>on</strong>ly<br />
<strong>in</strong> <strong>the</strong> three most urbanised <strong>State</strong>s <strong>of</strong> <strong>the</strong> country,<br />
namely, Tamil Nadu, Gujarat and Maharashtra. As<br />
regards casual employment am<strong>on</strong>g male workers,<br />
while most <strong>State</strong>s have registered a decl<strong>in</strong>e, it has<br />
<strong>in</strong>creased <strong>in</strong> Assam, Bihar, Orissa, Rajasthan, West<br />
Bengal and Maharashtra.<br />
Table 2.4 provides data <strong>on</strong> <strong>the</strong> status <strong>of</strong><br />
employment <strong>of</strong> female workers over three time<br />
po<strong>in</strong>ts – 1993-94, 1999-2000 and 2004-05 – <strong>in</strong> <strong>the</strong><br />
urban areas <strong>of</strong> <strong>the</strong> major <strong>State</strong>s <strong>of</strong> <strong>India</strong>. Changes<br />
observed <strong>in</strong> <strong>the</strong> pattern <strong>of</strong> employment <strong>of</strong> female
24 REPORT ON THE STATE OF FOOD INSECURITY IN URBAN INDIA<br />
workers, over <strong>the</strong> 12 years s<strong>in</strong>ce 1993-94, have<br />
been somewhat different from that exhibited by<br />
male workers <strong>in</strong> urban <strong>India</strong>. The proporti<strong>on</strong> <strong>of</strong><br />
workers <strong>in</strong> self-employment as well as regular<br />
Sl.<br />
No.<br />
employment has registered an <strong>in</strong>crease while<br />
casual labour has fallen with regard to female<br />
workers <strong>in</strong> urban <strong>India</strong> as a whole. The segment<br />
<strong>of</strong> workers classified as regular has <strong>in</strong>creased <strong>in</strong><br />
Table 2.3<br />
Status <strong>of</strong> Employment <strong>of</strong> Males <strong>in</strong> <strong>Urban</strong> Areas <strong>of</strong> Major <strong>State</strong>s <strong>of</strong> <strong>India</strong>, 1993-94 to 2004-05<br />
Status <strong>of</strong> Employment <strong>of</strong> Males<br />
<strong>State</strong>s Self-Employment Regular Employment Casual Labour<br />
1993-<br />
94<br />
1999-<br />
2000<br />
2004-<br />
05<br />
1993-<br />
94<br />
1999-<br />
2000<br />
2004-<br />
05<br />
1993-<br />
94<br />
1999-<br />
2000<br />
1 Andhra Pradesh 382 358 428 401 420 386 217 222 186<br />
2 Assam 478 483 453 420 405 433 102 112 114<br />
3 Bihar 484 541 497 367 310 339 149 149 164<br />
4 Gujarat 373 408 414 449 359 482 178 233 104<br />
5 Haryana 419 433 478 454 444 447 127 123 75<br />
6 Karnataka 399 379 416 406 417 390 195 204 194<br />
7 Kerala 375 374 405 268 280 252 357 346 342<br />
8 Madhya Pradesh 407 452 452 421 369 399 172 179 150<br />
9 Maharastra 367 330 387 525 540 473 108 130 141<br />
10 Orissa 371 419 462 481 399 357 148 182 181<br />
11 Punjab 487 474 486 398 404 428 115 122 86<br />
12 Rajasthan 472 461 503 432 404 374 96 135 123<br />
13 Tamil Nadu 345 330 380 403 454 452 252 216 167<br />
14 Uttar Pradesh 574 531 546 314 334 364 112 135 91<br />
15 West Bengal 374 431 447 476 399 373 150 170 179<br />
<strong>India</strong> 417 415 448 422 417 406 161 168 146<br />
2004-<br />
05<br />
Note:<br />
1. Status <strong>of</strong> employment is given for 1000 usually employed males<br />
2. NSSO’s def<strong>in</strong>iti<strong>on</strong>s for <strong>the</strong> terms are:<br />
Self-employment: Pers<strong>on</strong>s who operated <strong>the</strong>ir own farm or n<strong>on</strong>-farm enterprises or were engaged <strong>in</strong>dependently <strong>in</strong> a<br />
pr<strong>of</strong>essi<strong>on</strong> or trade <strong>on</strong> own account or with <strong>on</strong>e or a few partners;<br />
Regular employee: Pers<strong>on</strong>s who worked <strong>in</strong> o<strong>the</strong>rs' farm or n<strong>on</strong>-farm enterprises and received salary or wages <strong>on</strong> a<br />
regular basis;<br />
Casual labour: Pers<strong>on</strong> who was casually engaged <strong>in</strong> o<strong>the</strong>rs' farm or n<strong>on</strong>-farm enterprises and received wages accord<strong>in</strong>g<br />
to <strong>the</strong> terms <strong>of</strong> <strong>the</strong> daily or periodic work c<strong>on</strong>tract<br />
Source: NSSO 1997b; NSSO 2001a; NSSO 2006
all <strong>the</strong> <strong>State</strong>s except Rajasthan, West Bengal and<br />
Bihar, while all have registered a decl<strong>in</strong>e <strong>in</strong> <strong>the</strong><br />
proporti<strong>on</strong> <strong>of</strong> casual employment. Rajasthan had<br />
<strong>the</strong> highest share <strong>of</strong> workers <strong>in</strong> self-employment<br />
<strong>in</strong> 1993-94 and this fur<strong>the</strong>r <strong>in</strong>creased to 727 out <strong>of</strong><br />
1000 female workers be<strong>in</strong>g <strong>in</strong> <strong>the</strong> self-employed<br />
category by 2004-05. To recapitulate, <strong>in</strong> <strong>the</strong><br />
case <strong>of</strong> males as well as females, <strong>the</strong> proporti<strong>on</strong><br />
<strong>of</strong> workers <strong>in</strong> <strong>the</strong> self-employment category<br />
has <strong>in</strong>creased remarkably between 1993-94 and<br />
2004-05. The pattern with respect to regular<br />
employment is quite different between males and<br />
Sl.<br />
No.<br />
DIMENSIONS OF FOOD INSECURITY IN URBAN INDIA 25<br />
Table 2.4<br />
females. Am<strong>on</strong>g females, regular employment has<br />
registered an <strong>in</strong>crease <strong>in</strong> all but three <strong>State</strong>s (Bihar,<br />
Rajasthan and West Bengal) while that has not been<br />
<strong>the</strong> case with respect to male workers. Though <strong>the</strong><br />
prelim<strong>in</strong>ary analysis <strong>of</strong> <strong>the</strong> employment pattern<br />
<strong>of</strong> workers <strong>in</strong> urban <strong>India</strong> illustrated a decl<strong>in</strong>e <strong>in</strong><br />
casual employment, it did not however reflect an<br />
improvement <strong>in</strong> <strong>the</strong> employment situati<strong>on</strong> per se.<br />
The analysis carried out by NCEUS showed that <strong>the</strong><br />
<strong>in</strong>crease <strong>in</strong> <strong>the</strong> numbers <strong>in</strong> <strong>the</strong> self-employment and<br />
regular employment categories did not necessarily<br />
po<strong>in</strong>t towards betterment <strong>in</strong> work<strong>in</strong>g c<strong>on</strong>diti<strong>on</strong>s.<br />
Status <strong>of</strong> Employment for Females <strong>in</strong> <strong>Urban</strong> Areas <strong>of</strong> Major <strong>State</strong>s <strong>of</strong> <strong>India</strong>,<br />
1993-94 to 2004-05<br />
Status <strong>of</strong> Employment for Females<br />
<strong>State</strong>s<br />
1993-<br />
94<br />
Self-Employment Regular Employment Casual Labour<br />
1999-<br />
2000<br />
2004-<br />
05<br />
1993-<br />
94<br />
1999-<br />
2000<br />
2004-<br />
05<br />
1993-<br />
94<br />
1999-<br />
2000<br />
1 Andhra Pradesh 460 393 487 175 285 300 365 322 212<br />
2 Assam 283 251 264 500 556 545 217 193 191<br />
3 Bihar 426 513 471 265 252 250 309 235 279<br />
4 Gujarat 426 419 429 241 264 303 333 317 268<br />
5 Haryana 573 535 587 204 330 320 223 135 92<br />
6 Karnataka 459 415 437 254 326 371 287 259 192<br />
7 Kerala 458 509 426 266 319 381 276 172 193<br />
8 Madhya Pradesh 451 504 403 239 172 328 310 324 270<br />
9 Maharashtra 367 374 361 391 410 438 242 216 201<br />
10 Orissa 377 460 379 291 212 352 332 328 269<br />
11 Punjab 500 491 439 415 434 514 85 75 47<br />
12 Rajasthan 638 653 727 202 209 186 160 138 87<br />
13 Tamil Nadu 397 394 443 301 407 412 302 199 145<br />
14 Uttar Pradesh 657 661 593 196 257 330 147 82 77<br />
15 West Bengal 364 436 524 441 401 367 195 163 109<br />
<strong>India</strong> 448 453 477 292 333 356 260 214 167<br />
Note:<br />
1. Status <strong>of</strong> employment is given for 1000 usually employed females<br />
2. Def<strong>in</strong>iti<strong>on</strong>s <strong>of</strong> employment category as <strong>in</strong> Table 2.3<br />
Source: NSSO 1997b; NSSO 2001a; NSSO 2006<br />
2004-<br />
05
26 REPORT ON THE STATE OF FOOD INSECURITY IN URBAN INDIA<br />
Table 2.5 provides data <strong>on</strong> n<strong>on</strong>-agricultural<br />
workers <strong>in</strong> <strong>the</strong> organised and unorganised sectors,<br />
classified by different employment status – selfemployment,<br />
regular employment and casual<br />
workers – for <strong>the</strong> year 2004-05. Out <strong>of</strong> 66.7<br />
milli<strong>on</strong> regular workers, 24.8 milli<strong>on</strong> or 37 per<br />
cent were <strong>in</strong> <strong>the</strong> unorganised sector. A very high<br />
percentage <strong>of</strong> self-employed (97 per cent) figured<br />
<strong>in</strong> <strong>the</strong> unorganised sector. C<strong>on</strong>sider<strong>in</strong>g that n<strong>on</strong>agricultural<br />
activities are predom<strong>in</strong>antly <strong>in</strong> urban<br />
areas, <strong>the</strong> prevalence <strong>of</strong> a very high percentage<br />
<strong>of</strong> unorganised workers <strong>in</strong> n<strong>on</strong>-agriculture<br />
has serious implicati<strong>on</strong>s for food security <strong>in</strong><br />
urban areas. This is fur<strong>the</strong>r corroborated by <strong>the</strong><br />
poverty ratios for different categories <strong>of</strong> workers<br />
estimated by NCEUS.<br />
Table 2.6 <strong>in</strong>dicates that <strong>the</strong> <strong>in</strong>cidence <strong>of</strong><br />
poverty was lower am<strong>on</strong>g organised workers<br />
compared to unorganised workers. Nearly <strong>on</strong>efourth<br />
<strong>of</strong> all n<strong>on</strong>-agricultural workers <strong>in</strong> <strong>the</strong><br />
unorganised sector <strong>in</strong> urban areas have been<br />
classified as poor <strong>in</strong> 2004-05. On an average, 42<br />
out <strong>of</strong> every 100 workers <strong>in</strong> <strong>the</strong> casual labour<br />
category were estimated to be poor. Though <strong>the</strong><br />
corresp<strong>on</strong>d<strong>in</strong>g percentage was lower for regular<br />
workers and self-employed at 20 and 21, it was by<br />
no means <strong>in</strong>significant. However, <strong>the</strong> fact that <strong>the</strong><br />
<strong>in</strong>cidence <strong>of</strong> poverty has been <strong>the</strong> least for regular<br />
workers <strong>in</strong> <strong>the</strong> organised as well as unorganised<br />
sectors suggests that lack <strong>of</strong> regular employment<br />
<strong>in</strong>dicated higher levels <strong>of</strong> poverty and <strong>in</strong>security.<br />
The extent <strong>of</strong> vulnerability <strong>of</strong> unorganised sector<br />
Table 2.5<br />
Size and Distributi<strong>on</strong> <strong>of</strong> <strong>the</strong> Organised and Unorganised Workers <strong>in</strong> N<strong>on</strong>-Agriculture,<br />
All <strong>India</strong>, 2004-05<br />
Category <strong>of</strong><br />
Workers<br />
Number <strong>of</strong> Workers (<strong>in</strong> milli<strong>on</strong>) <strong>in</strong> N<strong>on</strong>-Agriculture<br />
Organised<br />
sector<br />
Unorganised<br />
sector<br />
Total<br />
Self-employed 2.9 89.2 92.1<br />
(3.15) (96.85) (100.00)<br />
Regular worker 41.9 24.8 66.7<br />
(62.82) (37.18) (100.00)<br />
Casual worker 11.7 28.1 39.8<br />
(29.40) (70.60) (100.00)<br />
Total 56.5 142.1 198.5<br />
(28.46) (71.58) (100.00)<br />
Note: Figures <strong>in</strong> brackets are percentages with respect to different category <strong>of</strong> workers<br />
Source: NCEUS 2007: 240
workers <strong>in</strong> n<strong>on</strong>-agricultural activities is also clear<br />
from <strong>the</strong> fact that a very high percentage <strong>of</strong> workers<br />
– 57 per cent <strong>of</strong> casual workers and 47 per cent <strong>of</strong><br />
regular workers – earned below <strong>the</strong> m<strong>in</strong>imum wage<br />
<strong>of</strong> Rs. 66 per day <strong>in</strong> 2004-05 (NCEUS 2007: 259,<br />
262). Dur<strong>in</strong>g <strong>the</strong> period 1993 to 2005, <strong>the</strong> <strong>India</strong>n<br />
ec<strong>on</strong>omy experienced high rates <strong>of</strong> growth and it<br />
is <strong>the</strong>refore a worrisome feature that <strong>the</strong> growth<br />
has excluded a vast majority, leav<strong>in</strong>g <strong>the</strong>m beh<strong>in</strong>d<br />
as poorly paid unorganised workers.<br />
That <strong>the</strong> nature <strong>of</strong> employment that was<br />
generated dur<strong>in</strong>g <strong>the</strong> 1990s was <strong>of</strong> poor quality<br />
comes out from <strong>the</strong> census data too. Table 2.7<br />
<strong>in</strong>dicates a clear tendency towards us<strong>in</strong>g marg<strong>in</strong>al<br />
workforce am<strong>on</strong>g males and females across all<br />
<strong>State</strong>s. While <strong>the</strong> percentage <strong>of</strong> marg<strong>in</strong>al workers<br />
am<strong>on</strong>g males <strong>in</strong> urban <strong>India</strong> was less than 0.7 per<br />
cent and am<strong>on</strong>g females about 11 per cent <strong>in</strong> 1991,<br />
<strong>the</strong> corresp<strong>on</strong>d<strong>in</strong>g percentages <strong>in</strong> 2001 was 6.7<br />
and 21 respectively. That is, <strong>the</strong> share <strong>of</strong> marg<strong>in</strong>al<br />
workers am<strong>on</strong>g males <strong>in</strong>creased by 6 percentage<br />
po<strong>in</strong>ts and that am<strong>on</strong>g females by 9.7 percentage<br />
po<strong>in</strong>ts over 1991-2001. The extent <strong>of</strong> such marg<strong>in</strong>al<br />
DIMENSIONS OF FOOD INSECURITY IN URBAN INDIA 27<br />
Table 2.6<br />
Poverty Ratios am<strong>on</strong>g N<strong>on</strong> Agricultural Workers by Category <strong>of</strong> Workers <strong>in</strong> <strong>India</strong>, 2004-05<br />
(<strong>in</strong> percentage)<br />
Category <strong>of</strong><br />
Workers<br />
Incidence <strong>of</strong> poverty am<strong>on</strong>g n<strong>on</strong>-agricultural workers <strong>in</strong> urban <strong>India</strong><br />
Organised sector Unorganised sector<br />
Self-employed 11.4 21.4<br />
Regular worker 6.8 20.2<br />
Casual worker 35.0 41.5<br />
All workers 10.4 24.1<br />
Source: NCEUS 2007: 25<br />
workers has been much higher am<strong>on</strong>g females<br />
compared to males across all <strong>State</strong>s.<br />
The <strong>in</strong>cidence <strong>of</strong> unemployment <strong>in</strong> <strong>the</strong><br />
urban ec<strong>on</strong>omy is <strong>the</strong> next po<strong>in</strong>t <strong>of</strong> discussi<strong>on</strong>.<br />
Unemployment rate is def<strong>in</strong>ed as <strong>the</strong> number <strong>of</strong><br />
pers<strong>on</strong>s unemployed per 1000 pers<strong>on</strong>s <strong>in</strong> <strong>the</strong><br />
labour force.<br />
The rate <strong>of</strong> unemployment for males <strong>in</strong> urban<br />
<strong>India</strong> measured by <strong>the</strong> usual status approach has<br />
rema<strong>in</strong>ed more or less stagnant over <strong>the</strong> three time<br />
po<strong>in</strong>ts: 45, 48 and 44 <strong>in</strong> 1993-94, 1999-2000 and<br />
2004-05 respectively (Table 2.8).<br />
Usual status approach to unemployment<br />
<strong>in</strong>dicates <strong>the</strong> proporti<strong>on</strong> <strong>of</strong> pers<strong>on</strong>s unemployed<br />
for a relatively l<strong>on</strong>ger period dur<strong>in</strong>g <strong>the</strong> year.<br />
In Karnataka, Tamil Nadu and <strong>the</strong> Punjab,<br />
unemployment rates for males were relatively<br />
low and decl<strong>in</strong><strong>in</strong>g over time. On <strong>the</strong> o<strong>the</strong>r hand,<br />
Orissa, Bihar, Assam, Kerala, Maharashtra and<br />
West Bengal have shown relatively high levels <strong>of</strong><br />
unemployment. Fur<strong>the</strong>r, except Maharashtra and<br />
West Bengal, <strong>the</strong> rest <strong>of</strong> <strong>the</strong> <strong>State</strong>s <strong>in</strong> this group<br />
have registered an <strong>in</strong>crease <strong>in</strong> unemployment rate
28 REPORT ON THE STATE OF FOOD INSECURITY IN URBAN INDIA<br />
Table 2.7<br />
Percentage <strong>of</strong> Marg<strong>in</strong>al Workers am<strong>on</strong>g Males and Females <strong>in</strong> <strong>Urban</strong> Areas <strong>of</strong> Major <strong>State</strong>s <strong>of</strong><br />
<strong>India</strong>, 1991 and 2001<br />
Sl.<br />
No.<br />
<strong>State</strong>s<br />
over 1993-94 to 2004-05. Current daily status<br />
(CDS) unemployment rate, which is <strong>the</strong> most<br />
<strong>in</strong>clusive rate <strong>of</strong> unemployment, has <strong>in</strong>creased<br />
from 67 per 1000 pers<strong>on</strong>s <strong>in</strong> <strong>the</strong> labour force <strong>in</strong><br />
1993-94 to 73 <strong>in</strong> 1999-2000, and fur<strong>the</strong>r to 75<br />
<strong>in</strong> 2004-05 <strong>in</strong> urban <strong>India</strong> as a whole. While <strong>the</strong><br />
usual status unemployment rate is stagnant, an<br />
<strong>in</strong>crease <strong>in</strong> <strong>the</strong> CDS unemployment rate suggests<br />
Percentage <strong>of</strong> Marg<strong>in</strong>al Workers<br />
Males Females<br />
1991 2001 1991 2001<br />
1 Andhra Pradesh 0.4 7.1 7.2 20.5<br />
2 Assam 0.6 5.4 10.7 18.4<br />
3 Bihar 0.4 10.0 15.8 32.0<br />
4 Gujarat 0.4 2.8 16.5 23.5<br />
5 Haryana 0.1 7.4 8.4 28.1<br />
6 Karnataka 0.6 5.5 7.3 15.8<br />
7 Kerala 4.7 12.3 13.2 21.7<br />
8 Madhya Pradesh 0.7 7.7 13.9 26.7<br />
9 Maharashtra 1.2 5.4 9.4 16.8<br />
10 Orissa 1.0 7.0 13.2 28.0<br />
11 Punjab 0.1 4.3 3.9 19.2<br />
12 Rajasthan 0.5 7.3 25.7 32.7<br />
13 Tamil Nadu 0.3 6.1 10.1 14.8<br />
14 Uttar Pradesh 0.4 10.0 21.6 34.2<br />
15 West Bengal 0.6 6.4 6.7 20.8<br />
<strong>India</strong> 0.7 6.7 11.3 21.0<br />
Note: Census def<strong>in</strong>es ‘Marg<strong>in</strong>al workers’ as those workers who had not worked for <strong>the</strong> major part <strong>of</strong> <strong>the</strong> reference period<br />
(i.e. worked less than 6 m<strong>on</strong>ths)<br />
Source: Census <strong>of</strong> <strong>India</strong> 1991; Census <strong>of</strong> <strong>India</strong> 2001<br />
that <strong>the</strong> day-to-day variati<strong>on</strong> <strong>in</strong> employment<br />
availability was very high. C<strong>on</strong>sider<strong>in</strong>g that a<br />
predom<strong>in</strong>ant secti<strong>on</strong> <strong>of</strong> n<strong>on</strong>-agricultural workers<br />
were unorganised workers who did not have any<br />
employment security, <strong>the</strong> observed pattern <strong>of</strong> high<br />
unemployment rate by current daily status was<br />
to be expected. Tamil Nadu and Andhra Pradesh<br />
that had relatively low rates <strong>of</strong> unemployment by
usual status exhibited high rates <strong>of</strong> unemployment<br />
by current daily status, <strong>in</strong>dicat<strong>in</strong>g higher levels<br />
<strong>of</strong> seas<strong>on</strong>ality <strong>in</strong> employment. In seven <strong>State</strong>s<br />
– <strong>the</strong> Punjab, Haryana, Gujarat, Karnataka,<br />
Rajasthan, Uttar Pradesh and Madhya Pradesh –<br />
unemployment rates were low when estimated by<br />
ei<strong>the</strong>r approach. Kerala, which exhibited a decl<strong>in</strong>e<br />
<strong>in</strong> work participati<strong>on</strong> rate, recorded very high<br />
levels <strong>of</strong> unemployment by both approaches.<br />
Table 2.9 <strong>in</strong>dicates that, <strong>in</strong> general, <strong>the</strong><br />
rate <strong>of</strong> unemployment was much higher am<strong>on</strong>g<br />
females. While <strong>the</strong> rate <strong>of</strong> unemployment by usual<br />
status approach stagnated with regard to males,<br />
DIMENSIONS OF FOOD INSECURITY IN URBAN INDIA 29<br />
Table 2.8<br />
Rate <strong>of</strong> Unemployment for Males <strong>in</strong> <strong>Urban</strong> Areas <strong>of</strong> Major <strong>State</strong>s <strong>of</strong> <strong>India</strong>, 1993-94 to 2004-05<br />
Sl.<br />
No.<br />
<strong>State</strong>s<br />
Rate <strong>of</strong> Unemployment for Males<br />
Usual Status Current Daily Status<br />
1993-94 1999-2000 2004-05 1993-94 1999-2000 2004-05<br />
1 Andhra Pradesh 35 42 39 75 72 78<br />
2 Assam 62 91 71 65 99 81<br />
3 Bihar 71 76 78 83 87 99<br />
4 Gujarat 33 21 29 57 40 42<br />
5 Haryana 26 27 36 65 45 58<br />
6 Karnataka 34 30 22 56 53 51<br />
7 Kerala 76 69 90 141 155 174<br />
8 Madhya Pradesh 57 43 39 70 72 65<br />
9 Maharashtra 46 61 46 60 77 81<br />
10 Orissa 73 72 93 98 98 119<br />
11 Punjab 33 31 30 39 48 54<br />
12 Rajasthan 20 27 31 26 47 63<br />
13 Tamil Nadu 49 39 32 86 90 81<br />
14 Uttar Pradesh 36 45 40 48 63 57<br />
15 West Bengal 77 77 64 102 100 99<br />
<strong>India</strong> 45 48 44 67 73 75<br />
Note: NSSO def<strong>in</strong>es <strong>the</strong> terms thus:<br />
Usual Status: The activity status <strong>of</strong> a pers<strong>on</strong> dur<strong>in</strong>g <strong>the</strong> reference period <strong>of</strong> 365 days preced<strong>in</strong>g <strong>the</strong> date <strong>of</strong> survey<br />
Current Daily Status: A pers<strong>on</strong> is c<strong>on</strong>sidered work<strong>in</strong>g for <strong>the</strong> entire day if he had worked four hours or more <strong>on</strong> any<br />
day <strong>of</strong> <strong>the</strong> reference week preced<strong>in</strong>g <strong>the</strong> date <strong>of</strong> survey<br />
Rate <strong>of</strong> unemployment: Number <strong>of</strong> pers<strong>on</strong>s unemployed per 1000 pers<strong>on</strong>s <strong>in</strong> <strong>the</strong> labour force<br />
Source: NSSO 1997b; NSSO 2001a; NSSO 2006<br />
<strong>the</strong> corresp<strong>on</strong>d<strong>in</strong>g rate am<strong>on</strong>g females registered<br />
an <strong>in</strong>crease. Kerala exhibited very high rates <strong>of</strong><br />
unemployment evidenced by both <strong>the</strong> approaches<br />
used. Gujarat, Karnataka, Rajasthan, and Madhya<br />
Pradesh showed similar patterns <strong>of</strong> low rates <strong>of</strong><br />
unemployment am<strong>on</strong>g males as well as females.<br />
However, <strong>in</strong> <strong>the</strong> Punjab, Haryana and Uttar Pradesh<br />
<strong>the</strong> unemployment rates were low <strong>in</strong> 1993-94 and<br />
1999-2000, but have <strong>in</strong>creased above <strong>the</strong> all-<strong>India</strong><br />
average <strong>in</strong> 2004-05.<br />
Table 2.10 presents <strong>the</strong> status <strong>of</strong> employment<br />
<strong>of</strong> male workers across different size classes <strong>of</strong><br />
towns <strong>in</strong> <strong>the</strong> major <strong>State</strong>s <strong>of</strong> <strong>India</strong> dur<strong>in</strong>g 1999-2000
30 REPORT ON THE STATE OF FOOD INSECURITY IN URBAN INDIA<br />
and 2004-05. All urban areas are not homogenous<br />
<strong>in</strong> character. Towns vary with regard to size <strong>of</strong><br />
populati<strong>on</strong>, basic ec<strong>on</strong>omic characteristics and<br />
<strong>the</strong> nature <strong>of</strong> <strong>the</strong>ir l<strong>in</strong>kages with <strong>the</strong> h<strong>in</strong>terland.<br />
The employment issue varies across different<br />
types <strong>of</strong> towns and <strong>the</strong> discussi<strong>on</strong> here perta<strong>in</strong>s to<br />
towns classified by size <strong>of</strong> populati<strong>on</strong>. The NSSO<br />
classifies towns <strong>in</strong>to three categories: Class 1<br />
towns or metropolitan ci ties that have populati<strong>on</strong><br />
over 1 milli<strong>on</strong>; Class 2 towns with populati<strong>on</strong> <strong>in</strong><br />
<strong>the</strong> range <strong>of</strong> 50,000 to 1 milli<strong>on</strong>; and Class 3 towns<br />
with populati<strong>on</strong> less than 50,000. C<strong>on</strong>sider<strong>in</strong>g <strong>the</strong><br />
employment status <strong>of</strong> male workers as a whole, a<br />
marked tendency <strong>of</strong> <strong>in</strong>crease <strong>in</strong> self-employment<br />
was observed <strong>in</strong> <strong>the</strong> <strong>State</strong>s between 1999-2000<br />
and 2004-05. The pattern exhibited by all three<br />
size classes <strong>of</strong> towns was similar. However, <strong>in</strong><br />
Sl.<br />
No.<br />
<strong>the</strong> metropolitan cities, regular employment was<br />
more prom<strong>in</strong>ent than <strong>the</strong> o<strong>the</strong>r two categories<br />
<strong>of</strong> employment. In 1999-2000, am<strong>on</strong>g all <strong>the</strong><br />
metropolitan cities, except <strong>in</strong> Patna (Bihar),<br />
Kanpur and Lucknow (Uttar Pradesh), regular<br />
employment was more prom<strong>in</strong>ent. But, <strong>in</strong> 2004-<br />
05, while <strong>in</strong> a majority <strong>of</strong> <strong>the</strong> metropolitan cities<br />
regular employment rema<strong>in</strong>ed <strong>the</strong> most prom<strong>in</strong>ent<br />
category, <strong>the</strong> pattern changed <strong>in</strong> Hyderabad<br />
(Andhra Pradesh) and Bhopal (Madhya Pradesh)<br />
so that <strong>in</strong> five cities (Hyderabad, Bhopal, Patna,<br />
Kanpur and Lucknow), <strong>the</strong> share <strong>of</strong> workers <strong>in</strong><br />
self-employment was more prom<strong>in</strong>ent. Tamil Nadu<br />
was <strong>the</strong> <strong>on</strong>ly <strong>State</strong> where regular employment was<br />
<strong>the</strong> most important category even am<strong>on</strong>g Class<br />
3 towns. While casual employment has decl<strong>in</strong>ed<br />
across all size classes <strong>of</strong> towns, <strong>in</strong> 2004-05 it<br />
Table 2.9<br />
Rate <strong>of</strong> Unemployment for Females <strong>in</strong> <strong>Urban</strong> Areas <strong>of</strong> Major <strong>State</strong>s <strong>of</strong> <strong>India</strong>,<br />
1993-94 to 2004-05<br />
<strong>State</strong>s<br />
Rate <strong>of</strong> Unemployment for Females<br />
Usual Status Current Daily Status<br />
1993-94 1999-2000 2004-05 1993-94 1999-2000 2004-05<br />
1 Andhra Pradesh 43 42 43 95 89 83<br />
2 Assam 289 223 156 256 219 140<br />
3 Bihar 112 94 37 123 135 56<br />
4 Gujarat 62 26 40 78 54 72<br />
5 Haryana 80 46 131 72 49 131<br />
6 Karnataka 75 47 62 89 59 94<br />
7 Kerala 244 264 429 278 282 423<br />
8 Madhya Pradesh 46 16 25 59 57 74<br />
9 Maharashtra 58 78 58 78 100 112<br />
10 Orissa 78 67 304 93 82 271<br />
11 Punjab 86 35 200 58 53 177<br />
12 Rajasthan 8 37 47 15 35 50<br />
13 Tamil Nadu 84 58 54 127 86 98<br />
14 Uttar Pradesh 16 46 95 48 50 105<br />
15 West Bengal 196 111 137 208 139 137<br />
<strong>India</strong> 82 71 91 105 94 116<br />
Note: For def<strong>in</strong>iti<strong>on</strong>s <strong>of</strong> unemployment, refer to Table 2.8<br />
Source: NSSO 1997b; NSSO 2001a; NSSO 2006
Table 2.10<br />
Status <strong>of</strong> Employment <strong>of</strong> Males across Different Size Classes <strong>of</strong> Towns, 1999-2000 to 2004-05<br />
Status <strong>of</strong> Employment <strong>of</strong> Male Workers <strong>in</strong> Different Size Classes <strong>of</strong> Towns<br />
Class 1 Class 2 Class 3<br />
<strong>State</strong>s 1999-2000 2004-05 1999-2000 2004-05 1999-2000 2004-05<br />
Sl.<br />
No.<br />
SE RE CL SE RE CL SE RE CL SE RE CL SE RE CL SE RE CL<br />
DIMENSIONS OF FOOD INSECURITY IN URBAN INDIA 31<br />
1 Andhra Pradesh 323 494 184 447 427 126 356 436 208 410 392 198 414 315 271 482 325 193<br />
2 Assam - - - - - - 397 501 103 418 458 124 559 330 111 507 395 99<br />
3 Bihar 529 406 64 509 402 89 520 331 148 501 333 166 566 252 182 475 374 151<br />
4 Gujarat 361 376 263 345 594 60 395 375 230 526 347 127 490 318 191 393 456 151<br />
5 Haryana - - - 231 742 26 400 508 92 546 392 62 514 276 209 515 319 166<br />
6 Karnataka 272 582 146 352 462 186 409 391 200 416 397 187 436 325 239 509 276 215<br />
7 Kerala - - - - - - 349 337 313 408 279 313 397 230 373 404 225 372<br />
8 Madhya Pradesh 404 433 163 525 399 76 448 403 149 455 426 119 469 329 202 410 330 260<br />
9 Maharashtra 313 631 57 378 528 94 321 483 197 390 442 169 425 354 222 412 343 245<br />
10 Orissa - - - - - - 391 427 182 426 426 148 446 369 185 522 251 227<br />
11 Punjab 350 497 153 345 604 50 497 428 75 508 406 86 525 276 199 574 302 125<br />
12 Rajasthan 385 556 58 450 466 84 431 410 159 498 380 122 532 340 128 576 260 164<br />
13 Tamil Nadu 311 479 210 351 545 104 347 487 166 407 430 163 331 389 280 358 436 206<br />
14 Uttar Pradesh 453 381 166 512 414 74 512 379 109 576 350 74 637 223 140 511 390 99<br />
15 West Bengal 440 426 134 372 437 191 425 408 167 449 380 171 443 352 206 565 258 177<br />
<strong>India</strong> 368 510 122 395 512 93 408 426 166 460 390 149 473 317 210 488 316 196<br />
Note:<br />
1. Class 1 towns: populati<strong>on</strong> 1 milli<strong>on</strong> and above; Class 2 towns: populati<strong>on</strong> between 50,000 and 1 milli<strong>on</strong>; Class 3 towns: populati<strong>on</strong> less than 50,000<br />
2. SE – Self-employed; RE - Regularly employed; CL - Casual labourers<br />
3. Assam, Kerala and Orissa do not have Class 1 cities<br />
Source: NSSO 2001b; NSSO 2007a
32 REPORT ON THE STATE OF FOOD INSECURITY IN URBAN INDIA<br />
accounted for 19.6 per cent <strong>of</strong> workers <strong>in</strong> Class 3<br />
towns, 14.9 per cent <strong>in</strong> Class 2 towns and 9.3 per<br />
cent <strong>in</strong> Class 1 towns <strong>in</strong> <strong>the</strong> country as a whole.<br />
Am<strong>on</strong>g female workers, <strong>the</strong> <strong>in</strong>crease <strong>in</strong> selfemployment<br />
was visible across all size classes <strong>of</strong><br />
towns though it was higher <strong>in</strong> <strong>the</strong> metropolitan<br />
cities (Table 2.11). As <strong>in</strong> <strong>the</strong> case <strong>of</strong> male workers,<br />
am<strong>on</strong>g female workers too regular employment<br />
was most prom<strong>in</strong>ent <strong>in</strong> <strong>the</strong> metropolitan cities<br />
while <strong>in</strong> <strong>the</strong> o<strong>the</strong>r size classes <strong>of</strong> towns it was<br />
self-employment. While <strong>the</strong> <strong>in</strong>cidence <strong>of</strong> casual<br />
employment am<strong>on</strong>g female workers has decl<strong>in</strong>ed<br />
across all three size classes <strong>of</strong> towns, it still<br />
accounted for 23 per cent am<strong>on</strong>g Class 3 towns <strong>in</strong><br />
2004-05.<br />
Analys<strong>in</strong>g <strong>the</strong> status <strong>of</strong> employment am<strong>on</strong>g<br />
males and females across different size classes <strong>of</strong><br />
towns, it is clear that <strong>in</strong> metropolitan cities regular<br />
employment has been more prom<strong>in</strong>ent and casual<br />
employment <strong>the</strong> least important. On <strong>the</strong> o<strong>the</strong>r<br />
hand, <strong>the</strong> percentage <strong>of</strong> casual workers has been<br />
<strong>the</strong> highest <strong>in</strong> Class 3 towns. Regular employment<br />
need not necessarily guarantee employment<br />
security (given <strong>the</strong> <strong>in</strong>formalisati<strong>on</strong> tendency even<br />
with<strong>in</strong> <strong>the</strong> formal sector). However, Table 2.6 has<br />
shown that <strong>in</strong> 2004-05 <strong>the</strong> <strong>in</strong>cidence <strong>of</strong> poverty was<br />
<strong>the</strong> least am<strong>on</strong>g workers <strong>in</strong> <strong>the</strong> regular employment<br />
category and highest am<strong>on</strong>g workers <strong>in</strong> casual<br />
employment. Therefore, it would not be <strong>in</strong>correct<br />
to argue that given <strong>the</strong> high extent <strong>of</strong> casualisati<strong>on</strong><br />
<strong>of</strong> labour force <strong>in</strong> smaller towns, <strong>the</strong> problems <strong>of</strong><br />
food access would also be more severe here. Data<br />
<strong>on</strong> current daily status <strong>of</strong> unemployment across<br />
different size classes <strong>of</strong> towns substantiates this<br />
argument (Table 2.12).<br />
In general, current daily status unemployment<br />
rate has been <strong>the</strong> highest <strong>in</strong> Class 3 towns am<strong>on</strong>g<br />
males and females <strong>in</strong> 1999-2000 as well as <strong>in</strong><br />
2004-05. There are however some excepti<strong>on</strong>s to<br />
this general pattern. N<strong>on</strong>e<strong>the</strong>less it should not be<br />
taken to mean that <strong>the</strong> problems <strong>of</strong> food security<br />
<strong>in</strong> metropolises and big towns are not severe. Not<br />
<strong>on</strong>ly would <strong>the</strong> magnitude be more severe <strong>in</strong> bigger<br />
towns, it would also be more severe am<strong>on</strong>g certa<strong>in</strong><br />
secti<strong>on</strong>s <strong>of</strong> <strong>the</strong> populati<strong>on</strong>. For <strong>in</strong>stance, Census<br />
2001 c<strong>on</strong>ducted a survey <strong>of</strong> slums <strong>in</strong> all <strong>the</strong> towns<br />
that had a populati<strong>on</strong> above 50,000 that year. An<br />
analysis <strong>of</strong> this data <strong>in</strong>dicates that <strong>the</strong> percentage<br />
<strong>of</strong> marg<strong>in</strong>al workers was much higher <strong>in</strong> slums<br />
compared to n<strong>on</strong>-slum areas <strong>in</strong> all <strong>the</strong> <strong>State</strong>s<br />
(Table 2.13). The percentage <strong>of</strong> marg<strong>in</strong>al workers<br />
was also much higher am<strong>on</strong>g females compared<br />
to males.<br />
In sum, <strong>the</strong> discussi<strong>on</strong> <strong>on</strong> employment<br />
patterns <strong>in</strong>dicates that <strong>the</strong>re has been a significant<br />
<strong>in</strong>crease <strong>in</strong> <strong>the</strong> proporti<strong>on</strong> <strong>of</strong> workers <strong>in</strong> <strong>the</strong> selfemployment<br />
category, am<strong>on</strong>g males and females,<br />
over 1993-94 to 2004-05, across all <strong>the</strong> <strong>State</strong>s <strong>of</strong><br />
<strong>India</strong>. However, regular employment has rema<strong>in</strong>ed<br />
<strong>the</strong> most important status <strong>of</strong> employment for male<br />
workers <strong>in</strong> <strong>the</strong> most urbanised <strong>State</strong>s <strong>of</strong> Tamil Nadu,<br />
Maharashtra and Gujarat. A predom<strong>in</strong>ant secti<strong>on</strong><br />
<strong>of</strong> both male and female workers <strong>in</strong> <strong>the</strong> urban areas<br />
<strong>of</strong> <strong>the</strong> country were unorganised, and earned below<br />
<strong>the</strong> m<strong>in</strong>imum wage level. There has also been a<br />
tendency towards us<strong>in</strong>g marg<strong>in</strong>al workers and this<br />
was more prom<strong>in</strong>ent am<strong>on</strong>g females whose rate <strong>of</strong><br />
unemployment was also relatively high. Analys<strong>in</strong>g<br />
<strong>the</strong> pattern <strong>of</strong> employment across different size<br />
classes <strong>of</strong> towns, it is seen that problems <strong>of</strong> food<br />
access were more severe am<strong>on</strong>g small towns<br />
compared to big towns. In general, smaller towns<br />
exhibited higher unemployment rates as well as<br />
greater employment <strong>of</strong> casual workforce. At <strong>the</strong><br />
same time, s<strong>in</strong>ce slum populati<strong>on</strong>s displayed <strong>the</strong><br />
expected pattern <strong>of</strong> higher <strong>in</strong>cidence <strong>of</strong> marg<strong>in</strong>al<br />
workers and slums accounted for significant<br />
proporti<strong>on</strong>s <strong>of</strong> <strong>the</strong> populati<strong>on</strong>s <strong>of</strong> metropolitan<br />
cities and big towns, <strong>the</strong> problem <strong>of</strong> urban food<br />
<strong>in</strong>security would be quite severe <strong>in</strong> such urban<br />
areas too.
Table 2.11<br />
Status <strong>of</strong> Employment <strong>of</strong> Females across Different Size Classes <strong>of</strong> Towns, 1999-2000 to 2004-05<br />
Status <strong>of</strong> Employment <strong>of</strong> Female Workers <strong>in</strong> Different Size Classes <strong>of</strong> Towns<br />
Class 1 Class 2 Class 3<br />
1999-2000 2004-05 1999-2000 2004-05 1999-2000 2004-05<br />
<strong>State</strong>s<br />
Sl.<br />
No.<br />
SE RE CL SE RE CL SE RE CL SE RE CL SE RE CL SE RE CL<br />
DIMENSIONS OF FOOD INSECURITY IN URBAN INDIA 33<br />
1 Andhra Pradesh 312 382 306 321 542 137 398 278 324 456 308 236 436 261 303 661 138 201<br />
2 Assam - - - - - - 190 583 226 112 615 273 395 509 96 473 432 96<br />
3 Bihar 315 584 101 278 722 0 563 246 190 331 354 315 495 135 369 559 221 220<br />
4 Gujarat 506 239 256 368 383 249 285 315 400 556 272 173 457 264 279 406 242 352<br />
5 Haryana - - - 613 378 8 520 360 120 556 365 79 561 285 154 631 205 164<br />
6 Karnataka 249 584 167 239 672 90 395 349 256 430 369 201 554 140 306 586 161 253<br />
7 Kerala - - - - - - 458 408 133 402 434 163 544 258 199 450 328 221<br />
8 Madhya Pradesh 386 420 193 498 442 60 533 189 278 351 462 188 515 110 376 357 174 469<br />
9 Maharashtra 320 602 77 304 612 85 411 322 267 410 336 253 434 142 423 442 138 420<br />
10 Orissa - - - - - - 518 235 247 344 451 205 410 199 391 429 210 361<br />
11 Punjab 65 863 72 398 508 94 417 497 86 412 554 34 692 251 57 509 443 48<br />
12 Rajasthan 380 546 74 799 167 34 653 233 114 634 277 89 676 143 180 734 123 144<br />
13 Tamil Nadu 298 577 125 226 762 12 452 392 156 480 388 132 398 320 282 442 354 204<br />
14 Uttar Pradesh 584 342 74 594 320 86 555 361 84 405 433 161 802 121 77 594 373 34<br />
15 West Bengal 302 549 148 503 449 49 417 392 192 486 393 120 617 244 139 636 208 157<br />
<strong>India</strong> 352 523 125 382 528 90 447 335 218 472 362 165 525 213 262 547 221 232<br />
Note: For def<strong>in</strong>iti<strong>on</strong> <strong>of</strong> size class <strong>of</strong> towns refer to Table 2.10<br />
Source: NSSO 2001b; NSSO 2007a
34 REPORT ON THE STATE OF FOOD INSECURITY IN URBAN INDIA<br />
Table 2.12<br />
Rate <strong>of</strong> Unemployment for Males and Females across Different Size Classes <strong>of</strong> Towns <strong>in</strong> Major<br />
<strong>State</strong>s <strong>of</strong> <strong>India</strong>, 1999-2000 to 2004-05<br />
Sl.<br />
No.<br />
<strong>State</strong>s<br />
Current Daily Status Unemployment Rate<br />
Males Females<br />
1999-2000 2004-05 1999-2000 2004-05<br />
Class 1 Class 2 Class 3 Class 1 Class 2 Class 3 Class 1 Class 2 Class 3 Class 1 Class 2 Class 3<br />
1 Andhra Pradesh 72 67 86 44 91 66 110 100 54 69 104 39<br />
2 Assam - 64 127 - 86 74 - 101 401 - 86 224<br />
3 Bihar 73 101 73 137 76 123 290 107 121 235 61 50<br />
4 Gujarat 30 40 49 49 26 50 32 80 52 97 32 69<br />
5 Haryana - 32 82 - 59 102 - 61 34 - 144 159<br />
6 Karnataka 42 45 70 40 53 57 85 26 65 185 74 46<br />
7 Kerala - 146 163 - 163 185 - 333 240 - 405 442<br />
8 Madhya Pradesh 90 60 78 81 52 83 38 39 71 65 60 83<br />
9 Maharashtra 80 68 87 74 81 105 114 68 106 70 151 149<br />
10 Orissa - 91 103 - 112 132 - 80 84 - 263 296<br />
11 Punjab 11 53 67 17 66 59 14 74 31 41 197 196<br />
12 Rajasthan 36 40 61 72 66 54 24 56 14 30 81 30<br />
13 Tamil Nadu 85 75 106 64 71 101 58 100 91 41 89 134<br />
14 Uttar Pradesh 75 65 50 49 52 63 45 78 22 39 147 83<br />
15 West Bengal 76 121 81 75 108 102 112 194 75 130 126 212<br />
<strong>India</strong> 65 72 80 61 75 87 84 105 90 77 127 132<br />
Note: For def<strong>in</strong>iti<strong>on</strong> <strong>of</strong> size class <strong>of</strong> towns refer to Table 2.10<br />
Source: NSSO 2001b; NSSO 2007a<br />
2.2 <strong>Food</strong> Absorpti<strong>on</strong><br />
<strong>Food</strong> absorpti<strong>on</strong> is an important dimensi<strong>on</strong><br />
<strong>of</strong> food security and refers to <strong>the</strong> ability <strong>of</strong> people<br />
to absorb food. It is by now well established<br />
that access to certa<strong>in</strong> crucial factors such as safe<br />
dr<strong>in</strong>k<strong>in</strong>g water, health care and envir<strong>on</strong>mental<br />
hygiene determ<strong>in</strong>es <strong>the</strong> c<strong>on</strong>versi<strong>on</strong> efficiency <strong>of</strong><br />
food <strong>in</strong>to energy. Given <strong>the</strong> close l<strong>in</strong>k between<br />
basic amenities and food absorpti<strong>on</strong>, <strong>the</strong> status <strong>of</strong><br />
some crucial amenities across <strong>the</strong> different <strong>State</strong>s<br />
<strong>of</strong> <strong>India</strong> are discussed here.<br />
2.2.1 Hous<strong>in</strong>g C<strong>on</strong>diti<strong>on</strong>s<br />
Assess<strong>in</strong>g hous<strong>in</strong>g c<strong>on</strong>diti<strong>on</strong>s and basic<br />
amenities <strong>in</strong> urban <strong>India</strong>, Amitabh Kundu notes:<br />
‘The rapid growth <strong>of</strong> <strong>the</strong> urban populati<strong>on</strong><br />
and <strong>the</strong> low <strong>in</strong>vestment <strong>in</strong> urban development<br />
has created serious shelter problems and<br />
deficiencies <strong>in</strong> basic amenities <strong>in</strong> <strong>the</strong> towns<br />
and cities <strong>of</strong> <strong>the</strong> country’ (Kundu 2009: 162).<br />
Table 2.14 provides <strong>the</strong> percentage<br />
distributi<strong>on</strong> <strong>of</strong> urban households by structure<br />
<strong>of</strong> build<strong>in</strong>g.
Sl.<br />
No.<br />
Over 1993-94 to 2002, <strong>the</strong> percentage <strong>of</strong><br />
pucca houses has registered an <strong>in</strong>crease <strong>in</strong> <strong>the</strong><br />
urban areas <strong>of</strong> all <strong>the</strong> <strong>State</strong>s except Karnataka,<br />
Kerala, Punjab and West Bengal 9 . In <strong>the</strong>se four<br />
<strong>State</strong>s, <strong>the</strong> percentage <strong>of</strong> katcha structures has<br />
registered an <strong>in</strong>crease. In urban <strong>India</strong> as a whole,<br />
77 per cent <strong>of</strong> households lived <strong>in</strong> pucca structures<br />
<strong>in</strong> 2002 as aga<strong>in</strong>st 71 per cent <strong>in</strong> 1993-94. On <strong>the</strong><br />
DIMENSIONS OF FOOD INSECURITY IN URBAN INDIA 35<br />
Table 2.13<br />
Percentage <strong>of</strong> Marg<strong>in</strong>al Workers <strong>in</strong> Slums and N<strong>on</strong> Slum Areas, <strong>India</strong>, 2001<br />
<strong>State</strong>s<br />
Males Females<br />
Slums N<strong>on</strong> Slum Areas Slums N<strong>on</strong> Slum Areas<br />
1 Andhra Pradesh 8.89 5.68 21.29 15.60<br />
2 Assam 4.83 4.31 14.85 12.04<br />
3 Bihar 12.10 8.48 33.30 23.18<br />
4 Gujarat 3.44 2.21 21.22 17.98<br />
5 Haryana 9.14 5.85 29.54 17.40<br />
6 Karnataka 7.44 4.56 15.62 11.87<br />
7 Kerala 14.08 9.94 18.08 15.29<br />
8 Madhya Pradesh 9.51 6.24 23.24 17.48<br />
9 Maharashtra 6.53 4.12 16.41 12.24<br />
10 Orissa 7.91 4.65 24.45 16.85<br />
11 Punjab 5.41 3.79 21.86 14.61<br />
12 Rajasthan 10.62 6.03 29.81 21.30<br />
13 Tamil Nadu 7.19 3.95 13.87 9.35<br />
14 Uttar Pradesh 12.01 8.45 29.43 22.29<br />
15 West Bengal 7.77 5.41 20.37 15.68<br />
<strong>India</strong> 7.82 5.15 19.87 14.54<br />
Note:<br />
1. For def<strong>in</strong>iti<strong>on</strong> <strong>of</strong> marg<strong>in</strong>al worker refer to Table 2.7<br />
2. The data <strong>on</strong> n<strong>on</strong>-slum populati<strong>on</strong> <strong>in</strong> this table is with reference to towns with populati<strong>on</strong> 50,000+ where slums were<br />
enumerated<br />
Source: Census <strong>of</strong> <strong>India</strong>, 2001<br />
9 See note to Table 2.14 for def<strong>in</strong>iti<strong>on</strong>s <strong>of</strong> pucca, katcha and semi-pucca.<br />
o<strong>the</strong>r hand, households <strong>in</strong> semi-pucca structures<br />
have decl<strong>in</strong>ed from 10 per cent <strong>in</strong> 1993-94 to 3 per<br />
cent <strong>in</strong> 2002 while households <strong>in</strong> katcha structures<br />
have rema<strong>in</strong>ed <strong>the</strong> same at 20 percent over <strong>the</strong><br />
same period. Even with<strong>in</strong> <strong>the</strong> slums and squatter<br />
settlements <strong>in</strong> urban <strong>India</strong>, about 67 per cent <strong>of</strong><br />
households lived <strong>in</strong> pucca structures (NSSO 2004).<br />
There is, however, wide variati<strong>on</strong> across <strong>the</strong> <strong>State</strong>s
36 REPORT ON THE STATE OF FOOD INSECURITY IN URBAN INDIA<br />
Sl.<br />
No.<br />
Note: Follow<strong>in</strong>g are <strong>the</strong> def<strong>in</strong>iti<strong>on</strong>s given by NSSO:<br />
A pucca structure is <strong>on</strong>e whose walls and ro<strong>of</strong> are made <strong>of</strong> burnt bricks, st<strong>on</strong>e, cement, c<strong>on</strong>crete, jack board (cement<br />
- plastered reeds), mosaic, tiles or timber. Tiles, galvanised t<strong>in</strong> or asbestos cement sheets used <strong>in</strong> c<strong>on</strong>structi<strong>on</strong> <strong>of</strong> ro<strong>of</strong>s<br />
will be regarded as pucca material<br />
A katcha structure is <strong>on</strong>e whose walls and ro<strong>of</strong>s are made up with mud, bamboo, grass, leaves, reeds, thatch or unburnt<br />
bricks<br />
A semi-pucca structure is <strong>on</strong>e <strong>of</strong> which ei<strong>the</strong>r <strong>the</strong> ro<strong>of</strong> or <strong>the</strong> walls, but not both, is made like that <strong>of</strong> a pucca structure<br />
Source: NSSO 1997c; NSSO 2004<br />
<strong>in</strong> percentage <strong>of</strong> pucca houses <strong>in</strong> slums, with 90<br />
per cent <strong>in</strong> <strong>the</strong> Punjab and 17 per cent <strong>in</strong> Bihar.<br />
The predom<strong>in</strong>ance <strong>of</strong> pucca structures <strong>in</strong> urban<br />
areas – <strong>in</strong> slums as well as n<strong>on</strong>-slum areas – does<br />
not necessarily mean that <strong>the</strong> quality <strong>of</strong> hous<strong>in</strong>g<br />
has been very good. Table 2.15 clearly shows a<br />
positive associati<strong>on</strong> between use <strong>of</strong> pucca materials<br />
and m<strong>on</strong>thly per capita expenditure (MPCE).<br />
In <strong>the</strong> lowest c<strong>on</strong>sumpti<strong>on</strong> expenditure class, 47<br />
Table 2.14<br />
Percentage Distributi<strong>on</strong> <strong>of</strong> <strong>Urban</strong> Households by Structure <strong>of</strong> Build<strong>in</strong>g, 1993-94 and 2002<br />
<strong>State</strong>s<br />
Percentage Distributi<strong>on</strong> <strong>of</strong> Households by Structure <strong>of</strong> Build<strong>in</strong>g<br />
Pucca Katcha Semi-Pucca<br />
1993-94 2002 1993-94 2002 1993-94 2002<br />
1 Andhra Pradesh 66.5 80.0 15.8 15.0 17.7 5.0<br />
2 Assam 45.9 65.0 26.4 25.0 27.7 10.0<br />
3 Bihar 64.3 68.6 25.8 27.0 9.9 4.2<br />
4 Gujarat 80.0 91.0 15.7 8.0 4.3 1.0<br />
5 Haryana 90.0 90.0 4.6 10.0 5.4 0.0<br />
6 Karnataka 67.2 64.0 25.9 33.0 6.9 3.0<br />
7 Kerala 67.7 53.0 19.6 44.0 12.7 3.0<br />
8 Madhya Pradesh 58.2 59.1 37.6 39.0 4.2 1.6<br />
9 Maharashtra 74.7 83.0 20.4 16.0 4.9 1.0<br />
10 Orissa 59.0 68.0 15.6 21.0 25.4 11.0<br />
11 Punjab 89.1 85.0 8.1 14.0 2.7 1.0<br />
12 Rajasthan 85.7 87.0 8.2 9.0 8.0 4.0<br />
13 Tamil Nadu 64.1 63.0 19.8 29.0 16.2 8.0<br />
14 Uttar Pradesh 73.1 92.3 18.0 7.0 8.9 0.9<br />
15 West Bengal 68.1 65.0 22.8 33.0 9.2 2.0<br />
<strong>India</strong> 70.7 77.0 19.5 20.0 9.9 3.0<br />
per cent <strong>of</strong> households <strong>in</strong> n<strong>on</strong>-slum areas lived <strong>in</strong><br />
dwell<strong>in</strong>gs made <strong>of</strong> n<strong>on</strong>-pucca floor<strong>in</strong>g material<br />
while <strong>the</strong> corresp<strong>on</strong>d<strong>in</strong>g percentage for slum areas<br />
was as high as 64. C<strong>on</strong>sider<strong>in</strong>g <strong>the</strong> pl<strong>in</strong>th area <strong>of</strong><br />
houses or dwell<strong>in</strong>g units, <strong>in</strong> urban slums 80 per<br />
cent <strong>of</strong> households and <strong>in</strong> n<strong>on</strong>-slum areas 48 per<br />
cent <strong>of</strong> households lived <strong>in</strong> less than 50 sq.m <strong>of</strong><br />
area <strong>in</strong> 2002 (NSSO 2004: 36). An analysis <strong>of</strong> <strong>the</strong><br />
type <strong>of</strong> material used <strong>in</strong> c<strong>on</strong>structi<strong>on</strong> as well as <strong>the</strong>
DIMENSIONS OF FOOD INSECURITY IN URBAN INDIA 37<br />
Table 2.15<br />
Percentage <strong>of</strong> Dwell<strong>in</strong>g Units with Pucca Floor, Pucca Ro<strong>of</strong> and Pucca Wall <strong>in</strong> <strong>Urban</strong> <strong>India</strong>, 2002<br />
Percentage <strong>of</strong> dwell<strong>in</strong>g units <strong>in</strong><br />
Slum Areas N<strong>on</strong>-slum Areas All <strong>Urban</strong><br />
MPCE (Rs.) Pucca Pucca Pucca Pucca Pucca Pucca Pucca Pucca Pucca<br />
Floor Wall Ro<strong>of</strong> Floor Wall Ro<strong>of</strong> Floor Wall Ro<strong>of</strong><br />
0 - 300 36 48 68 53 71 87 50 66 83<br />
300 - 350 53 66 75 52 70 84 52 69 82<br />
350 - 425 69 70 86 61 76 88 63 75 88<br />
425 - 500 64 69 82 71 81 88 69 79 87<br />
500 - 575 76 79 86 77 84 91 77 83 90<br />
575 - 665 85 86 94 86 87 94 86 87 94<br />
665 - 775 88 91 90 90 92 97 90 92 96<br />
775 - 915 91 88 97 94 93 97 93 92 97<br />
915 - 1120 95 92 95 97 97 99 96 97 98<br />
1120 - 1500 97 97 96 98 99 99 98 99 99<br />
1500 - 1925 98 98 99 99 98 99 99 98 99<br />
1925 or more 96 99 94 99 100 100 99 100 100<br />
not reported 53 59 55 78 87 91 77 86 90<br />
All Classes 79 81 89 87 91 95 87 90 95<br />
Note:<br />
1. Accord<strong>in</strong>g to NSSO, a slum is a compact area with a collecti<strong>on</strong> <strong>of</strong> poorly built tenements, mostly <strong>of</strong> temporary nature,<br />
crowded toge<strong>the</strong>r, usually with <strong>in</strong>adequate sanitary and dr<strong>in</strong>k<strong>in</strong>g water facilities <strong>in</strong> unhygienic c<strong>on</strong>diti<strong>on</strong>s<br />
2. In this Table, slums <strong>in</strong>clude squatter settlements which are unauthorised settlements with unauthorised structures<br />
Source: NSSO 2004<br />
pl<strong>in</strong>th area <strong>of</strong> houses <strong>in</strong> urban <strong>India</strong> has <strong>in</strong>dicated<br />
that a high percentage <strong>of</strong> pucca houses did not<br />
necessarily po<strong>in</strong>t to good quality hous<strong>in</strong>g.<br />
2.2.2 Safe Dr<strong>in</strong>k<strong>in</strong>g Water and Toilets<br />
The Bhore Committee, which studied <strong>the</strong><br />
public health problem <strong>in</strong> <strong>India</strong> as far back as<br />
<strong>the</strong> pre-Independence 1940s, emphasised <strong>the</strong><br />
importance <strong>of</strong> improv<strong>in</strong>g general sanitati<strong>on</strong> <strong>in</strong><br />
order to address largely preventable illnesses.<br />
Despite <strong>the</strong> l<strong>in</strong>k between basic amenities such as<br />
clean water supply and sanitati<strong>on</strong> and <strong>the</strong> health<br />
status <strong>of</strong> a populati<strong>on</strong> be<strong>in</strong>g well established, <strong>the</strong><br />
availability and accessibility <strong>of</strong> such amenities<br />
<strong>in</strong> <strong>the</strong> country has been far from satisfactory. The<br />
percentage <strong>of</strong> urban households hav<strong>in</strong>g access to<br />
safe dr<strong>in</strong>k<strong>in</strong>g water has g<strong>on</strong>e up <strong>in</strong> all <strong>the</strong> <strong>State</strong>s<br />
dur<strong>in</strong>g <strong>the</strong> 1990s. In <strong>the</strong> country as a whole, access<br />
to safe dr<strong>in</strong>k<strong>in</strong>g water am<strong>on</strong>g urban households<br />
<strong>in</strong>creased from 81 per cent <strong>in</strong> 1991 to 90 per cent<br />
<strong>in</strong> 2001. Accord<strong>in</strong>g to <strong>the</strong> census term<strong>in</strong>ology,<br />
dr<strong>in</strong>k<strong>in</strong>g water supplies from taps, hand pumps<br />
or tubewells is c<strong>on</strong>sidered “safe” while supplies<br />
from wells and tanks is c<strong>on</strong>sidered “unsafe”.<br />
Under this def<strong>in</strong>iti<strong>on</strong> <strong>of</strong> safe dr<strong>in</strong>k<strong>in</strong>g water,<br />
Kerala that relies largely <strong>on</strong> well water for
38 REPORT ON THE STATE OF FOOD INSECURITY IN URBAN INDIA<br />
dr<strong>in</strong>k<strong>in</strong>g purposes has been figur<strong>in</strong>g poorly.<br />
It is a worrisome factor that even <strong>in</strong> Tamil<br />
Nadu, which is c<strong>on</strong>sidered a developed <strong>State</strong>,<br />
nearly 12 per cent <strong>of</strong> urban households did not<br />
have access to safe dr<strong>in</strong>k<strong>in</strong>g water <strong>in</strong> 2005-06.<br />
Orissa and Assam also faired poorly as is clear from<br />
Table 2.16. The picture is even more bleak<br />
if <strong>the</strong> loose def<strong>in</strong>iti<strong>on</strong> <strong>of</strong> “access to safe<br />
dr<strong>in</strong>k<strong>in</strong>g water” adopted by <strong>the</strong> Census is taken<br />
<strong>in</strong>to account. In <strong>the</strong> words <strong>of</strong> Amitabh Kundu:<br />
‘The Census <strong>of</strong> 2001, however, has <strong>in</strong>troduced a<br />
special ‘away’ category with<strong>in</strong> <strong>the</strong> category ‘outside<br />
<strong>the</strong> premises’ which would prompt many <strong>of</strong> <strong>the</strong>se<br />
Table 2.16<br />
households to report positively to <strong>the</strong> questi<strong>on</strong><br />
<strong>of</strong> hav<strong>in</strong>g access, <strong>the</strong>reby <strong>in</strong>flat<strong>in</strong>g <strong>the</strong> figure’<br />
(Kundu 2009: 165). Accord<strong>in</strong>g to <strong>the</strong> Nati<strong>on</strong>al<br />
Family Health Survey (NFHS), <strong>the</strong> percentage<br />
<strong>of</strong> urban households without access to safe<br />
dr<strong>in</strong>k<strong>in</strong>g water <strong>in</strong> <strong>the</strong> country as a whole rema<strong>in</strong>ed<br />
more or less <strong>the</strong> same, at 7.4 <strong>in</strong> 1998-99 and<br />
7.7 <strong>in</strong> 2005-06. The overall pattern exhibited<br />
by data from <strong>the</strong> Census and NFHS has been<br />
similar as regards access to safe dr<strong>in</strong>k<strong>in</strong>g water<br />
for urban households across <strong>the</strong> <strong>State</strong>s. However,<br />
Karnataka’s positi<strong>on</strong> has worsened accord<strong>in</strong>g<br />
to NFHS while it has improved with regard to <strong>the</strong><br />
Census.<br />
Percentage <strong>of</strong> <strong>Urban</strong> Households Without Access to Safe Dr<strong>in</strong>k<strong>in</strong>g Water 1991, 2001 and 2005-06<br />
Sl.<br />
No.<br />
<strong>State</strong>s Percentage <strong>of</strong> <strong>Urban</strong> Households without Access to SDW <strong>in</strong><br />
1991 2001 2005-06<br />
1 Andhra Pradesh 26.18 9.80 3.60<br />
2 Assam 35.93 29.60 21.80<br />
3 Bihar 26.61 8.80 12.26<br />
4 Gujarat 12.77 4.60 4.10<br />
5 Haryana 6.82 2.70 1.40<br />
6 Karnataka 18.62 7.90 14.40<br />
7 Kerala 61.32 57.20 52.00<br />
8 Madhya Pradesh 20.55 11.40 8.51<br />
9 Maharashtra 9.50 4.60 1.50<br />
10 Orissa 37.17 27.70 21.20<br />
11 Punjab 5.76 1.10 0.40<br />
12 Rajasthan 13.49 6.50 2.40<br />
13 Tamil Nadu 25.83 14.10 11.80<br />
14 Uttar Pradesh 14.22 2.80 2.01<br />
15 West Bengal 13.77 7.70 3.60<br />
Note:<br />
<strong>India</strong> 18.62 10.00 7.70<br />
1. Accord<strong>in</strong>g to Census, SDW refers to water from taps, hand pumps and tubewells<br />
2. Accord<strong>in</strong>g to NFHS 3, SDW refers to water from piped sources or public taps or tubewells<br />
Source: Census <strong>of</strong> <strong>India</strong> 1991; Census <strong>of</strong> <strong>India</strong> 2001; NFHS 2007
From NSSO data for <strong>the</strong> year 2002, it is clear<br />
that just about <strong>on</strong>e-fourth <strong>of</strong> urban households<br />
(26.6 per cent) <strong>in</strong> <strong>the</strong> country had access to dr<strong>in</strong>k<strong>in</strong>g<br />
water with<strong>in</strong> <strong>the</strong> dwell<strong>in</strong>g. Am<strong>on</strong>g <strong>the</strong> more<br />
developed <strong>State</strong>s, Tamil Nadu, Andhra Pradesh<br />
and West Bengal faired poorly and am<strong>on</strong>g<br />
<strong>the</strong> less developed <strong>State</strong>s, Orissa, Assam and<br />
Madhya Pradesh faired equally poorly, with<br />
regard to dr<strong>in</strong>k<strong>in</strong>g water with<strong>in</strong> <strong>the</strong> premises<br />
(Table 2.17).<br />
Analys<strong>in</strong>g <strong>the</strong> access to safe dr<strong>in</strong>k<strong>in</strong>g<br />
water for urban households across different size<br />
classes <strong>of</strong> towns, it is clear that <strong>the</strong> problem has<br />
been relatively more acute am<strong>on</strong>g <strong>the</strong> smaller<br />
size classes <strong>of</strong> towns (Table 2.18). Across all<br />
Sl.<br />
No.<br />
DIMENSIONS OF FOOD INSECURITY IN URBAN INDIA 39<br />
<strong>the</strong> <strong>State</strong>s, a lower percentage <strong>of</strong> households had<br />
access to safe dr<strong>in</strong>k<strong>in</strong>g water <strong>in</strong> Class 3 towns<br />
compared to Class 2 and Class 1 towns. In<br />
Tamil Nadu, however, access to safe dr<strong>in</strong>k<strong>in</strong>g<br />
water was more severe <strong>in</strong> metropolitan cities<br />
(Class 1) compared to <strong>the</strong> big and medium towns<br />
(Class 2). It is quite likely that <strong>the</strong> disparity between<br />
different size classes would have surfaced more<br />
sharply if towns had been grouped <strong>in</strong>to more size<br />
classes than <strong>the</strong> three broad size classes c<strong>on</strong>sidered.<br />
Table 2.18 also br<strong>in</strong>gs out <strong>the</strong> fact that <strong>the</strong><br />
percentage <strong>of</strong> households that accessed safe<br />
dr<strong>in</strong>k<strong>in</strong>g water with<strong>in</strong> <strong>the</strong>ir premises was not<br />
<strong>on</strong>ly low but varied across different size classes<br />
<strong>of</strong> towns. In <strong>the</strong> country as a whole, even <strong>in</strong> <strong>the</strong><br />
Table 2.17<br />
Some Aspects <strong>on</strong> Accessibility <strong>of</strong> <strong>Urban</strong> Households to Safe Dr<strong>in</strong>k<strong>in</strong>g Water, 2002<br />
<strong>State</strong>s<br />
Percentage <strong>of</strong> Households hav<strong>in</strong>g Safe Dr<strong>in</strong>k<strong>in</strong>g Water<br />
With<strong>in</strong><br />
Dwell<strong>in</strong>g<br />
Outside Dwell<strong>in</strong>g<br />
With<strong>in</strong> Premises<br />
Outside<br />
Premises<br />
1 Andhra Pradesh 16.30 21.40 62.20<br />
2 Assam 11.30 50.40 38.20<br />
3 Bihar 21.73 18.27 61.00<br />
4 Gujarat 40.40 21.70 37.00<br />
5 Haryana 36.40 13.30 47.10<br />
6 Karnataka 16.40 21.70 61.80<br />
7 Kerala 20.70 48.70 30.60<br />
8 Madhya Pradesh 12.72 14.49 72.63<br />
9 Maharashtra 28.30 20.60 51.10<br />
10 Orissa 8.70 16.60 74.60<br />
11 Punjab 63.40 24.20 12.40<br />
12 Rajasthan 26.70 14.00 58.40<br />
13 Tamil Nadu 15.70 14.60 69.40<br />
14 Uttar Pradesh 42.40 14.58 43.00<br />
15 West Bengal 19.00 16.60 64.50<br />
<strong>India</strong> 26.60 20.10 53.00<br />
Source: NSSO 2004
40 REPORT ON THE STATE OF FOOD INSECURITY IN URBAN INDIA<br />
Sl.<br />
No.<br />
metropolitan cities just about three-fourths <strong>of</strong><br />
households were able to access safe dr<strong>in</strong>k<strong>in</strong>g<br />
water with<strong>in</strong> <strong>the</strong>ir premises. This percentage<br />
was much lower <strong>in</strong> Class 2 and Class 3 towns,<br />
at 67.78 and 57.89 per cent, respectively. All <strong>the</strong><br />
<strong>State</strong>s, with <strong>the</strong> excepti<strong>on</strong> <strong>of</strong> Haryana and <strong>the</strong><br />
Punjab, replicated <strong>the</strong> pattern. The variati<strong>on</strong> <strong>in</strong><br />
access to safe dr<strong>in</strong>k<strong>in</strong>g water with<strong>in</strong> <strong>the</strong> premises<br />
was very sharp across different size classes <strong>in</strong><br />
Andhra Pradesh, Karnataka, Tamil Nadu and<br />
Bihar while <strong>in</strong> Gujarat, Rajasthan, <strong>the</strong> Punjab<br />
and Haryana <strong>the</strong> difference as not very much. As<br />
regards availability <strong>of</strong> safe dr<strong>in</strong>k<strong>in</strong>g water <strong>in</strong> <strong>the</strong><br />
Table 2.18<br />
Percentage <strong>of</strong> <strong>Urban</strong> Households hav<strong>in</strong>g Safe Dr<strong>in</strong>k<strong>in</strong>g Water across<br />
Different Size Classes <strong>of</strong> Towns, 2001<br />
<strong>State</strong>s<br />
Percentage <strong>of</strong> Households with<br />
access to SDW <strong>in</strong><br />
Class 1 Class 2 Class 3<br />
towns towns towns<br />
Percentage <strong>of</strong> Households with<br />
SDW with<strong>in</strong> premises <strong>in</strong><br />
Class 1 Class 2 Class 3<br />
towns towns towns<br />
1 Andhra Pradesh 94.48 89.73 85.95 78.07 54.99 44.07<br />
2 Assam NA NA NA NA NA NA<br />
3 Bihar 94.35 77.06 72.42 66.11 73.24 35.29<br />
4 Gujarat 97.06 95.85 91.60 80.08 76.38 72.21<br />
5 Haryana 97.16 97.81 96.18 66.92 82.68 73.23<br />
6 Karnataka 96.22 92.27 87.34 75.14 53.72 42.44<br />
7 Kerala - 51.20 27.80 - 75.20 70.80<br />
8 Madhya Pradesh 96.40 92.27 84.47 52.74 52.46 35.44<br />
9 Maharashtra 97.35 94.85 89.00 76.41 74.10 71.25<br />
10 Orissa - 72.85 71.59 - 60.52 36.76<br />
11 Punjab 99.45 99.01 98.01 93.32 94.07 89.67<br />
12 Rajasthan 94.70 94.84 90.43 83.51 82.10 73.37<br />
13 Tamil Nadu 85.63 88.91 83.29 38.10 58.15 70.83<br />
14 Uttar Pradesh 99.20 74.94 71.98 68.41 82.20 44.50<br />
15 West Bengal 97.48 91.62 87.25 59.81 55.51 37.21<br />
<strong>India</strong> 98.49 92.16 86.13 74.98 67.78 57.89<br />
Note:<br />
1. For def<strong>in</strong>iti<strong>on</strong> <strong>of</strong> size class <strong>of</strong> towns refer to Table 2.10<br />
2. Town-wise data not available for Assam<br />
3. Figures for <strong>India</strong> refer to <strong>the</strong> 14 major <strong>State</strong>s that are c<strong>on</strong>sidered here<br />
Source: Census <strong>of</strong> <strong>India</strong> 2001<br />
slums, <strong>the</strong> major source <strong>of</strong> dr<strong>in</strong>k<strong>in</strong>g water was taps<br />
followed by tubewells and hand pumps <strong>in</strong> most<br />
<strong>State</strong>s, while <strong>in</strong> <strong>the</strong> Punjab, Rajasthan and Bihar<br />
sources o<strong>the</strong>r than taps were predom<strong>in</strong>ant <strong>in</strong> 2002<br />
(NSSO 2003).<br />
Access to toilets has been a major<br />
problem for urban households <strong>in</strong> <strong>India</strong>. Though<br />
Table 2.19 <strong>in</strong>dicates an improvement <strong>in</strong> <strong>the</strong><br />
situati<strong>on</strong> over <strong>the</strong> 1990s, it is clear that <strong>on</strong>e<br />
out <strong>of</strong> every four households did not have<br />
access to toilets <strong>in</strong> urban <strong>India</strong> <strong>in</strong> 2001. The<br />
problem was very acute <strong>in</strong> Madhya Pradesh,<br />
Orissa and Bihar as well as <strong>in</strong> Tamil Nadu.
Sl.<br />
No.<br />
With <strong>the</strong> excepti<strong>on</strong> <strong>of</strong> Uttar Pradesh, <strong>in</strong> all <strong>the</strong><br />
o<strong>the</strong>r <strong>State</strong>s <strong>the</strong>re was a progressive deteriorati<strong>on</strong><br />
<strong>in</strong> access to toilets as <strong>on</strong>e moved from large<br />
towns to small <strong>on</strong>es. Am<strong>on</strong>g Class 3 towns, Tamil<br />
Nadu had <strong>the</strong> worst scenario with <strong>on</strong>e out <strong>of</strong> two<br />
households without access to toilets. Needless<br />
to say, <strong>the</strong> situati<strong>on</strong> was quite serious am<strong>on</strong>g <strong>the</strong><br />
slums compared to n<strong>on</strong>-slum areas. Am<strong>on</strong>g <strong>the</strong><br />
eight metropolitan cities <strong>of</strong> Chennai, Mumbai,<br />
Nagpur, Hyderabad, Meerut, Kolkata, Delhi<br />
and Indore where NFHS c<strong>on</strong>ducted a survey <strong>in</strong><br />
2005-06, <strong>the</strong> percentage <strong>of</strong> households without<br />
toilet facility was <strong>the</strong> highest <strong>in</strong> Delhi slums (19),<br />
DIMENSIONS OF FOOD INSECURITY IN URBAN INDIA 41<br />
Table 2.19<br />
Percentage <strong>of</strong> <strong>Urban</strong> Households without Access to Toilets, 1991 and 2001<br />
<strong>State</strong>s<br />
Percentage <strong>of</strong> <strong>Urban</strong> Households without<br />
Access to Toilets <strong>in</strong><br />
1991 2001<br />
All <strong>Urban</strong> Class 1 Class 2 Class 3 All <strong>Urban</strong><br />
1 Andhra Pradesh 45.40 9.00 22.00 40.00 21.93<br />
2 Assam 13.94 NA NA NA 5.40<br />
3 Bihar 43.46 9.01 27.27 45.52 30.31<br />
4 Gujarat 34.29 13.05 19.11 30.83 19.45<br />
5 Haryana 35.75 21.59 14.64 29.41 19.34<br />
6 Karnataka 37.48 0.11 19.20 37.19 24.77<br />
7 Kerala 27.34 - 7.92 8.09 7.98<br />
8 Madhya Pradesh 47.00 18.00 29.70 44.09 32.30<br />
9 Maharashtra 35.55 44.22 36.00 46.55 41.90<br />
10 Orissa 50.73 - 33.42 50.00 40.31<br />
11 Punjab 26.77 8.39 10.86 24.39 13.48<br />
12 Rajasthan 37.73 13.85 19.95 36.90 23.89<br />
13 Tamil Nadu 42.53 10.22 26.94 50.90 35.67<br />
14 Uttar Pradesh 33.46 24.52 10.65 20.97 19.99<br />
15 West Bengal 21.25 4.65 14.69 31.06 15.15<br />
<strong>India</strong> 36.15 25.03 21.81 38.52 26.28<br />
Note:<br />
1. For def<strong>in</strong>iti<strong>on</strong> <strong>of</strong> size class <strong>of</strong> towns refer to Table 2.10<br />
2. Town-wise data not available for Assam<br />
3. Figures for <strong>India</strong> refer to <strong>the</strong> 14 major <strong>State</strong>s that are c<strong>on</strong>sidered here<br />
Source: Census <strong>of</strong> <strong>India</strong> 2001<br />
followed by Meerut (18) and Nagpur (12.5)<br />
(NFHS 2007).<br />
In sum, <strong>the</strong> discussi<strong>on</strong> <strong>on</strong> <strong>the</strong> status <strong>of</strong><br />
basic amenities suggests that significant secti<strong>on</strong>s<br />
<strong>of</strong> urban populati<strong>on</strong> are not yet covered. There<br />
is vast scope to improve hous<strong>in</strong>g c<strong>on</strong>diti<strong>on</strong>s,<br />
sanitati<strong>on</strong> and dr<strong>in</strong>k<strong>in</strong>g water supplies for urban<br />
households across <strong>the</strong> <strong>State</strong>s <strong>of</strong> <strong>India</strong>. Availability<br />
<strong>of</strong> basic amenities is much more <strong>of</strong> a problem<br />
for households <strong>in</strong> small towns compared to those<br />
<strong>in</strong> large <strong>on</strong>es. The Government <strong>of</strong> <strong>India</strong> and <strong>the</strong><br />
various <strong>State</strong> Governments have taken a large<br />
number <strong>of</strong> <strong>in</strong>itiatives over <strong>the</strong> years to improve
42 REPORT ON THE STATE OF FOOD INSECURITY IN URBAN INDIA<br />
<strong>the</strong> provisi<strong>on</strong> <strong>of</strong> basic services for <strong>the</strong> urban<br />
populati<strong>on</strong>. The Jawaharlal Nehru Nati<strong>on</strong>al<br />
<strong>Urban</strong> Renewal Missi<strong>on</strong> (JNNURM) is be<strong>in</strong>g<br />
implemented <strong>in</strong> 63 cities across <strong>the</strong> country,<br />
address<strong>in</strong>g <strong>the</strong> problems <strong>of</strong> <strong>in</strong>frastructure and<br />
basic services <strong>in</strong> a holistic manner by plann<strong>in</strong>g for<br />
poor and n<strong>on</strong>-poor residents, over a seven-year<br />
period from 2005 to 2012. Under <strong>the</strong> aegis <strong>of</strong> <strong>the</strong><br />
M<strong>in</strong>istry <strong>of</strong> <strong>Urban</strong> Development and M<strong>in</strong>istry <strong>of</strong><br />
Hous<strong>in</strong>g and <strong>Urban</strong> Poverty Alleviati<strong>on</strong>, <strong>the</strong> <strong>Urban</strong><br />
Infrastructure Development Scheme for Small and<br />
Medium Towns (UIDSSMT) and <strong>the</strong> Integrated<br />
Hous<strong>in</strong>g and Slum Development Programme<br />
(IHSDP) have been launched <strong>in</strong> a number <strong>of</strong> towns.<br />
While <strong>the</strong> stated objective <strong>of</strong> <strong>the</strong>se programmes is<br />
to have <strong>in</strong>clusive urban development that would<br />
benefit all secti<strong>on</strong>s <strong>of</strong> <strong>the</strong> urban populati<strong>on</strong>, given<br />
<strong>the</strong> magnitude <strong>of</strong> <strong>the</strong> shortfall <strong>in</strong> basic amenities<br />
across <strong>the</strong> country, it is quite clear that provisi<strong>on</strong> <strong>of</strong><br />
such amenities will rema<strong>in</strong> a huge problem unless<br />
strategies are changed drastically, with far greater<br />
attenti<strong>on</strong> be<strong>in</strong>g paid to small towns.<br />
2.3 C<strong>on</strong>sumpti<strong>on</strong><br />
There is a substantial body <strong>of</strong> literature<br />
<strong>on</strong> average c<strong>on</strong>sumpti<strong>on</strong> levels <strong>in</strong> <strong>India</strong> that<br />
<strong>in</strong>dicates not <strong>on</strong>ly low levels <strong>of</strong> per capita calorie<br />
c<strong>on</strong>sumpti<strong>on</strong>, but also a trend that reflects ei<strong>the</strong>r<br />
stagnant or decl<strong>in</strong><strong>in</strong>g c<strong>on</strong>sumpti<strong>on</strong> levels over time<br />
across <strong>the</strong> various <strong>State</strong>s <strong>of</strong> <strong>India</strong> (Patnaik 2009;<br />
Ray 2007; Radhakrishna 2006; Ghosh 2003).<br />
Table 2.20 <strong>in</strong>dicates a decl<strong>in</strong>e <strong>in</strong> <strong>the</strong> average<br />
c<strong>on</strong>sumpti<strong>on</strong> <strong>of</strong> cereals, pulses, meat and sugar<br />
by an average urban c<strong>on</strong>sumer <strong>in</strong> <strong>the</strong> country as<br />
a whole <strong>in</strong> 2004-05 compared to 1993-94. On an<br />
average, an urban c<strong>on</strong>sumer <strong>in</strong> <strong>India</strong> c<strong>on</strong>sumed<br />
10.63 kg <strong>of</strong> cereals per m<strong>on</strong>th <strong>in</strong> 1993-94, which<br />
decl<strong>in</strong>ed to 9.94 kg per m<strong>on</strong>th <strong>in</strong> 2004-05. Every<br />
<strong>State</strong> has exhibited a decl<strong>in</strong>e <strong>in</strong> cereal c<strong>on</strong>sumpti<strong>on</strong><br />
over this period, irrespective <strong>of</strong> <strong>the</strong> <strong>in</strong>itial levels <strong>of</strong><br />
c<strong>on</strong>sumpti<strong>on</strong>. As regards c<strong>on</strong>sumpti<strong>on</strong> <strong>of</strong> pulses and<br />
pulse products, <strong>the</strong>re has been a drastic reducti<strong>on</strong><br />
<strong>in</strong> per capita m<strong>on</strong>thly c<strong>on</strong>sumpti<strong>on</strong> <strong>in</strong> Rajasthan,<br />
West Bengal, Madhya Pradesh and Andhra Pradesh<br />
while c<strong>on</strong>sumpti<strong>on</strong> levels have improved <strong>in</strong> Kerala,<br />
Tamil Nadu and Assam. Average c<strong>on</strong>sumpti<strong>on</strong> <strong>of</strong><br />
milk has marg<strong>in</strong>ally improved for urban c<strong>on</strong>sumers<br />
<strong>in</strong> all <strong>the</strong> <strong>State</strong>s except Rajasthan and West Bengal<br />
over this period. Rajasthan stands out <strong>in</strong> terms <strong>of</strong><br />
decl<strong>in</strong>e <strong>in</strong> m<strong>on</strong>thly per capita c<strong>on</strong>sumpti<strong>on</strong> <strong>of</strong> all<br />
major food items.<br />
Not <strong>on</strong>ly has <strong>the</strong>re been a general decl<strong>in</strong>e <strong>in</strong><br />
average c<strong>on</strong>sumpti<strong>on</strong> levels <strong>of</strong> cereals and pulses,<br />
<strong>the</strong> prevail<strong>in</strong>g level <strong>of</strong> c<strong>on</strong>sumpti<strong>on</strong> was also lower<br />
than <strong>the</strong> Recommended Dietary Allowance (RDA)<br />
prescribed by <strong>the</strong> <strong>India</strong>n Council <strong>of</strong> Medical<br />
Research 10 . Table 2.21 <strong>in</strong>dicates that with <strong>the</strong><br />
excepti<strong>on</strong> <strong>of</strong> Orissa, <strong>the</strong> average c<strong>on</strong>sumpti<strong>on</strong> levels<br />
<strong>of</strong> cereals have been lower than <strong>the</strong> required norm<br />
<strong>in</strong> all <strong>the</strong> o<strong>the</strong>r <strong>State</strong>s. In <strong>the</strong> country as a whole, per<br />
capita c<strong>on</strong>sumpti<strong>on</strong> <strong>of</strong> cereals <strong>of</strong> an average urban<br />
c<strong>on</strong>sumer accounted <strong>on</strong>ly for 84 per cent <strong>of</strong> RDA<br />
<strong>in</strong> 1993-94.This percentage fur<strong>the</strong>r decl<strong>in</strong>ed to 79<br />
per cent <strong>in</strong> 2004-05. As regards pulses, <strong>the</strong> average<br />
per capita c<strong>on</strong>sumpti<strong>on</strong> rema<strong>in</strong>ed below RDA <strong>in</strong><br />
all <strong>the</strong> <strong>State</strong>s and <strong>the</strong> situati<strong>on</strong> worsened <strong>in</strong> 7 <strong>of</strong><br />
<strong>the</strong>m over <strong>the</strong> 12 years. C<strong>on</strong>sumpti<strong>on</strong> <strong>of</strong> eggs, fish<br />
and meat was also way below <strong>the</strong> required norm<br />
<strong>in</strong> almost all <strong>the</strong> <strong>State</strong>s. However, <strong>the</strong> status with<br />
regard to milk, edible oil and sugar was far better.<br />
Radhakrishna’s analysis <strong>of</strong> <strong>the</strong> survey f<strong>in</strong>d<strong>in</strong>gs<br />
<strong>of</strong> NNMB <strong>in</strong> rural areas <strong>of</strong> seven selected <strong>State</strong>s<br />
over 1975-79, 1988-90, 1996-97 <strong>in</strong>dicated that <strong>the</strong><br />
average <strong>in</strong>take <strong>of</strong> food items by children <strong>in</strong> <strong>the</strong> age<br />
group <strong>of</strong> 1 to 3 years as well as those <strong>in</strong> <strong>the</strong> age<br />
group 4 to 6 years was below <strong>the</strong> recommended<br />
10 ‘RDA is def<strong>in</strong>ed as <strong>the</strong> nutrient present <strong>in</strong> <strong>the</strong> diet which satisfies <strong>the</strong> daily requirement <strong>of</strong> nearly all <strong>in</strong>dividuals <strong>in</strong> a populati<strong>on</strong>…..Nutrient<br />
requirement can be def<strong>in</strong>ed as <strong>the</strong> m<strong>in</strong>imum amount <strong>of</strong> <strong>the</strong> absorbed nutrient that is necessary for ma<strong>in</strong>ta<strong>in</strong><strong>in</strong>g <strong>the</strong> normal physiological<br />
functi<strong>on</strong>s <strong>of</strong> <strong>the</strong> body’(Sivakumar 2009).
Table 2.20<br />
Average M<strong>on</strong>thly Per capita C<strong>on</strong>sumpti<strong>on</strong> <strong>of</strong> Selected <strong>Food</strong> Items <strong>in</strong> <strong>Urban</strong> Areas <strong>of</strong> Major <strong>State</strong>s, 1993-94 and 2004-05<br />
Average M<strong>on</strong>thly Per capita C<strong>on</strong>sumpti<strong>on</strong> <strong>of</strong> <strong>Food</strong> Items (<strong>in</strong> Kg.)<br />
Cereals Pulses Milk Oil Eggs Fish Meat Sugar<br />
<strong>State</strong>s<br />
Sl.<br />
No.<br />
2004-<br />
05<br />
1993-<br />
94<br />
2004-<br />
05<br />
1993-<br />
94<br />
2004-<br />
05<br />
1993-<br />
94<br />
2004-<br />
05<br />
1993-<br />
94<br />
2004-<br />
05<br />
1993-<br />
94<br />
2004-<br />
05<br />
1993-<br />
94<br />
2004-<br />
05<br />
1993-<br />
94<br />
2004-<br />
05<br />
1993-<br />
94<br />
DIMENSIONS OF FOOD INSECURITY IN URBAN INDIA 43<br />
1 Andhra Pradesh 11.30 10.51 0.85 0.80 3.53 3.94 0.48 0.62 0.27 0.33 0.08 0.08 0.23 0.10 0.64 0.55<br />
2 Assam 12.05 11.92 0.72 0.77 1.49 1.80 0.54 0.65 0.31 0.35 0.54 0.68 0.24 0.09 0.65 0.60<br />
3 Bihar 12.82 12.15 0.79 0.88 3.14 3.51 0.47 0.61 0.11 0.14 0.13 0.18 0.16 0.06 0.62 0.68<br />
4 Gujarat 8.96 8.29 0.94 0.94 5.59 6.03 0.96 1.06 0.05 0.05 0.04 0.02 0.09 0.05 1.00 1.14<br />
5 Haryana 10.46 9.15 0.71 0.70 8.19 8.63 0.64 0.56 0.06 0.09 0.00 0.02 0.00 0.01 1.31 1.21<br />
6 Karnataka 10.87 9.70 0.88 0.89 3.98 4.38 0.41 0.55 0.20 0.26 0.14 0.12 0.23 0.11 0.86 0.82<br />
7 Kerala 9.46 8.83 0.48 0.64 2.94 3.29 0.30 0.47 0.31 0.34 1.62 1.95 0.24 0.01 0.91 0.89<br />
8 Madhya Pradesh 11.32 10.99 1.03 0.91 3.67 3.38 0.60 0.64 0.10 0.22 0.04 0.08 0.13 0.04 0.99 0.93<br />
9 Maharashtra 9.37 8.39 0.93 0.91 4.25 3.95 0.65 0.79 0.19 0.20 0.16 0.11 0.24 0.10 1.04 0.94<br />
10 Orissa 13.36 13.11 0.73 0.70 1.98 2.02 0.38 0.42 0.17 0.19 0.30 0.37 0.19 0.09 0.72 0.53<br />
11 Punjab 9.01 9.01 0.93 0.90 8.73 9.52 0.64 0.74 0.09 0.08 0.00 0.00 0.07 0.02 1.59 1.43<br />
12 Rajasthan 11.52 10.84 0.71 0.51 6.78 6.64 0.64 0.58 0.05 0.04 0.01 0.01 0.10 0.08 1.13 1.00<br />
13 Tamil Nadu 10.05 9.48 0.85 0.95 3.42 4.34 0.34 0.55 0.32 0.34 0.17 0.14 0.20 0.10 0.63 0.69<br />
14 Uttar Pradesh 11.08 10.95 0.94 1.00 5.07 5.24 0.56 0.61 0.08 0.16 0.02 0.04 0.26 0.06 1.02 1.08<br />
15 West Bengal 11.64 10.39 0.59 0.55 2.46 2.33 0.54 0.69 0.36 0.55 0.72 0.90 0.21 0.05 0.58 0.63<br />
<strong>India</strong> 10.63 9.94 0.86 0.82 4.40 4.60 0.56 0.66 0.19 0.22 0.20 0.21 0.20 0.07 0.90 0.87<br />
Note: One litre <strong>of</strong> milk is taken to weigh 900 grams; <strong>on</strong>e egg is taken to weigh 125 grams<br />
Source: NSSO 1996a; NSSO 1997a; NSSO 2007b
44 REPORT ON THE STATE OF FOOD INSECURITY IN URBAN INDIA<br />
Table 2.21<br />
Proporti<strong>on</strong> <strong>of</strong> Average Per capita C<strong>on</strong>sumpti<strong>on</strong> per Day to RDA for Selected <strong>Food</strong> Items <strong>in</strong> <strong>Urban</strong> Areas <strong>of</strong> Major <strong>State</strong>s,<br />
1993-94 and 2004-05<br />
Proporti<strong>on</strong> <strong>of</strong> Average Per capita C<strong>on</strong>sumpti<strong>on</strong> to RDA <strong>of</strong> <strong>Food</strong> Items (<strong>in</strong> Kg.)<br />
Cereals Pulses Milk Oil Eggs Fish Meat Sugar<br />
<strong>State</strong>s<br />
Sl.<br />
No.<br />
2004-<br />
05<br />
1993-<br />
94<br />
2004-<br />
05<br />
1993-<br />
94<br />
2004-<br />
05<br />
1993-<br />
94<br />
2004z05<br />
1993-<br />
94<br />
2004-<br />
05<br />
1993-<br />
94<br />
2004-<br />
05<br />
1993-<br />
94<br />
2004-<br />
05<br />
1993-<br />
94<br />
2004-<br />
05<br />
1993-<br />
94<br />
1 Andhra Pradesh 0.90 0.83 0.71 0.67 0.78 0.88 0.73 0.94 0.20 0.24 0.11 0.10 0.31 0.13 0.71 0.61<br />
2 Assam 0.96 0.95 0.60 0.65 0.33 0.40 0.82 0.98 0.23 0.26 0.72 0.91 0.32 0.12 0.72 0.66<br />
3 Bihar 1.02 0.96 0.66 0.73 0.70 0.78 0.71 0.20 0.08 0.10 0.17 0.23 0.21 0.09 0.69 0.75<br />
4 Gujarat 0.71 0.66 0.78 0.78 1.24 1.34 1.45 1.60 0.04 0.04 0.05 0.03 0.12 0.06 1.11 1.26<br />
5 Haryana 0.83 0.73 0.59 0.59 1.82 1.92 0.97 0.85 0.05 0.07 0.00 0.03 0.00 0.02 1.46 1.35<br />
6 Karnataka 0.86 0.77 0.73 0.74 0.88 0.97 0.62 0.84 0.15 0.20 0.19 0.16 0.31 0.14 0.96 0.91<br />
7 Kerala 0.75 0.70 0.40 0.53 0.65 0.73 0.45 0.72 0.23 0.25 2.16 2.59 0.32 0.02 1.01 0.98<br />
8 Madhya Pradesh 0.90 0.87 0.86 0.76 0.82 0.75 0.91 0.19 0.08 0.09 0.05 0.11 0.17 0.06 1.10 1.03<br />
9 Maharashtra 0.74 0.67 0.78 0.76 0.94 0.88 0.98 1.20 0.14 0.15 0.21 0.14 0.32 0.13 1.16 1.05<br />
10 Orissa 1.06 1.04 0.61 0.59 0.44 0.45 0.58 0.64 0.12 0.14 0.40 0.49 0.25 0.12 0.80 0.59<br />
11 Punjab 0.72 0.72 0.78 0.75 1.94 2.11 0.97 1.13 0.07 0.06 0.00 0.01 0.09 0.03 1.77 1.59<br />
12 Rajasthan 0.91 0.86 0.59 0.42 1.51 1.48 0.97 0.88 0.03 0.03 0.01 0.01 0.13 0.10 1.26 1.11<br />
13 Tamil Nadu 0.80 0.75 0.71 0.79 0.76 0.96 0.52 0.84 0.24 0.25 0.23 0.19 0.27 0.14 0.70 0.76<br />
14 Uttar Pradesh 0.88 0.87 0.78 0.84 1.13 1.16 0.85 0.23 0.06 0.11 0.03 0.05 0.35 0.08 1.13 1.20<br />
15 West Bengal 0.92 0.82 0.49 0.46 0.55 0.52 0.82 1.05 0.27 0.41 0.96 1.20 0.28 0.07 0.64 0.70<br />
<strong>India</strong> 0.84 0.79 0.72 0.69 0.98 1.02 0.85 1.00 0.14 0.16 0.27 0.27 0.27 0.09 1.00 0.97<br />
Note: The Recommended Dietary Allowance (RDA) <strong>of</strong> ICMR is be<strong>in</strong>g revised.<br />
Source: NSSO 1996a; NSSO 1997a; NSSO 2007b
dietary allowance, <strong>the</strong>reby lead<strong>in</strong>g to a shortfall<br />
<strong>of</strong> nutrient <strong>in</strong>take (Radhakrishna 2006). To quote<br />
from his study: ‘The average nutrient <strong>in</strong>take was<br />
substantially below <strong>the</strong> recommended level for all<br />
nutrients o<strong>the</strong>r than prote<strong>in</strong>s, especially calcium,<br />
ir<strong>on</strong>, vitam<strong>in</strong>-A, thiam<strong>in</strong>, rib<strong>of</strong>lav<strong>in</strong>, niac<strong>in</strong> and<br />
vitam<strong>in</strong> C’ (ibid). While <strong>the</strong>se f<strong>in</strong>d<strong>in</strong>gs perta<strong>in</strong> to<br />
rural areas, it is unlikely to have been very different<br />
<strong>in</strong> urban areas.<br />
C<strong>on</strong>sider<strong>in</strong>g <strong>the</strong> predom<strong>in</strong>ance <strong>of</strong> foodgra<strong>in</strong>s<br />
as a source <strong>of</strong> nutriti<strong>on</strong> for <strong>the</strong> <strong>India</strong>n populati<strong>on</strong>,<br />
calorie <strong>in</strong>take is taken as <strong>the</strong> nutriti<strong>on</strong> norm <strong>in</strong><br />
<strong>India</strong>. In 2004-05, foodgra<strong>in</strong>s – cereals and cereal<br />
substitutes and pulses and pulses products –<br />
accounted for 62.76 per cent <strong>of</strong> <strong>the</strong> total calorie<br />
Sl.<br />
No.<br />
DIMENSIONS OF FOOD INSECURITY IN URBAN INDIA 45<br />
<strong>in</strong>take and 67.2 per cent <strong>of</strong> total prote<strong>in</strong> <strong>in</strong>take<br />
<strong>of</strong> <strong>the</strong> urban c<strong>on</strong>sumer (NSSO 2007c). Average<br />
calorie c<strong>on</strong>sumpti<strong>on</strong> <strong>in</strong> <strong>India</strong>, which is largely<br />
related to c<strong>on</strong>sumpti<strong>on</strong> <strong>of</strong> foodgra<strong>in</strong>s, has been<br />
<strong>on</strong> <strong>the</strong> decl<strong>in</strong>e over <strong>the</strong> years. Average per capita<br />
calorie c<strong>on</strong>sumpti<strong>on</strong> has decl<strong>in</strong>ed from 2071 Kcal<br />
per day <strong>in</strong> 1993-94 to 2020 Kcal per day <strong>in</strong> 2004-05<br />
<strong>in</strong> urban <strong>India</strong> as a whole. Analys<strong>in</strong>g <strong>the</strong> changes<br />
<strong>in</strong> calorie c<strong>on</strong>sumpti<strong>on</strong> levels across different<br />
expenditure classes, it is seen that Maharashtra,<br />
Madhya Pradesh, West Bengal and Rajasthan have<br />
shown a decl<strong>in</strong>e <strong>in</strong> per capita calorie c<strong>on</strong>sumpti<strong>on</strong><br />
level <strong>of</strong> <strong>the</strong> lowest 30 per cent expenditure classes<br />
as well as <strong>the</strong> overall urban populati<strong>on</strong> (all classes)<br />
<strong>in</strong> 2004-05 compared to 1993-94 (Table 2.22).<br />
Table 2.22<br />
Average Per Capita Calorie C<strong>on</strong>sumpti<strong>on</strong> across Different Expenditure Classes <strong>in</strong><br />
<strong>Urban</strong> Areas <strong>of</strong> Major <strong>State</strong>s, 1993-94 and 2004-05<br />
<strong>State</strong>s<br />
Bottom 30% <strong>of</strong><br />
Expenditure Classes<br />
Average per capita calorie c<strong>on</strong>sumpti<strong>on</strong> (Kcal/day)<br />
Middle 40% <strong>of</strong><br />
Expenditure Classes<br />
Top 30% <strong>of</strong><br />
Expenditure Classes<br />
All Classes<br />
1993-94 2004-05 1993-94 2004-05 1993-94 2004-05 1993-94 2004-05<br />
1 Andhra Pradesh 1603 1618 2025 2003 2497 2461 1992 2000<br />
2 Assam 1674 1744 2031 2055 2519 2578 2108 2413<br />
3 Bihar 1858 1850 2314 2383 2862 3208 2188 2372<br />
4 Gujarat 1501 1537 2038 1942 2517 2393 2027 1991<br />
5 Haryana 1584 1558 2061 1930 2556 2465 2140 2033<br />
6 Karnataka 1566 1583 2043 1904 2518 2352 2026 1944<br />
7 Kerala 1361 1382 1874 1863 2477 2474 1966 1996<br />
8 Madhya Pradesh 1718 1610 2116 2013 2586 2374 2082 2011<br />
9 Maharashtra 1570 1535 1869 1787 2332 2137 1989 1847<br />
10 Orissa 1861 1853 2283 2236 2839 2701 2261 2139<br />
11 Punjab 1522 1633 1931 2013 2450 2535 2089 2150<br />
12 Rajasthan 1741 1707 2195 2128 2588 2740 2184 2116<br />
13 Tamil Nadu 1440 1550 1923 1857 2520 2334 1922 1935<br />
14 Uttar Pradesh 1747 1829 2123 2181 2691 2628 2114 2169<br />
15 West Bengal 1701 1681 2100 1978 2516 2319 2131 2011<br />
<strong>India</strong> 1636 1678 2033 1984 2537 2412 2071 2020<br />
Note: Top 30% for Haryana is an estimated value for 1993-94<br />
Source: NSSO 1996b; NSSO 2007c
46 REPORT ON THE STATE OF FOOD INSECURITY IN URBAN INDIA<br />
On <strong>the</strong> o<strong>the</strong>r hand, Tamil Nadu, Karnataka,<br />
Andhra Pradesh, Kerala, Uttar Pradesh and Gujarat<br />
have shown an <strong>in</strong>crease <strong>in</strong> per capita calorie<br />
c<strong>on</strong>sumpti<strong>on</strong> <strong>of</strong> <strong>the</strong> bottom expenditure classes.<br />
From Tables 4.2 and 4.4 <strong>in</strong> Chapter 4, it is clear<br />
that <strong>the</strong> <strong>State</strong>s that registered an <strong>in</strong>crease <strong>in</strong> calorie<br />
c<strong>on</strong>sumpti<strong>on</strong> by <strong>the</strong> lower expenditure classes<br />
were also those where PDS has had a significant<br />
reach. Assam and Punjab are <strong>the</strong> <strong>on</strong>ly two <strong>State</strong>s<br />
that exhibited an <strong>in</strong>crease <strong>in</strong> calorie c<strong>on</strong>sumpti<strong>on</strong><br />
levels across all <strong>the</strong> three expenditure classes<br />
c<strong>on</strong>sidered. In sum, <strong>the</strong> levels as well as changes<br />
<strong>in</strong> calorie c<strong>on</strong>sumpti<strong>on</strong> <strong>in</strong> urban <strong>India</strong>, to say <strong>the</strong><br />
least, have been worrisome. Per capita calorie<br />
c<strong>on</strong>sumpti<strong>on</strong> levels do not take <strong>in</strong>to account <strong>the</strong><br />
variati<strong>on</strong>s <strong>in</strong> calorific requirements accord<strong>in</strong>g to<br />
age and gender. Incorporat<strong>in</strong>g a c<strong>on</strong>versi<strong>on</strong> factor<br />
for age and gender, NSSO has estimated <strong>the</strong> calorie<br />
c<strong>on</strong>sumpti<strong>on</strong> level for c<strong>on</strong>sumer units <strong>in</strong> urban<br />
areas across <strong>the</strong> <strong>State</strong>s. The pattern <strong>of</strong> change <strong>in</strong><br />
c<strong>on</strong>sumpti<strong>on</strong> levels for c<strong>on</strong>sumer units is similar<br />
to what was observed for per capita (Table 2.23).<br />
C<strong>on</strong>sider<strong>in</strong>g <strong>the</strong> general decl<strong>in</strong>e <strong>in</strong><br />
c<strong>on</strong>sumpti<strong>on</strong> levels <strong>in</strong> urban areas, urban poverty<br />
measured as <strong>the</strong> percentage <strong>of</strong> people not able to<br />
spend enough <strong>on</strong> food to reach a daily <strong>in</strong>take <strong>of</strong><br />
2100 calories rose from 57 per cent <strong>in</strong> 1993-94 to<br />
64.5 per cent <strong>in</strong> 2004-05 (Patnaik 2008). Patnaik’s<br />
analysis for selected <strong>State</strong>s shows a massive rise<br />
<strong>in</strong> urban poverty – measured directly through <strong>the</strong><br />
observed level <strong>of</strong> calorie <strong>in</strong>take – from 52.5 per<br />
cent to 85 per cent <strong>in</strong> Maharashtra, from 49 per<br />
cent to 68.5 per cent <strong>in</strong> West Bengal and from 35<br />
per cent to 57 per cent <strong>in</strong> Delhi over <strong>the</strong> period<br />
1993-94 to 2004-05 (ibid).<br />
The significance <strong>of</strong> street foods for daily<br />
wage labourers <strong>in</strong> <strong>the</strong> urban c<strong>on</strong>text is illustrated <strong>in</strong><br />
Box 1.<br />
11 <strong>State</strong>-level variati<strong>on</strong>s <strong>in</strong> nutriti<strong>on</strong> <strong>in</strong>dicators are discussed <strong>in</strong> Chapter 3<br />
2.4 Nutriti<strong>on</strong>al Outcome<br />
Some <strong>of</strong> <strong>the</strong> crucial determ<strong>in</strong>ants <strong>of</strong> nutriti<strong>on</strong>al<br />
outcomes <strong>of</strong> a populati<strong>on</strong> <strong>in</strong>clude level and type<br />
<strong>of</strong> <strong>the</strong> c<strong>on</strong>sumpti<strong>on</strong> basket used, availability and<br />
access to safe dr<strong>in</strong>k<strong>in</strong>g water, and health care and<br />
envir<strong>on</strong>mental hygiene. From <strong>the</strong> discussi<strong>on</strong> so<br />
far, it is clear that <strong>the</strong> attributes that have a bear<strong>in</strong>g<br />
<strong>on</strong> nutriti<strong>on</strong> have c<strong>on</strong>t<strong>in</strong>ued to perform very poorly<br />
s<strong>in</strong>ce <strong>the</strong> 1990s <strong>in</strong> urban <strong>India</strong>: <strong>the</strong> c<strong>on</strong>sumpti<strong>on</strong><br />
levels have decl<strong>in</strong>ed from an already low level; <strong>the</strong><br />
magnitudes <strong>of</strong> shortfall with respect to access to<br />
safe dr<strong>in</strong>k<strong>in</strong>g water and toilets have also rema<strong>in</strong>ed<br />
huge. Given this, <strong>the</strong> levels <strong>of</strong> malnutriti<strong>on</strong> are<br />
bound to be high for <strong>the</strong> urban populati<strong>on</strong>. The<br />
extent <strong>of</strong> child under-nutriti<strong>on</strong> rema<strong>in</strong>ed quite<br />
high <strong>in</strong> urban <strong>India</strong> with 30.1 per cent <strong>of</strong> children<br />
(6-35 m<strong>on</strong>ths) estimated to be underweight <strong>in</strong><br />
2005-06, as per NFHS 11 . Undernutriti<strong>on</strong> am<strong>on</strong>g<br />
women, <strong>in</strong>dicated by chr<strong>on</strong>ic energy deficiency,<br />
has <strong>in</strong>creased to 25 per cent <strong>in</strong> 2005-06 compared<br />
to 22.6 per cent <strong>in</strong> 1998-99 <strong>in</strong> urban <strong>India</strong>. About<br />
half <strong>the</strong> women <strong>in</strong> urban areas were estimated<br />
to be anaemic <strong>in</strong> 2005-06. A comb<strong>in</strong>ati<strong>on</strong> <strong>of</strong><br />
high extent <strong>of</strong> undernutriti<strong>on</strong>, <strong>in</strong>adequate dietary<br />
<strong>in</strong>take, <strong>in</strong>sufficient access to basic amenities and<br />
<strong>in</strong>festati<strong>on</strong> <strong>of</strong> diseases lead to high mortality and<br />
morbidity am<strong>on</strong>g <strong>the</strong> urban populati<strong>on</strong>. Infant and<br />
child mortality rates are usually taken to reflect <strong>the</strong><br />
quality <strong>of</strong> life and socioec<strong>on</strong>omic development <strong>in</strong><br />
an area. While <strong>in</strong>fant mortality rates (IMR) and<br />
child mortality rates (CMR) have been lower <strong>in</strong><br />
urban <strong>India</strong> compared to rural <strong>India</strong>, by no means<br />
have <strong>the</strong>y been at acceptable levels. Table 2.24<br />
shows that <strong>in</strong>fant mortality <strong>in</strong> urban <strong>India</strong> was<br />
41 deaths (at age 0-11 m<strong>on</strong>ths) per 1000 live<br />
births while child mortality was 10 deaths (at age<br />
1-4 years) per 1000 children reach<strong>in</strong>g age <strong>on</strong>e.<br />
Rajasthan, Madhya Pradesh, Uttar Pradesh, Bihar<br />
and Assam fared poorly with regard to <strong>in</strong>fant and
DIMENSIONS OF FOOD INSECURITY IN URBAN INDIA 47<br />
Box 1 Koozh <strong>in</strong> Chennai<br />
Koozh is <strong>the</strong> Tamil name for a porridge made from broken rice and <strong>the</strong> flour <strong>of</strong> F<strong>in</strong>ger Millet<br />
(Eleus<strong>in</strong>e coracana) — Kelvaragu <strong>in</strong> Tamil — or Pearl Millet (Pennisetum typhoides) — Cumbu<br />
<strong>in</strong> Tamil. It is comm<strong>on</strong>ly sold by street vendors <strong>in</strong> Tamil Nadu, and c<strong>on</strong>sumed as breakfast or<br />
lunch food. A semi-solid fermented dish, koozh is th<strong>in</strong>ned for c<strong>on</strong>sumpti<strong>on</strong> by add<strong>in</strong>g water, salt,<br />
<strong>on</strong>i<strong>on</strong>, buttermilk, curry leaves and coriander leaves and served with side dishes <strong>in</strong>clud<strong>in</strong>g green<br />
chillies, raw <strong>on</strong>i<strong>on</strong>, pickles and mango spiced with red chillies and pepper and sometimes with<br />
karuvattu kuzhambu (dry fish curry) (htpp://en.wikipedia.org/wiki/koozh). Koozh is a popular<br />
dish <strong>in</strong> rural Tamil Nadu mostly am<strong>on</strong>g poor households.<br />
A brief study <strong>of</strong> Koozh <strong>in</strong> Chennai was undertaken us<strong>in</strong>g a questi<strong>on</strong>naire <strong>in</strong> September 2009<br />
cover<strong>in</strong>g 35 Koozh stalls spread across <strong>the</strong> city. In additi<strong>on</strong>, 44 c<strong>on</strong>sumers were also <strong>in</strong>terviewed.<br />
The salient results that have a bear<strong>in</strong>g <strong>on</strong> food security are summarised below:<br />
The price <strong>of</strong> half a litre <strong>of</strong> Koozh varied between Rs.6 and 8 at <strong>the</strong> time <strong>of</strong> <strong>the</strong> survey,<br />
depend<strong>in</strong>g <strong>on</strong> <strong>the</strong> locati<strong>on</strong>, with <strong>the</strong> price be<strong>in</strong>g lower <strong>in</strong> <strong>the</strong> outskirts <strong>of</strong> <strong>the</strong> city.<br />
52 per cent <strong>of</strong> those c<strong>on</strong>sumers <strong>in</strong>terviewed bel<strong>on</strong>ged to <strong>the</strong> age group 26-40, and 27 per<br />
cent bel<strong>on</strong>ged to <strong>the</strong> age group 41-55 years. This <strong>in</strong>dicated that <strong>the</strong> dish was popular am<strong>on</strong>g <strong>the</strong><br />
present younger generati<strong>on</strong>.<br />
93 per cent <strong>of</strong> <strong>the</strong> c<strong>on</strong>sumers <strong>in</strong>terviewed were daily labourers suggest<strong>in</strong>g that Koozh<br />
stalls serve a useful functi<strong>on</strong> for urban workers. Most <strong>of</strong> <strong>the</strong> c<strong>on</strong>sumers <strong>of</strong> Koozh were workers,<br />
notably truck drivers, haulers and coolies <strong>in</strong>volved <strong>in</strong> load<strong>in</strong>g and unload<strong>in</strong>g goods, auto drivers,<br />
labourers <strong>in</strong>volved <strong>in</strong> c<strong>on</strong>structi<strong>on</strong> work, all c<strong>on</strong>tribut<strong>in</strong>g to important services <strong>in</strong> urban locati<strong>on</strong>s.<br />
There were stray cases <strong>of</strong> IT employees c<strong>on</strong>sum<strong>in</strong>g Koozh, claim<strong>in</strong>g that it was good for <strong>the</strong>ir<br />
health. Accord<strong>in</strong>g to <strong>the</strong> Koozh sellers, many well-to-do and rich people also bought Koozh for<br />
co<strong>on</strong>sumpti<strong>on</strong>.<br />
The popularity <strong>of</strong> Koozh am<strong>on</strong>g urban workers suggests that neglected and underutilised<br />
cereals such as nutritious millets can be very useful <strong>in</strong> achiev<strong>in</strong>g nutriti<strong>on</strong>al security <strong>of</strong> <strong>the</strong> urban<br />
poor. As with o<strong>the</strong>r street foods, a code for good food-handl<strong>in</strong>g practices for Koozh may be<br />
developed and dissem<strong>in</strong>ated am<strong>on</strong>g <strong>the</strong> vendors, c<strong>on</strong>sider<strong>in</strong>g that educat<strong>in</strong>g <strong>the</strong>m <strong>on</strong> food safety<br />
is an urgent task. Clean water for dr<strong>in</strong>k<strong>in</strong>g and wash<strong>in</strong>g is ano<strong>the</strong>r important area <strong>of</strong> c<strong>on</strong>cern.<br />
Provisi<strong>on</strong> <strong>of</strong> clean paper cups or ear<strong>the</strong>n cups/vessels can reduce c<strong>on</strong>tam<strong>in</strong>ati<strong>on</strong>.<br />
Koozh sellers are excellent entry po<strong>in</strong>ts for br<strong>in</strong>g<strong>in</strong>g neglected and underutilised species<br />
like nutritious millets <strong>in</strong>to <strong>the</strong> urban food basket.<br />
Source: V. Arivudai Nambi, Maria Phillip and K. Muniyappan. Koozh <strong>in</strong> Chennai. October 2009.<br />
Chennai: MSSRF
48 REPORT ON THE STATE OF FOOD INSECURITY IN URBAN INDIA<br />
Table 2.23<br />
Average Calorie C<strong>on</strong>sumpti<strong>on</strong> Per C<strong>on</strong>sumer Unit across Different Expenditure Classes <strong>in</strong> <strong>Urban</strong> Areas <strong>of</strong> Major <strong>State</strong>s,<br />
1993-94 and 2004-05<br />
Average calorie c<strong>on</strong>sumpti<strong>on</strong> per c<strong>on</strong>sumer unit (Kcal/day)<br />
All Classes<br />
Top 30% <strong>of</strong><br />
Expenditure Classes<br />
Middle 40% <strong>of</strong><br />
Expenditure Classes<br />
Bottom 30% <strong>of</strong><br />
Expenditure Classes<br />
<strong>State</strong>s<br />
Sl.<br />
No.<br />
1993-94 2004-05 1993-94 2004-05 1993-94 2004-05 1993-94 2004-05<br />
1 Andhra Pradesh 2001 1995 2485 2441 3040 3010 2455 2449<br />
2 Assam 2051 2120 2450 2485 3008 3109 2543 2593<br />
3 Bihar 2301 2271 2798 2942 3393 3837 2667 2907<br />
4 Gujarat 1876 1901 2429 2339 3009 2799 2491 2436<br />
5 Haryana 1978 1935 2555 2356 3035 3002 2616 2487<br />
6 Karnataka 1943 1958 2494 2331 3061 2868 2485 2385<br />
7 Kerala 1708 1784 2447 2559 3166 3133 2445 2534<br />
8 Madhya Pradesh 2139 2122 2593 2559 3113 2956 2556 2463<br />
9 Maharashtra 1952 1906 2280 2172 2830 2612 2432 2261<br />
10 Orissa 2302 2256 2790 2696 3332 3234 2754 2596<br />
11 Punjab 1938 2011 2381 2438 2967 3078 2569 2614<br />
12 Rajasthan 2202 2120 2714 2583 3146 3306 2704 2586<br />
13 Tamil Nadu 1788 1923 2369 2287 3061 2897 2366 2394<br />
14 Uttar Pradesh 2204 2230 2617 2654 3279 3243 2615 2641<br />
15 West Bengal 2091 2073 2541 2401 3034 2866 2587 2467<br />
<strong>India</strong> 2040 2077 2491 2418 3070 2945 2542 2475<br />
Note: Top 30% for Haryana is an estimated value for 1993-94<br />
Source: NSSO 1996b; NSSO 2007c
child mortality rates while Kerala and Tamil Nadu<br />
were substantially better.<br />
Table 2.25 provides data <strong>on</strong> <strong>in</strong>fant mortality<br />
and nutriti<strong>on</strong>al <strong>in</strong>dicators for slum and n<strong>on</strong>slum<br />
populati<strong>on</strong> for eight metropolitan cities <strong>in</strong><br />
2005-06. The nutriti<strong>on</strong>al status <strong>of</strong> <strong>the</strong> populati<strong>on</strong><br />
varied <strong>in</strong> an expected fashi<strong>on</strong> across slum and<br />
n<strong>on</strong>-slum populati<strong>on</strong>s. The percentages <strong>of</strong> children<br />
who were stunted or wasted or underweight for<br />
age or anaemic were much higher am<strong>on</strong>g slum<br />
populati<strong>on</strong>s than n<strong>on</strong>-slum populati<strong>on</strong>s <strong>in</strong> all<br />
<strong>the</strong> cities except for <strong>the</strong> percentage <strong>of</strong> children<br />
underweight for age <strong>in</strong> Meerut. Similarly, <strong>the</strong><br />
DIMENSIONS OF FOOD INSECURITY IN URBAN INDIA 49<br />
<strong>in</strong>cidence <strong>of</strong> chr<strong>on</strong>ic energy deficiency am<strong>on</strong>g<br />
women was higher <strong>in</strong> slums than n<strong>on</strong>-slums.<br />
With regard to <strong>in</strong>cidence <strong>of</strong> anaemia, however,<br />
<strong>the</strong>re was no clear pattern. Women liv<strong>in</strong>g <strong>in</strong> n<strong>on</strong>slum<br />
areas appeared to be as pr<strong>on</strong>e to anaemia as<br />
women from slum areas. Infant mortality rates were<br />
higher <strong>in</strong> slums compared to n<strong>on</strong>-slum areas <strong>in</strong> all<br />
<strong>the</strong> cities except Mumbai and Kolkata 12 . Prevalence<br />
<strong>of</strong> very high levels <strong>of</strong> malnutriti<strong>on</strong> am<strong>on</strong>g children<br />
<strong>in</strong> <strong>the</strong> country has <strong>in</strong>dicated that a sizeable<br />
secti<strong>on</strong> <strong>of</strong> <strong>the</strong>m would not have reached <strong>the</strong>ir<br />
physical or mental potential. There is thus an urgent<br />
need to address this issue <strong>on</strong> a priority basis.<br />
Table 2.24<br />
Infant Mortality and Child Mortality Rates <strong>in</strong> <strong>Urban</strong> <strong>India</strong>, 2005-06<br />
Sl.<br />
No.<br />
<strong>State</strong>s IMR CMR<br />
1 Andhra Pradesh 47.70 8.00<br />
2 Assam 50.60 17.60<br />
3 Bihar 52.32 19.96<br />
4 Gujarat 44.60 9.90<br />
5 Haryana 30.20 11.50<br />
6 Karnataka 40.00 6.20<br />
7 Kerala 11.60 2.20<br />
8 Madhya Pradesh 59.66 14.57<br />
9 Maharashtra 28.40 8.80<br />
10 Orissa 40.90 19.20<br />
11 Punjab 42.60 9.20<br />
12 Rajasthan 65.10 12.00<br />
13 Tamil Nadu 31.00 3.80<br />
14 Uttar Pradesh 53.47 19.66<br />
15 West Bengal 46.40 6.80<br />
<strong>India</strong> 41.50 10.60<br />
Note:<br />
1. NFHS def<strong>in</strong>es IMR as number <strong>of</strong> deaths at age 0 to 11 m<strong>on</strong>ths per 1000 live births;<br />
2. CMR as number <strong>of</strong> deaths at age 1 to 4 years per 1000 children reach<strong>in</strong>g age <strong>on</strong>e<br />
Source: NFHS 2007<br />
12 It is important to note that data <strong>on</strong> IMR would be more reliable from Sample Registrati<strong>on</strong> System (SRS) than from <strong>the</strong> source used here,<br />
namely, NFHS. However, c<strong>on</strong>sider<strong>in</strong>g that SRS provides <strong>on</strong>ly <strong>State</strong> level estimates, NFHS data has been used.
50 REPORT ON THE STATE OF FOOD INSECURITY IN URBAN INDIA<br />
Table 2.25<br />
Some Salient Features <strong>of</strong> Slum and N<strong>on</strong>-Slum Populati<strong>on</strong>s, 2005-06<br />
Percentage <strong>of</strong> children (6 -59 m<strong>on</strong>ths) who are Percentage <strong>of</strong> women<br />
IMR<br />
Classificati<strong>on</strong><br />
<strong>of</strong><br />
Area<br />
City<br />
With CED With any<br />
anaemia<br />
Stunted Wasted Underweight With any<br />
anaemia<br />
Slum 27.6 22.8 31.6 72.2 18.4 50.5 38.0<br />
N<strong>on</strong> slum 24.8 17.6 20.6 59.9 15.0 51.4 24.2<br />
Slum 47.4 16.1 36.1 50.2 23.1 46.0 24.9<br />
N<strong>on</strong> slum 41.5 16.4 25.8 46.9 21.4 47.9 40.1<br />
Slum 47.5 18.1 41.7 71.1 35.5 48.7 48.4<br />
N<strong>on</strong> slum 26.5 15.5 28.4 58.4 27.6 51.8 39.2<br />
Slum 32.4 11.1 26.0 59.0 20.9 54.6 37.9<br />
N<strong>on</strong> slum 32.0 9.1 18.4 53.1 20.8 48.9 36.4<br />
Slum 46.2 9.4 26.3 68.8 22.0 40.1 71.2<br />
N<strong>on</strong> slum 41.6 9.5 30.3 66.7 18.9 48.4 55.0<br />
Slum 32.6 16.8 26.8 54.7 20.8 52.3 33.4<br />
N<strong>on</strong> slum 23.1 14.0 15.6 55.3 13.5 56.8 47.0<br />
Slum 50.9 14.5 35.3 71.4 21.2 47.8 54.1<br />
N<strong>on</strong> slum 37.9 15.6 23.9 51.6 12.8 43.5 36.1<br />
Slum 39.6 34.0 49.6 59.8 33.0 42.9 56.4<br />
N<strong>on</strong> slum 30.6 27.6 36.7 53.4 23.0 39.8 38.4<br />
Chennai<br />
Mumbai<br />
Nagpur<br />
Hyderabad<br />
Meerut<br />
Kolkata<br />
Delhi<br />
Indore<br />
Note:<br />
1. NFHS uses three <strong>in</strong>ternati<strong>on</strong>ally recognized standards to assess children’s nutriti<strong>on</strong>al status - weight-for-age, height-for-age, and weight-for-height<br />
2. Children who are more than two standard deviati<strong>on</strong>s below <strong>the</strong> median <strong>of</strong> an <strong>in</strong>ternati<strong>on</strong>al reference populati<strong>on</strong> are c<strong>on</strong>sidered underweight (measured <strong>in</strong> terms <strong>of</strong><br />
weight-for-age), stunted (height-for-age), or wasted (weight-for-height)<br />
Source: NFHS 2007
To sum up, despite rapid ec<strong>on</strong>omic growth<br />
s<strong>in</strong>ce <strong>the</strong> early 1980s, and especially s<strong>in</strong>ce <strong>the</strong><br />
1990s, <strong>the</strong> access and absorpti<strong>on</strong> <strong>in</strong>dicators<br />
<strong>of</strong> urban food <strong>in</strong>security tell a dismal story<br />
<strong>of</strong> relatively little improvement <strong>in</strong> nutriti<strong>on</strong>al<br />
<strong>in</strong>take and worsen<strong>in</strong>g <strong>in</strong> terms <strong>of</strong> livelihood<br />
<strong>in</strong>security. Given <strong>the</strong> limitati<strong>on</strong>s <strong>of</strong> <strong>of</strong>ficial sources<br />
<strong>of</strong> <strong>in</strong>formati<strong>on</strong> <strong>in</strong> represent<strong>in</strong>g ground realities<br />
<strong>in</strong> such matters as access to safe dr<strong>in</strong>k<strong>in</strong>g water<br />
DIMENSIONS OF FOOD INSECURITY IN URBAN INDIA 51<br />
and toilets, <strong>the</strong> state <strong>of</strong> urban food <strong>in</strong>security may<br />
even be worse than that suggested by <strong>the</strong> data.<br />
What this chapter has also brought out is that<br />
smaller towns are significantly worse <strong>of</strong>f than<br />
large cities and metropolitan areas. It is also<br />
important to note that <strong>the</strong> situati<strong>on</strong> <strong>in</strong> slums,<br />
especially illegal squatter settlements and n<strong>on</strong>notified<br />
slums <strong>in</strong> large cities, is likely to be very<br />
poor 13 .<br />
13 The issue <strong>of</strong> food and nutriti<strong>on</strong> security <strong>in</strong> slums, while clearly very important for policy, has not been dealt with <strong>in</strong> this <str<strong>on</strong>g>Report</str<strong>on</strong>g> as<br />
comprehensively as we would have liked. The ma<strong>in</strong> problem has been paucity <strong>of</strong> data. We have used <strong>the</strong> data available for slums <strong>in</strong> respect<br />
<strong>of</strong> eight metropolitan cities <strong>in</strong> <strong>the</strong> text. It needs to be emphasised, however, that issues <strong>of</strong> legality and n<strong>on</strong>-recogniti<strong>on</strong> or n<strong>on</strong>-notificati<strong>on</strong><br />
are crucial <strong>in</strong> determ<strong>in</strong><strong>in</strong>g <strong>the</strong> access <strong>of</strong> urban slum areas to basic amenities that impact greatly <strong>on</strong> food and nutriti<strong>on</strong> security, especially<br />
<strong>in</strong> terms <strong>of</strong> absorpti<strong>on</strong>.
CHAPTER 3<br />
<strong>Urban</strong> <strong>Food</strong> <strong>Insecurity</strong> Across <strong>State</strong>s<br />
3.1 Introducti<strong>on</strong><br />
This chapter is devoted, <strong>in</strong> part, to an updat<strong>in</strong>g<br />
<strong>of</strong> <strong>the</strong> exercise undertaken <strong>in</strong> <strong>the</strong> <strong>Food</strong> <strong>Insecurity</strong><br />
Atlas <strong>of</strong> <strong>Urban</strong> <strong>India</strong> (FIAUI) (MSSRF-WFP 2002)<br />
to develop an <strong>in</strong>dex <strong>of</strong> urban food and nutriti<strong>on</strong><br />
<strong>in</strong>security, for <strong>India</strong> and major <strong>State</strong>s. The focus<br />
<strong>in</strong> this <str<strong>on</strong>g>Report</str<strong>on</strong>g> is <strong>on</strong> chr<strong>on</strong>ic food <strong>in</strong>security. Issues<br />
such as susta<strong>in</strong>ability and hidden hunger as well as<br />
transitory food <strong>in</strong>security caused, for <strong>in</strong>stance, by<br />
catastrophic events are not dealt with. Fur<strong>the</strong>r, <strong>the</strong><br />
ma<strong>in</strong> c<strong>on</strong>cern <strong>of</strong> this <str<strong>on</strong>g>Report</str<strong>on</strong>g> is with describ<strong>in</strong>g and<br />
analys<strong>in</strong>g <strong>the</strong> current state <strong>of</strong> food and nutriti<strong>on</strong><br />
<strong>in</strong>security <strong>in</strong> urban <strong>India</strong>. Mapp<strong>in</strong>g <strong>the</strong> relative<br />
positi<strong>on</strong> <strong>of</strong> <strong>the</strong> <strong>State</strong>s <strong>on</strong> a food <strong>in</strong>security scale <strong>on</strong><br />
<strong>the</strong> basis <strong>of</strong> a select set <strong>of</strong> <strong>in</strong>dicators is part <strong>of</strong> this<br />
larger exercise.<br />
There are two o<strong>the</strong>r respects <strong>in</strong> which<br />
<strong>the</strong> current exercise differs from <strong>the</strong> earlier <strong>on</strong>e<br />
presented <strong>in</strong> FIAUI. The first relates to data. New<br />
data has become available s<strong>in</strong>ce <strong>the</strong> previous<br />
exercise. FIAUI had made use, for <strong>the</strong> most part,<br />
<strong>of</strong> data from <strong>the</strong> 50 th and 55 th rounds <strong>of</strong> <strong>the</strong> NSSO<br />
perta<strong>in</strong><strong>in</strong>g to reference years 1993-94 and 1999-<br />
2000 respectively, <strong>the</strong> Nati<strong>on</strong>al Family Health<br />
Survey <strong>of</strong> 1992-93 (NFHS 1) and <strong>the</strong> Census <strong>of</strong><br />
<strong>India</strong> (1991 and 2001). S<strong>in</strong>ce <strong>the</strong>n, data from <strong>the</strong><br />
55 th and 61 st “full sample” rounds <strong>of</strong> <strong>the</strong> NSSO as<br />
well as data from two fur<strong>the</strong>r rounds <strong>of</strong> <strong>the</strong> NFHS<br />
– NFHS 2 (reference year 1998-99) and NFHS 3<br />
(reference year 2005-06) – as well as more data<br />
from Census 2001 have become available. The<br />
current exercise utilises data from <strong>the</strong>se sources<br />
and attempts to draw a comparative picture<br />
between two po<strong>in</strong>ts <strong>of</strong> time.<br />
The sec<strong>on</strong>d departure from <strong>the</strong> previous<br />
exercise is <strong>in</strong> respect <strong>of</strong> <strong>the</strong> choice <strong>of</strong> <strong>in</strong>dicators that<br />
would go <strong>in</strong>to <strong>the</strong> <strong>in</strong>dex to be c<strong>on</strong>structed. In <strong>the</strong><br />
exercise presented <strong>in</strong> FIAUI, a total <strong>of</strong> 17 variables<br />
were identified as <strong>in</strong>dicators hav<strong>in</strong>g relevance<br />
to a comparis<strong>on</strong> <strong>of</strong> <strong>the</strong> urban food <strong>in</strong>security<br />
situati<strong>on</strong> across <strong>the</strong> <strong>India</strong>n <strong>State</strong>s. These were<br />
<strong>the</strong>n comb<strong>in</strong>ed <strong>in</strong> dist<strong>in</strong>ct clusters as affordability<br />
<strong>in</strong>dex, access <strong>in</strong>dex, discrim<strong>in</strong>ati<strong>on</strong> <strong>in</strong>dex, hous<strong>in</strong>g<br />
<strong>in</strong>dex, sanitati<strong>on</strong> and health <strong>in</strong>dex and nutriti<strong>on</strong>al<br />
outcome <strong>in</strong>dex. Individual chapters discussed <strong>the</strong><br />
positi<strong>on</strong> <strong>of</strong> <strong>the</strong>se six <strong>in</strong>dexes across <strong>the</strong> <strong>State</strong>s and,<br />
with<strong>in</strong> <strong>the</strong> discussi<strong>on</strong> <strong>of</strong> each (clustered) <strong>in</strong>dex,<br />
<strong>the</strong> positi<strong>on</strong> <strong>in</strong> respect <strong>of</strong> each <strong>of</strong> <strong>the</strong> <strong>in</strong>dicators<br />
c<strong>on</strong>stitut<strong>in</strong>g <strong>the</strong> (clustered) <strong>in</strong>dex. All <strong>the</strong> 17<br />
<strong>in</strong>dicators were utilised to create an overall <strong>in</strong>dex<br />
<strong>of</strong> food <strong>in</strong>security. This was d<strong>on</strong>e by add<strong>in</strong>g, for<br />
each <strong>State</strong>, its rank <strong>on</strong> each <strong>of</strong> <strong>the</strong> 17 <strong>in</strong>dicators, and<br />
tak<strong>in</strong>g <strong>the</strong> average to give it a so-called mapp<strong>in</strong>g<br />
<strong>in</strong>dex. The f<strong>in</strong>al ranks <strong>of</strong> <strong>the</strong> <strong>State</strong>s <strong>in</strong> terms <strong>of</strong><br />
food <strong>in</strong>security were <strong>the</strong>n based <strong>on</strong> <strong>the</strong> value <strong>of</strong><br />
<strong>the</strong>ir respective mapp<strong>in</strong>g <strong>in</strong>dex. A similar exercise,<br />
but with different sets <strong>of</strong> <strong>in</strong>dicators appropriate to<br />
a comparis<strong>on</strong> <strong>of</strong> urban units <strong>of</strong> different populati<strong>on</strong><br />
size classes, was carried out <strong>in</strong> <strong>the</strong> sec<strong>on</strong>d part <strong>of</strong><br />
<strong>the</strong> FIAUI exercise.
54 REPORT ON THE STATE OF FOOD INSECURITY IN URBAN INDIA<br />
The current exercise focuses more <strong>on</strong> outcome<br />
<strong>in</strong>dicators ra<strong>the</strong>r than <strong>on</strong> <strong>in</strong>put variables 14 . A smaller<br />
number <strong>of</strong> 11 <strong>in</strong>dicators have been identified for<br />
comparis<strong>on</strong> <strong>of</strong> performance across <strong>the</strong> <strong>State</strong>s, with<br />
some <strong>of</strong> <strong>the</strong>m be<strong>in</strong>g mutually alternate <strong>in</strong>dicators. In<br />
c<strong>on</strong>struct<strong>in</strong>g <strong>the</strong> f<strong>in</strong>al <strong>in</strong>dex, several variants were<br />
tried out. In all <strong>the</strong> variants, ei<strong>the</strong>r 6 or 7 <strong>in</strong>dicators<br />
have been comb<strong>in</strong>ed to yield <strong>the</strong> composite <strong>in</strong>dex.<br />
The f<strong>in</strong>al choice was made after due reas<strong>on</strong><strong>in</strong>g and<br />
try<strong>in</strong>g out different permutati<strong>on</strong>s and comb<strong>in</strong>ati<strong>on</strong>s<br />
with a larger basket <strong>of</strong> <strong>in</strong>dicators. The picture that<br />
emerged with <strong>the</strong> larger basket <strong>of</strong> <strong>in</strong>dicators was<br />
found to be effectively captured with <strong>the</strong> smaller<br />
set chosen. The exercise <strong>in</strong> FIAUI compar<strong>in</strong>g <strong>the</strong><br />
urban units <strong>of</strong> different populati<strong>on</strong> size classes has<br />
also been carried out and <strong>the</strong> results discussed <strong>in</strong><br />
this <str<strong>on</strong>g>Report</str<strong>on</strong>g>.<br />
3.2 Choice <strong>of</strong> <strong>Food</strong> <strong>Insecurity</strong> Indicators<br />
<strong>in</strong> <strong>the</strong> C<strong>on</strong>structi<strong>on</strong> <strong>of</strong> an Index <strong>of</strong> <strong>Food</strong><br />
and Nutriti<strong>on</strong> <strong>Insecurity</strong><br />
It is useful to discuss food security <strong>in</strong><br />
terms <strong>of</strong> three aspects/dimensi<strong>on</strong>s: availability,<br />
access and absorpti<strong>on</strong>. As po<strong>in</strong>ted out <strong>in</strong> FIAUI,<br />
it is not possible to obta<strong>in</strong> reliable data <strong>on</strong> urban<br />
food availability at <strong>the</strong> <strong>State</strong> level, given <strong>the</strong><br />
predom<strong>in</strong>ance and importance <strong>of</strong> private trade<br />
<strong>on</strong> which <strong>in</strong>formati<strong>on</strong> is not readily accessible.<br />
Moreover, physical availability <strong>of</strong> food per se may<br />
not be a big problem <strong>in</strong> urban sett<strong>in</strong>gs, given <strong>the</strong><br />
existence <strong>of</strong> a widespread retail trade network. So,<br />
it is appropriate to focus <strong>on</strong> access and absorpti<strong>on</strong>.<br />
FIAUI recognised <strong>the</strong> important role <strong>of</strong> <strong>the</strong><br />
public distributi<strong>on</strong> system (PDS) <strong>in</strong> improv<strong>in</strong>g<br />
access to food <strong>in</strong> urban areas, and used per capita<br />
c<strong>on</strong>sumpti<strong>on</strong> <strong>of</strong> gra<strong>in</strong> from PDS as an <strong>in</strong>dicator <strong>of</strong><br />
food access <strong>in</strong> <strong>the</strong> sense <strong>of</strong> affordability. It used <strong>the</strong><br />
calorie <strong>in</strong>take per capita <strong>of</strong> <strong>the</strong> bottom c<strong>on</strong>sumer<br />
expenditure decile also as such an <strong>in</strong>dicator. It<br />
comb<strong>in</strong>ed <strong>the</strong>se two <strong>in</strong>to an “affordability” <strong>in</strong>dex.<br />
C<strong>on</strong>sider<strong>in</strong>g that poverty, employment as<br />
a casual labourer, and illiteracy would all imply<br />
poor earn<strong>in</strong>gs/earn<strong>in</strong>g capability, FIAUI comb<strong>in</strong>ed<br />
<strong>the</strong> follow<strong>in</strong>g variables <strong>in</strong>to an “access” <strong>in</strong>dex:<br />
percentage <strong>of</strong> populati<strong>on</strong> below <strong>the</strong> poverty l<strong>in</strong>e,<br />
percentage <strong>of</strong> households <strong>in</strong> <strong>the</strong> bottom decile<br />
<strong>of</strong> <strong>the</strong> c<strong>on</strong>sumer expenditure distributi<strong>on</strong> which<br />
are casual labour households, and percentage <strong>of</strong><br />
illiterates. On <strong>the</strong> ground that caste and gender<br />
discrim<strong>in</strong>ati<strong>on</strong> can also <strong>in</strong>fluence access to food,<br />
FIAUI comb<strong>in</strong>ed <strong>the</strong> proporti<strong>on</strong> <strong>of</strong> Scheduled<br />
Castes and <strong>the</strong> daily earn<strong>in</strong>gs differential between<br />
men and women measured as <strong>the</strong> ratio <strong>of</strong> <strong>the</strong> male<br />
wage rate to that <strong>of</strong> <strong>the</strong> female wage rate <strong>in</strong>to a<br />
“discrim<strong>in</strong>ati<strong>on</strong>” <strong>in</strong>dex.<br />
It is well recognised that <strong>the</strong> absorpti<strong>on</strong><br />
aspect <strong>of</strong> food security is particularly important <strong>in</strong><br />
urban sett<strong>in</strong>gs s<strong>in</strong>ce <strong>the</strong>se are <strong>of</strong>ten characterised<br />
– especially <strong>in</strong> slums – by issues such as very<br />
poor dr<strong>in</strong>k<strong>in</strong>g water, sanitati<strong>on</strong>, dra<strong>in</strong>age and<br />
waste disposal facilities, besides hav<strong>in</strong>g to deal<br />
with urban morbidity brought about <strong>in</strong> part by a<br />
polluted envir<strong>on</strong>ment. FIAUI sought to capture<br />
<strong>the</strong> absorpti<strong>on</strong> aspect by means <strong>of</strong> three clusters<br />
<strong>of</strong> variables. It comb<strong>in</strong>ed <strong>the</strong> percentages <strong>of</strong> urban<br />
populati<strong>on</strong> liv<strong>in</strong>g <strong>in</strong> slums, <strong>of</strong> households without a<br />
toilet, <strong>of</strong> households without access to safe dr<strong>in</strong>k<strong>in</strong>g<br />
water and <strong>the</strong> number <strong>of</strong> pers<strong>on</strong>s per hospital bed<br />
<strong>in</strong>to a “sanitati<strong>on</strong> and health” <strong>in</strong>dex. It comb<strong>in</strong>ed<br />
<strong>the</strong> percentage <strong>of</strong> households liv<strong>in</strong>g <strong>in</strong> katcha<br />
houses and <strong>the</strong> percentage liv<strong>in</strong>g <strong>in</strong> semi-pucca<br />
houses <strong>in</strong>to a “hous<strong>in</strong>g” <strong>in</strong>dex. F<strong>in</strong>ally, tak<strong>in</strong>g <strong>in</strong>to<br />
account <strong>the</strong> l<strong>in</strong>k between absorpti<strong>on</strong> and nutriti<strong>on</strong>,<br />
it comb<strong>in</strong>ed IMR, life expectati<strong>on</strong> at <strong>the</strong> age <strong>of</strong> 1<br />
year, percentage <strong>of</strong> populati<strong>on</strong> chr<strong>on</strong>ically ill and<br />
<strong>the</strong> juvenile sex ratio (girls per 1000 boys <strong>in</strong> <strong>the</strong><br />
age group 0-6 years) <strong>in</strong>to a “nutriti<strong>on</strong>al outcome”<br />
<strong>in</strong>dex. Besides analys<strong>in</strong>g urban food <strong>in</strong>security<br />
across <strong>the</strong> <strong>State</strong>s us<strong>in</strong>g <strong>the</strong> cluster-based <strong>in</strong>dexes,<br />
14 As Deat<strong>on</strong> and Dreze (2008) have argued, outcome <strong>in</strong>dicators, though not without problems, may be better po<strong>in</strong>ters to food security status<br />
than <strong>in</strong>put <strong>in</strong>dicators.
FIAUI also worked out an overall urban food<br />
<strong>in</strong>security <strong>in</strong>dex for <strong>India</strong> and select <strong>State</strong>s.<br />
The present exercise has been carried out<br />
<strong>on</strong> <strong>the</strong> premise that though <strong>the</strong> <strong>in</strong>dicators used<br />
<strong>in</strong> FIAUI were relevant to food <strong>in</strong>security, a<br />
comparis<strong>on</strong> <strong>of</strong> <strong>the</strong> urban food security situati<strong>on</strong> <strong>in</strong><br />
various <strong>State</strong>s can be carried out with a smaller<br />
number <strong>of</strong> <strong>in</strong>dicators. For reas<strong>on</strong>s that have been<br />
elaborately expla<strong>in</strong>ed <strong>in</strong> <strong>the</strong> <str<strong>on</strong>g>Report</str<strong>on</strong>g> <strong>on</strong> <strong>the</strong> <strong>State</strong> <strong>of</strong><br />
<strong>Food</strong> <strong>Insecurity</strong> <strong>of</strong> Rural <strong>India</strong> (RSFIRI) (MSSRF-<br />
WFP 2008), 8 or 9 <strong>in</strong>dicators – both <strong>in</strong>put and<br />
outcome <strong>in</strong>dicators – have been chosen <strong>in</strong> each<br />
variant <strong>of</strong> <strong>the</strong> overall <strong>in</strong>dex <strong>of</strong> food <strong>in</strong>security.<br />
S<strong>in</strong>ce it would be difficult to get a reliable measure<br />
<strong>of</strong> food availability <strong>in</strong> <strong>the</strong> urban sett<strong>in</strong>g, <strong>in</strong>dicators<br />
that capture <strong>the</strong> access and absorpti<strong>on</strong> dimensi<strong>on</strong>s<br />
<strong>of</strong> food security have been relied up<strong>on</strong>. In all, 11<br />
<strong>in</strong>dicators have been exam<strong>in</strong>ed.<br />
1.<br />
2.<br />
3.<br />
4.<br />
5.<br />
6.<br />
7.<br />
8.<br />
Percentage <strong>of</strong> urban populati<strong>on</strong> c<strong>on</strong>sum<strong>in</strong>g less<br />
than 1890 Kcal per c<strong>on</strong>sumer unit per day<br />
Number per 1000 <strong>of</strong> urban male workers not<br />
‘regularly employed’<br />
Number per 1000 <strong>of</strong> urban female workers not<br />
‘regularly employed’<br />
Percentage <strong>of</strong> urban households without access<br />
to safe dr<strong>in</strong>k<strong>in</strong>g water<br />
Percentage <strong>of</strong> urban households without access<br />
to toilets<br />
Percentage <strong>of</strong> ever-married women (15-49<br />
years) with any anaemia<br />
Percentage <strong>of</strong> ever-married women (15-49<br />
years) with chr<strong>on</strong>ic energy deficiency (CED)<br />
Percentage <strong>of</strong> children (6-35 m<strong>on</strong>ths) with any<br />
anaemia<br />
URBAN FOOD INSECURITY ACROSS STATES 55<br />
9. Percentage <strong>of</strong> children (6-35 m<strong>on</strong>ths) who are<br />
stunted<br />
10. Percentage <strong>of</strong> children (6-35 m<strong>on</strong>ths) who are<br />
underweight for age<br />
11. Percentage <strong>of</strong> children (6-35 m<strong>on</strong>ths) who are<br />
wast<strong>in</strong>g<br />
The first three <strong>in</strong>dicators relate to <strong>the</strong><br />
dimensi<strong>on</strong> <strong>of</strong> access to food. The first <strong>in</strong>dicator,<br />
namely <strong>the</strong> proporti<strong>on</strong> <strong>of</strong> <strong>the</strong> urban populati<strong>on</strong><br />
c<strong>on</strong>sum<strong>in</strong>g less than 1890 Kcal per c<strong>on</strong>sumer unit<br />
per day, is a direct measure <strong>of</strong> calorie deprivati<strong>on</strong><br />
and thus <strong>of</strong> <strong>in</strong>adequate <strong>in</strong>take <strong>of</strong> food 15 . The sec<strong>on</strong>d<br />
and third <strong>in</strong>dicators reflect material deprivati<strong>on</strong> as<br />
well as <strong>in</strong>stability <strong>in</strong> earn<strong>in</strong>gs, both <strong>of</strong> which have<br />
implicati<strong>on</strong>s for food security. The NCEUS f<strong>in</strong>al<br />
report gives us a fair <strong>in</strong>dicati<strong>on</strong> <strong>of</strong> how earn<strong>in</strong>gs <strong>in</strong><br />
self-employment and casual wage labour are both<br />
low and precarious 16 .The fourth and fifth <strong>in</strong>dicators<br />
relate to absorpti<strong>on</strong>. They are <strong>in</strong>put <strong>in</strong>dicators that<br />
have implicati<strong>on</strong>s for nutriti<strong>on</strong>al outcomes and<br />
thus for food and nutriti<strong>on</strong> security. The rema<strong>in</strong><strong>in</strong>g<br />
6 <strong>in</strong>dicators are all outcome <strong>in</strong>dicators. The overall<br />
urban food <strong>in</strong>security <strong>in</strong>dex has been worked out<br />
<strong>in</strong> several variants, alternat<strong>in</strong>g <strong>the</strong> child nutriti<strong>on</strong><br />
outcome <strong>in</strong>dicators am<strong>on</strong>g <strong>the</strong>mselves as well as<br />
try<strong>in</strong>g <strong>the</strong> <strong>in</strong>dex with and without <strong>the</strong> <strong>in</strong>dicator <strong>of</strong><br />
proporti<strong>on</strong> <strong>of</strong> households without access to safe<br />
dr<strong>in</strong>k<strong>in</strong>g water.<br />
3.2.1 Percentage <strong>of</strong> Populati<strong>on</strong><br />
C<strong>on</strong>sum<strong>in</strong>g Less than 1890 Kcal /Cu/diem<br />
The calorie, a unit <strong>of</strong> energy, has always<br />
been c<strong>on</strong>sidered as <strong>the</strong> ma<strong>in</strong> measure <strong>of</strong> food<br />
adequacy and is <strong>the</strong> basis <strong>of</strong> poverty measurement<br />
15 In so far as <strong>the</strong> <strong>of</strong>ficial measure <strong>of</strong> poverty is based <strong>on</strong> a calorie norm, this can also be taken as reflect<strong>in</strong>g poverty <strong>in</strong>cidence. But it is well<br />
known that <strong>the</strong> reported <strong>of</strong>ficial poverty ratios deviate significantly from <strong>the</strong> proporti<strong>on</strong> <strong>of</strong> <strong>the</strong> populati<strong>on</strong> fac<strong>in</strong>g calorie deprivati<strong>on</strong> and<br />
tend to understate poverty. So <strong>the</strong> measure used here is preferable.<br />
16 NCEUS 2009, F<strong>in</strong>al <str<strong>on</strong>g>Report</str<strong>on</strong>g>, Volume 1.
56 REPORT ON THE STATE OF FOOD INSECURITY IN URBAN INDIA<br />
<strong>in</strong> <strong>India</strong>17 . What is <strong>the</strong> calorie level that can be<br />
c<strong>on</strong>sidered adequate for a healthy life? There is no<br />
clear answer. The actual calorific requirements <strong>of</strong><br />
an <strong>in</strong>dividual depend <strong>on</strong> factors such as sex, age,<br />
bodyweight and nature <strong>of</strong> work, all <strong>of</strong> which vary<br />
across people. Fix<strong>in</strong>g a norm, <strong>the</strong>refore, requires a<br />
detailed analysis <strong>of</strong> <strong>the</strong> populati<strong>on</strong> be<strong>in</strong>g studied.<br />
In sett<strong>in</strong>g <strong>the</strong> poverty l<strong>in</strong>e, <strong>the</strong> Government<br />
<strong>of</strong> <strong>India</strong> applied a norm based <strong>on</strong> ICMR<br />
recommendati<strong>on</strong>s, <strong>of</strong> 2400 Kcal per c<strong>on</strong>sumer unit<br />
for rural <strong>India</strong> and 2100 Kcal per c<strong>on</strong>sumer unit<br />
for urban <strong>India</strong>18 . In this <str<strong>on</strong>g>Report</str<strong>on</strong>g>, <strong>the</strong> figure <strong>of</strong> 1890<br />
Kcal per c<strong>on</strong>sumer unit per day – 70 per cent <strong>of</strong> <strong>the</strong><br />
<strong>in</strong>ternati<strong>on</strong>al norm <strong>of</strong> 2700 Kcal – has been taken<br />
as <strong>the</strong> measure <strong>of</strong> <strong>the</strong> extent <strong>of</strong> food <strong>in</strong>adequacy,<br />
and <strong>the</strong> percentage <strong>of</strong> urban populati<strong>on</strong> with a<br />
calorie <strong>in</strong>take below this figure has been <strong>in</strong>cluded<br />
as an <strong>in</strong>dicator <strong>in</strong> <strong>the</strong> <strong>in</strong>dex. The m<strong>in</strong>imum calorie<br />
requirement calculati<strong>on</strong>s have been based <strong>on</strong> agesex<br />
compositi<strong>on</strong>, <strong>the</strong> lowest acceptable weight for<br />
<strong>the</strong> typical height <strong>of</strong> <strong>the</strong> group <strong>in</strong> a country and<br />
<strong>the</strong> light activity norm (FAO 2000). It is safe to<br />
say that a pers<strong>on</strong> c<strong>on</strong>sum<strong>in</strong>g anyth<strong>in</strong>g below this<br />
bare m<strong>in</strong>imum level is likely to face l<strong>on</strong>g-term ill<br />
effects <strong>of</strong> malnourishment.<br />
The percentage <strong>of</strong> urban populati<strong>on</strong> tak<strong>in</strong>g<br />
<strong>in</strong> less than 1890 Kcal per c<strong>on</strong>sumer unit per day<br />
can be worked out for <strong>the</strong> major <strong>State</strong>s and for<br />
<strong>India</strong> as a whole from NSSO data <strong>on</strong> <strong>the</strong> per capita<br />
calorie <strong>in</strong>take <strong>of</strong> urban households. This <str<strong>on</strong>g>Report</str<strong>on</strong>g><br />
has made use <strong>of</strong> data from <strong>the</strong> 55th and 61st rounds<br />
<strong>of</strong> <strong>the</strong> NSSO for reference years 1999-2000 and<br />
2004-05, respectively.<br />
3.2.2 Percentages <strong>of</strong> Male and Female<br />
Workers not “Regularly Employed”<br />
It is clear that for most urban households,<br />
employment is <strong>the</strong> key to survival and food<br />
security. A large proporti<strong>on</strong> <strong>of</strong> <strong>the</strong> urban workforce<br />
is <strong>in</strong> self-employment or casual/c<strong>on</strong>tract wage<br />
employment. These are precarious sources <strong>of</strong><br />
earn<strong>in</strong>g and very low <strong>on</strong> <strong>the</strong> average. Regular<br />
(paid) employment, <strong>on</strong> <strong>the</strong> o<strong>the</strong>r hand, provides a<br />
modicum <strong>of</strong> food security even when <strong>the</strong> rates <strong>of</strong><br />
payment are modest. It seems plausible <strong>the</strong>refore<br />
that <strong>the</strong> percentages <strong>of</strong> male and female workforces<br />
not regularly employed would serve as reas<strong>on</strong>able<br />
measures <strong>of</strong> lack <strong>of</strong> access to food security. The<br />
data <strong>on</strong> this pair <strong>of</strong> <strong>in</strong>dicators is separately available<br />
for male and female workers from <strong>the</strong> large sample<br />
55th and 61st NSSO rounds <strong>on</strong> employment and<br />
unemployment perta<strong>in</strong><strong>in</strong>g, respectively, to <strong>the</strong><br />
reference years 1999-2000 and 2004-05.<br />
3.2.3 Percentage <strong>of</strong> Households Not<br />
hav<strong>in</strong>g Access to Safe Dr<strong>in</strong>k<strong>in</strong>g Water<br />
Water is def<strong>in</strong>ed as safe if it is free from<br />
biological c<strong>on</strong>tam<strong>in</strong>ati<strong>on</strong> (gu<strong>in</strong>ea worm, cholera,<br />
typhoid, etc.) and chemical c<strong>on</strong>tam<strong>in</strong>ati<strong>on</strong> (excess<br />
fluoride, brackishness, ir<strong>on</strong>, arsenic, nitrate, etc.).<br />
Besides play<strong>in</strong>g a vital role <strong>in</strong> nearly every functi<strong>on</strong><br />
<strong>of</strong> <strong>the</strong> body, <strong>in</strong>clud<strong>in</strong>g protect<strong>in</strong>g <strong>the</strong> immune<br />
system and help<strong>in</strong>g removal <strong>of</strong> waste matter,<br />
water is crucial for nutriti<strong>on</strong>. Access to safe water<br />
is thus a fundamental human need and should be<br />
c<strong>on</strong>sidered a basic human right. It has been argued<br />
that as c<strong>on</strong>sumpti<strong>on</strong> <strong>of</strong> safe water <strong>in</strong> adequate<br />
quantities ensures <strong>the</strong> physical and social health <strong>of</strong><br />
all people and plays a crucial role <strong>in</strong> <strong>the</strong>ir nutriti<strong>on</strong>al<br />
well be<strong>in</strong>g, provid<strong>in</strong>g safe dr<strong>in</strong>k<strong>in</strong>g water to all<br />
communities should be <strong>the</strong> basic start<strong>in</strong>g po<strong>in</strong>t<br />
to achieve nutriti<strong>on</strong> targets (Meenakshisundaram<br />
2004). Access to safe dr<strong>in</strong>k<strong>in</strong>g water is crucial for<br />
ensur<strong>in</strong>g effective biological utilisati<strong>on</strong> <strong>of</strong> food<br />
taken by an <strong>in</strong>dividual. It is a key element <strong>of</strong> <strong>the</strong><br />
absorpti<strong>on</strong> aspect <strong>of</strong> food and nutriti<strong>on</strong> security.<br />
17 There are o<strong>the</strong>r important necessary nutrients but when <strong>the</strong> calorie <strong>in</strong>take is low, determ<strong>in</strong><strong>in</strong>g <strong>the</strong> use <strong>of</strong> proper prote<strong>in</strong>s is not possible<br />
and nutriti<strong>on</strong>al assessment is made by treat<strong>in</strong>g calories as <strong>the</strong> s<strong>in</strong>gle largest item (Sengupta and Joshi 1978).<br />
18 Plann<strong>in</strong>g Commissi<strong>on</strong> 1993.
Data <strong>on</strong> percentage <strong>of</strong> households without<br />
access to a safe source <strong>of</strong> dr<strong>in</strong>k<strong>in</strong>g water is available<br />
from <strong>the</strong> Census <strong>of</strong> <strong>India</strong> reports for <strong>the</strong> years 1991<br />
(used <strong>in</strong> RSFIRI) and 2001, separately for both<br />
rural and urban areas. There is also data from <strong>the</strong><br />
NFHS 2 for reference year 1998-99 and NFHS 3<br />
for 2005-06. However, <strong>the</strong>re are some difficulties<br />
<strong>of</strong> <strong>in</strong>terpretati<strong>on</strong> that must be kept <strong>in</strong> m<strong>in</strong>d. The<br />
def<strong>in</strong>iti<strong>on</strong> <strong>of</strong> “safe source <strong>of</strong> dr<strong>in</strong>k<strong>in</strong>g water” 19<br />
used <strong>in</strong> <strong>the</strong> Census or <strong>in</strong> NFHS is not entirely<br />
satisfactory. Additi<strong>on</strong>ally, <strong>the</strong> data <strong>in</strong> NFHS 3 relate<br />
to “access to an improved source <strong>of</strong> water” while<br />
those <strong>in</strong> NFHS 2 refer to water from a hand pump<br />
or piped water. Despite <strong>the</strong>se problems, <strong>in</strong> view <strong>of</strong><br />
its importance <strong>in</strong> food absorpti<strong>on</strong>, <strong>the</strong> <strong>in</strong>dicator <strong>of</strong><br />
“proporti<strong>on</strong> <strong>of</strong> households without access to safe<br />
dr<strong>in</strong>k<strong>in</strong>g water” has been reta<strong>in</strong>ed <strong>in</strong> some <strong>of</strong> <strong>the</strong><br />
variants <strong>of</strong> <strong>the</strong> overall <strong>in</strong>dex.<br />
3.2.4 Percentage <strong>of</strong> Households without<br />
Access to Toilets<br />
The World Health Organizati<strong>on</strong> (WHO)<br />
def<strong>in</strong>es sanitati<strong>on</strong> as safe management <strong>of</strong> human<br />
excreta, <strong>in</strong>clud<strong>in</strong>g <strong>the</strong> provisi<strong>on</strong> <strong>of</strong> latr<strong>in</strong>es and <strong>the</strong><br />
promoti<strong>on</strong> <strong>of</strong> pers<strong>on</strong>al hygiene. Envir<strong>on</strong>mental<br />
sanitati<strong>on</strong> is a broader term, encompass<strong>in</strong>g excreta<br />
disposal, solid waste management, wastewater<br />
disposal, vector c<strong>on</strong>trol, and dra<strong>in</strong>age. Pers<strong>on</strong>al<br />
hygiene <strong>in</strong>cludes practices such as wash<strong>in</strong>g hands<br />
with soap after defecati<strong>on</strong> and before c<strong>on</strong>tact<br />
with food, and <strong>in</strong> a broader sense, extends to <strong>the</strong><br />
collecti<strong>on</strong>, storage and handl<strong>in</strong>g <strong>of</strong> safe water.<br />
The higher <strong>in</strong>cidence rates <strong>of</strong> <strong>in</strong>fecti<strong>on</strong> <strong>in</strong> an<br />
undernourished child can be accounted for by <strong>the</strong><br />
poor sanitati<strong>on</strong> and envir<strong>on</strong>mental hygiene <strong>in</strong> <strong>the</strong><br />
household. Poor sanitati<strong>on</strong> can cause and prol<strong>on</strong>g<br />
URBAN FOOD INSECURITY ACROSS STATES 57<br />
communicable diseases lead<strong>in</strong>g to poor nutriti<strong>on</strong>.<br />
Children who are malnourished also tend to come<br />
from families with <strong>the</strong> least access to potable<br />
water, sanitati<strong>on</strong> and healthcare services (NFHS<br />
2007). Thus, higher <strong>in</strong>cidence rates <strong>of</strong> <strong>in</strong>fecti<strong>on</strong> <strong>in</strong><br />
an undernourished child could well be accounted<br />
for by <strong>the</strong> poor hygienic envir<strong>on</strong>ment that <strong>the</strong> child<br />
lives <strong>in</strong> (Sagar and Qadeer 2004). This has a direct<br />
impact <strong>on</strong> <strong>the</strong> biological absorpti<strong>on</strong> <strong>of</strong> food <strong>in</strong><br />
<strong>the</strong> body. The percentage <strong>of</strong> households without<br />
access to toilets is thus a plausible <strong>in</strong>dicator <strong>of</strong> food<br />
and nutriti<strong>on</strong> <strong>in</strong>security, captur<strong>in</strong>g as it does an<br />
important aspect <strong>of</strong> <strong>the</strong> dimensi<strong>on</strong> <strong>of</strong> absorpti<strong>on</strong>.<br />
Data <strong>on</strong> this <strong>in</strong>dicator for <strong>India</strong> and <strong>the</strong><br />
various <strong>State</strong>s is available from NFHS 2 for 1998-<br />
99 and NFHS 3 for 2005-06.<br />
3.2.5 Anaemia am<strong>on</strong>g (a) Ever-married<br />
Women Age 15-49 Years and<br />
(b) Children <strong>in</strong> <strong>the</strong> Age Group <strong>of</strong><br />
6-35 M<strong>on</strong>ths<br />
In <strong>India</strong>n sett<strong>in</strong>gs, ir<strong>on</strong> deficiency is known<br />
to be <strong>the</strong> major cause <strong>of</strong> anaemia20 . It must,<br />
however, be noted that <strong>in</strong>fectious diseases – <strong>in</strong><br />
particular, those such as malaria, tuberculosis and<br />
HIV/AIDS – are important factors c<strong>on</strong>tribut<strong>in</strong>g<br />
to <strong>the</strong> high prevalence <strong>of</strong> anaemia <strong>in</strong> many<br />
populati<strong>on</strong>s. Besides lack <strong>of</strong> ir<strong>on</strong>, nutriti<strong>on</strong>al<br />
deficiencies <strong>of</strong> folate, vitam<strong>in</strong> B12 and vitam<strong>in</strong> A<br />
can also cause anaemia, although <strong>the</strong> magnitude <strong>of</strong><br />
<strong>the</strong>ir c<strong>on</strong>tributi<strong>on</strong> is unclear. On <strong>the</strong> whole, a high<br />
level <strong>of</strong> anaemia may be seen as an <strong>in</strong>dicator <strong>of</strong><br />
poor health and nutriti<strong>on</strong>.<br />
Two important outcome measures <strong>of</strong> food<br />
and nutriti<strong>on</strong> <strong>in</strong>security used <strong>in</strong> this <str<strong>on</strong>g>Report</str<strong>on</strong>g> are <strong>the</strong><br />
19 As per <strong>the</strong> Census <strong>of</strong> <strong>India</strong>, if a household has access to dr<strong>in</strong>k<strong>in</strong>g water supplied from a tap, hand-pump/tube well with<strong>in</strong> or outside<br />
<strong>the</strong> premises, it is c<strong>on</strong>sidered as hav<strong>in</strong>g access to safe dr<strong>in</strong>k<strong>in</strong>g water. Such access may be more noti<strong>on</strong>al than real where <strong>the</strong> c<strong>on</strong>cerned<br />
source has ei<strong>the</strong>r dried up or is not functi<strong>on</strong><strong>in</strong>g. Besides, water from open wells, boiled and drunk, would also be safe by any reas<strong>on</strong>able<br />
def<strong>in</strong>iti<strong>on</strong>.<br />
20 vhttp://www.imanati<strong>on</strong>al.com/Anaemia.htm#Appeal%20to%20IMA%20Members
58 REPORT ON THE STATE OF FOOD INSECURITY IN URBAN INDIA<br />
percentage <strong>of</strong> ever-married women <strong>in</strong> <strong>the</strong> age group<br />
<strong>of</strong> 15-49 years with anaemia and <strong>the</strong> percentage<br />
<strong>of</strong> children <strong>in</strong> <strong>the</strong> age group <strong>of</strong> 6-35 m<strong>on</strong>ths who<br />
are anaemic. The first measure captures anaemia<br />
am<strong>on</strong>g both adolescent girls and women <strong>in</strong> <strong>the</strong><br />
fertile age group. The sec<strong>on</strong>d measure is a critical<br />
<strong>in</strong>dicator <strong>in</strong> a lifecycle approach to food and<br />
nutriti<strong>on</strong> security.<br />
Data <strong>on</strong> both <strong>in</strong>dicators are available for<br />
urban areas for two different po<strong>in</strong>ts <strong>in</strong> time from<br />
<strong>the</strong> sec<strong>on</strong>d and third rounds <strong>of</strong> <strong>the</strong> NFHS perta<strong>in</strong><strong>in</strong>g<br />
to reference years 1998-99 and 2005-06.<br />
3.2.6 Percentage <strong>of</strong> Women (15-49 yrs)<br />
with Chr<strong>on</strong>ic Energy Deficiency<br />
A typical and frequently used <strong>in</strong>dicator <strong>of</strong><br />
poor nutriti<strong>on</strong> is <strong>the</strong> body mass <strong>in</strong>dex (BMI). BMI<br />
is def<strong>in</strong>ed as <strong>the</strong> ratio <strong>of</strong> weight <strong>of</strong> a pers<strong>on</strong> to<br />
<strong>the</strong> square <strong>of</strong> <strong>the</strong> pers<strong>on</strong>’s height, with <strong>the</strong> weight<br />
normally measured <strong>in</strong> kilograms and <strong>the</strong> height <strong>in</strong><br />
metres. BMI is known to be a good predicter <strong>of</strong> <strong>the</strong><br />
risk <strong>of</strong> morbidity and mortality (Floud 1992; Fogel<br />
1997). A level <strong>of</strong> BMI below 18.5 thus measured<br />
<strong>in</strong>dicates a state <strong>of</strong> chr<strong>on</strong>ic energy deficiency.<br />
One reas<strong>on</strong> for choos<strong>in</strong>g <strong>the</strong> percentage <strong>of</strong> women<br />
with CED as an <strong>in</strong>dicator <strong>of</strong> food and nutriti<strong>on</strong><br />
<strong>in</strong>security is that female health has a significant<br />
lifecycle impact; very <strong>of</strong>ten children tend to be<br />
malnourished because <strong>the</strong>ir mo<strong>the</strong>rs are. Women’s<br />
health is also <strong>of</strong> particular c<strong>on</strong>cern <strong>in</strong> <strong>India</strong> due<br />
to <strong>the</strong> ec<strong>on</strong>omic, social and cultural dimensi<strong>on</strong>s<br />
<strong>of</strong> entrenched gender <strong>in</strong>equality (Ramachandran<br />
et al. 2006). The sec<strong>on</strong>d reas<strong>on</strong> for choos<strong>in</strong>g this<br />
<strong>in</strong>dicator is that <strong>the</strong>re is all-<strong>India</strong> and <strong>State</strong> level<br />
data for this <strong>in</strong>dicator from <strong>the</strong> sec<strong>on</strong>d and third<br />
rounds <strong>of</strong> NFHS.<br />
3.2.7 Percentage <strong>of</strong> Children (6-35<br />
M<strong>on</strong>ths) who are Stunted<br />
Growth stunt<strong>in</strong>g, def<strong>in</strong>ed as height for age<br />
below <strong>the</strong> fifth percentile <strong>on</strong> a reference growth<br />
curve, is traditi<strong>on</strong>ally used as an <strong>in</strong>dicator <strong>of</strong><br />
nutriti<strong>on</strong>al status <strong>in</strong> children. Growth stunt<strong>in</strong>g is<br />
a populati<strong>on</strong>-based <strong>in</strong>dicator and can <strong>in</strong>dicate<br />
<strong>the</strong> prevalence <strong>of</strong> malnutriti<strong>on</strong> or nutriti<strong>on</strong>related<br />
disorders am<strong>on</strong>g an identified populati<strong>on</strong><br />
<strong>of</strong> children. Stunt<strong>in</strong>g <strong>of</strong> growth results from<br />
prol<strong>on</strong>ged or repeated episodes <strong>of</strong> nutriti<strong>on</strong>al<br />
deficiency. While short stature <strong>in</strong> any <strong>in</strong>dividual<br />
child may reflect normal genetic variati<strong>on</strong> and not<br />
chr<strong>on</strong>ic malnutriti<strong>on</strong>, <strong>the</strong> growth-stunt<strong>in</strong>g rate for<br />
a populati<strong>on</strong> <strong>of</strong> children can provide evidence <strong>of</strong><br />
<strong>the</strong> extent to which children <strong>in</strong> that populati<strong>on</strong> are<br />
experienc<strong>in</strong>g l<strong>on</strong>g-term nutriti<strong>on</strong>al deficiencies<br />
and suffer<strong>in</strong>g from o<strong>the</strong>r negative c<strong>on</strong>sequences<br />
(fatigue, dizz<strong>in</strong>ess, frequent headaches, frequent<br />
colds and <strong>in</strong>fecti<strong>on</strong>s, and difficulty c<strong>on</strong>centrat<strong>in</strong>g)<br />
<strong>of</strong> not gett<strong>in</strong>g enough to eat (FRAC 1995).<br />
Child weight-and-height performance can<br />
be viewed as <strong>the</strong> output <strong>of</strong> a “health producti<strong>on</strong><br />
functi<strong>on</strong>” whose <strong>in</strong>puts also <strong>in</strong>clude elements<br />
such as nutriti<strong>on</strong>al <strong>in</strong>take, exposure to <strong>in</strong>fecti<strong>on</strong>s,<br />
and healthcare. Human populati<strong>on</strong>s resp<strong>on</strong>d to<br />
chr<strong>on</strong>ic hunger and malnutriti<strong>on</strong> by decreas<strong>in</strong>g<br />
body size, known <strong>in</strong> medical terms as stunt<strong>in</strong>g or<br />
stunted growth. This process starts <strong>in</strong> utero if <strong>the</strong><br />
mo<strong>the</strong>r is malnourished and c<strong>on</strong>t<strong>in</strong>ues through<br />
approximately <strong>the</strong> third year <strong>of</strong> life. Once stunt<strong>in</strong>g<br />
has occurred, improved nutriti<strong>on</strong>al <strong>in</strong>take later <strong>in</strong><br />
life cannot reverse <strong>the</strong> damage. Limit<strong>in</strong>g body<br />
size as a way <strong>of</strong> adapt<strong>in</strong>g to low levels <strong>of</strong> energy<br />
(calories) adversely affects health <strong>in</strong> three ways:<br />
• Premature<br />
failure <strong>of</strong> vital organs occurs<br />
dur<strong>in</strong>g adulthood. For example, a<br />
50 year-old <strong>in</strong>dividual might die <strong>of</strong><br />
heart failure because his/her heart<br />
suffered structural defects dur<strong>in</strong>g early<br />
development.<br />
•<br />
•<br />
Stunted <strong>in</strong>dividuals suffer a far higher<br />
rate <strong>of</strong> disease and illness.<br />
Severe malnutriti<strong>on</strong> <strong>in</strong> early childhood<br />
<strong>of</strong>ten leads to defects <strong>in</strong> cognitive<br />
development.
The presence <strong>of</strong> stunt<strong>in</strong>g <strong>in</strong> children<br />
<strong>in</strong>dicates early malnutriti<strong>on</strong>. Stunt<strong>in</strong>g reflects<br />
growth impairment caused by ei<strong>the</strong>r a past episode<br />
(or episodes) <strong>of</strong> acute malnutriti<strong>on</strong>, or a rout<strong>in</strong>ely<br />
limited diet over an extended period, even where<br />
current nutriti<strong>on</strong> is adequate. It is an <strong>in</strong>dicator <strong>of</strong><br />
chr<strong>on</strong>ic malnutriti<strong>on</strong>.<br />
3.2.8 Percentage <strong>of</strong> Children (6-35<br />
m<strong>on</strong>ths) who are (a) Underweight for<br />
Age and (b) Wast<strong>in</strong>g<br />
Besides stunt<strong>in</strong>g, <strong>the</strong> o<strong>the</strong>r two important<br />
<strong>in</strong>dicators <strong>of</strong> malnutriti<strong>on</strong> are be<strong>in</strong>g underweight<br />
for age and wast<strong>in</strong>g. Data <strong>in</strong> respect <strong>of</strong> children<br />
between 6 m<strong>on</strong>ths and 35 m<strong>on</strong>ths <strong>of</strong> age are<br />
available for urban <strong>India</strong> and <strong>the</strong> <strong>State</strong>s from <strong>the</strong><br />
sec<strong>on</strong>d and third rounds <strong>of</strong> NFHS for <strong>the</strong> reference<br />
years 1998-99 and 2005-06, respectively. While<br />
wast<strong>in</strong>g <strong>in</strong> place <strong>of</strong> stunt<strong>in</strong>g/underweight has been<br />
discussed as an <strong>in</strong>dicator <strong>in</strong> variants <strong>of</strong> <strong>the</strong> overall<br />
<strong>in</strong>dex, it does not figure <strong>in</strong> <strong>the</strong> f<strong>in</strong>al <strong>in</strong>dex.<br />
3.3 Composite Index <strong>of</strong> <strong>Food</strong> and<br />
Nutriti<strong>on</strong> <strong>Insecurity</strong><br />
Us<strong>in</strong>g 8 or 9 <strong>of</strong> <strong>the</strong> 11 <strong>in</strong>dicators at a time,<br />
a set <strong>of</strong> variants <strong>of</strong> a composite <strong>in</strong>dex <strong>of</strong> food<br />
and nutriti<strong>on</strong> <strong>in</strong>security <strong>in</strong> urban <strong>India</strong> has been<br />
obta<strong>in</strong>ed. The <strong>in</strong>dex (<strong>in</strong> its several variants) is<br />
<strong>in</strong>tended as a summary measure <strong>of</strong> a complex,<br />
multidimensi<strong>on</strong>al c<strong>on</strong>cept, which cannot be<br />
captured by a s<strong>in</strong>gle <strong>in</strong>dicator al<strong>on</strong>e. There is<br />
<strong>in</strong>evitably an element <strong>of</strong> judgment or arbitrar<strong>in</strong>ess<br />
when an <strong>in</strong>dex is c<strong>on</strong>stituted from a number <strong>of</strong><br />
<strong>in</strong>dicators.<br />
One important questi<strong>on</strong> is that <strong>of</strong> weights<br />
to be attached to each <strong>of</strong> <strong>the</strong> <strong>in</strong>dividual <strong>in</strong>dicators<br />
when comb<strong>in</strong><strong>in</strong>g <strong>the</strong>m to form a s<strong>in</strong>gle <strong>in</strong>dex. This<br />
<strong>of</strong>ten <strong>in</strong>troduces a certa<strong>in</strong> amount <strong>of</strong> subjectivity<br />
<strong>in</strong>to <strong>the</strong> analysis. Prior <strong>the</strong>oretical c<strong>on</strong>siderati<strong>on</strong>s<br />
can be <strong>in</strong>voked <strong>in</strong> some c<strong>on</strong>texts to assign different<br />
relative weights to <strong>the</strong> various <strong>in</strong>dicators enter<strong>in</strong>g<br />
URBAN FOOD INSECURITY ACROSS STATES 59<br />
<strong>in</strong>to <strong>the</strong> c<strong>on</strong>structi<strong>on</strong> <strong>of</strong> <strong>the</strong> <strong>in</strong>dex. Alternatively,<br />
a simple rule such as assign<strong>in</strong>g an equal weight<br />
to each <strong>in</strong>dicator can be followed. While <strong>the</strong>re is<br />
<strong>in</strong>evitably some loss <strong>of</strong> <strong>in</strong>formati<strong>on</strong> when an <strong>in</strong>dex<br />
is c<strong>on</strong>structed from a number <strong>of</strong> <strong>in</strong>dicators, <strong>on</strong>e <strong>of</strong><br />
<strong>the</strong> merits <strong>of</strong> a s<strong>in</strong>gle <strong>in</strong>dex to summarise a complex<br />
phenomen<strong>on</strong> or process is that, <strong>in</strong> <strong>the</strong> c<strong>on</strong>text <strong>of</strong><br />
policy-mak<strong>in</strong>g, it is a more readily comprehended<br />
decisi<strong>on</strong> support tool.<br />
The c<strong>on</strong>venti<strong>on</strong> adopted <strong>in</strong> earlier MSSRF<br />
exercises <strong>on</strong> <strong>the</strong> c<strong>on</strong>structi<strong>on</strong> <strong>of</strong> a food <strong>in</strong>security<br />
<strong>in</strong>dex – that <strong>of</strong> assign<strong>in</strong>g equal weights to all<br />
<strong>the</strong> <strong>in</strong>dicators, after normalis<strong>in</strong>g <strong>the</strong> <strong>in</strong>dividual<br />
<strong>in</strong>dicators through <strong>the</strong> use <strong>of</strong> a relative distance<br />
measure – has been followed <strong>in</strong> this <str<strong>on</strong>g>Report</str<strong>on</strong>g>. Thus,<br />
<strong>in</strong> compar<strong>in</strong>g <strong>the</strong> different <strong>State</strong>s, for any given<br />
<strong>in</strong>dicator, <strong>the</strong> difference between <strong>the</strong> value <strong>of</strong> <strong>the</strong><br />
<strong>in</strong>dicator and <strong>the</strong> m<strong>in</strong>imum value has been taken<br />
as a proporti<strong>on</strong> <strong>of</strong> <strong>the</strong> difference between <strong>the</strong><br />
maximum and m<strong>in</strong>imum values.<br />
3.3.1 Methodology <strong>of</strong> Index<strong>in</strong>g<br />
The 9 or 10 <strong>in</strong>dicators c<strong>on</strong>sidered for<br />
obta<strong>in</strong><strong>in</strong>g <strong>the</strong> f<strong>in</strong>al food and nutriti<strong>on</strong> <strong>in</strong>security<br />
<strong>in</strong>dex are all unidirecti<strong>on</strong>al <strong>in</strong> <strong>the</strong> sense that a higher<br />
value <strong>of</strong> <strong>the</strong> <strong>in</strong>dicator implies a higher level <strong>of</strong><br />
food <strong>in</strong>security. The <strong>in</strong>dividual <strong>in</strong>dicators chosen<br />
for work<strong>in</strong>g out composite <strong>in</strong>dices are measured<br />
<strong>in</strong> different units and hence, <strong>in</strong> general, are not<br />
directly additive. It <strong>the</strong>refore becomes necessary<br />
to c<strong>on</strong>vert <strong>the</strong>m to some standard ‘units’ so that <strong>the</strong><br />
<strong>in</strong>itial scale chosen for measur<strong>in</strong>g <strong>the</strong> <strong>in</strong>dicators do<br />
not prejudice <strong>the</strong> results. One way <strong>of</strong> do<strong>in</strong>g this<br />
<strong>in</strong> an <strong>in</strong>ter-<strong>State</strong> comparis<strong>on</strong> exercise is to express<br />
<strong>the</strong> performance <strong>of</strong> each <strong>State</strong> with respect to each<br />
<strong>in</strong>dividual <strong>in</strong>dicator as a value between 0 and 1 by<br />
apply<strong>in</strong>g <strong>the</strong> follow<strong>in</strong>g formula:<br />
(actual value-m<strong>in</strong>imum value)<br />
<strong>in</strong>dex = -------------------------------------------<br />
(maximum value - m<strong>in</strong>imum value)
60 REPORT ON THE STATE OF FOOD INSECURITY IN URBAN INDIA<br />
Am<strong>on</strong>g <strong>the</strong> <strong>State</strong>s be<strong>in</strong>g compared, <strong>the</strong> most<br />
<strong>in</strong>secure <strong>on</strong>e with respect to any particular <strong>in</strong>dicator<br />
will have a “dimensi<strong>on</strong> <strong>in</strong>dex” value <strong>of</strong> 1 while <strong>the</strong><br />
least <strong>in</strong>secure <strong>State</strong> will have a value 0. The <strong>State</strong>s<br />
have been placed <strong>in</strong>to <strong>on</strong>e <strong>of</strong> five categories based<br />
<strong>on</strong> <strong>the</strong> level <strong>of</strong> food and nutriti<strong>on</strong> <strong>in</strong>security. A<br />
map has been obta<strong>in</strong>ed for each <strong>in</strong>dicator and also<br />
<strong>the</strong> f<strong>in</strong>al composite <strong>in</strong>dex, for two different time<br />
<strong>in</strong>tervals, namely 1998-2000 and 2004-06. This<br />
will help assess <strong>the</strong> relative change <strong>in</strong> <strong>the</strong> positi<strong>on</strong><br />
<strong>of</strong> <strong>the</strong> <strong>State</strong>s with regard to <strong>the</strong>se <strong>in</strong>dicators.<br />
3.3.2 Mapp<strong>in</strong>g Methodology<br />
The <strong>State</strong>s under analysis have been classified<br />
<strong>in</strong>to five typologies based <strong>on</strong> <strong>the</strong> level <strong>of</strong> <strong>in</strong>security<br />
us<strong>in</strong>g equal class <strong>in</strong>tervals for enabl<strong>in</strong>g comparis<strong>on</strong><br />
<strong>of</strong> <strong>the</strong> maps at two different time po<strong>in</strong>ts. The<br />
<strong>State</strong>s depicted <strong>in</strong> <strong>the</strong> darkest shade <strong>of</strong> red <strong>in</strong>dicate<br />
very high level <strong>of</strong> <strong>in</strong>security with regard to that<br />
particular <strong>in</strong>dicator and <strong>the</strong> lighter shades <strong>of</strong> red<br />
<strong>in</strong>dicate relatively lower levels <strong>of</strong> <strong>in</strong>security, with<br />
<strong>the</strong> least red <strong>in</strong>dicat<strong>in</strong>g <strong>the</strong> least <strong>in</strong>secure.<br />
3.3.3 <strong>State</strong>s Analysed<br />
The analysis presented <strong>in</strong> this <str<strong>on</strong>g>Report</str<strong>on</strong>g> perta<strong>in</strong>s<br />
to urban <strong>India</strong> and <strong>the</strong> urban areas <strong>of</strong> 18 <strong>State</strong>s.<br />
However, <strong>the</strong> data for three <strong>State</strong>s formed after <strong>the</strong><br />
1991 census and dur<strong>in</strong>g or before <strong>the</strong> 2001 census<br />
– Chhattisgarh, Jharkhand and Uttarakhand –<br />
have been merged with <strong>the</strong> data for <strong>the</strong> respective<br />
“parent” <strong>State</strong>s – Madhya Pradesh, Bihar and<br />
Uttar Pradesh, respectively. Thus, <strong>the</strong> comparis<strong>on</strong><br />
between 1998-2000 and 2004-06 relates to <strong>the</strong> 15<br />
composite major <strong>State</strong>s <strong>in</strong> existence <strong>in</strong> 1998, all<br />
with populati<strong>on</strong> <strong>of</strong> 20 milli<strong>on</strong> or more each as per<br />
Census 2001.<br />
For <strong>the</strong> period 2004-06, <strong>the</strong> data available<br />
separately for Bihar, Jharkhand, Madhya Pradesh,<br />
Chhattisgarh, Uttar Pradesh and Uttarakhand have<br />
been used <strong>in</strong> obta<strong>in</strong><strong>in</strong>g <strong>the</strong> relevant value <strong>of</strong> <strong>the</strong><br />
<strong>in</strong>dicator for <strong>the</strong> corresp<strong>on</strong>d<strong>in</strong>g composite <strong>State</strong> as<br />
an appropriately weighted average <strong>of</strong> <strong>the</strong> values<br />
for <strong>the</strong> c<strong>on</strong>stituent <strong>State</strong>s.<br />
The abbreviati<strong>on</strong>s used for <strong>the</strong> <strong>State</strong>s <strong>in</strong> <strong>the</strong><br />
Tables that follow are listed below:<br />
The data sets used <strong>in</strong> <strong>the</strong> c<strong>on</strong>structi<strong>on</strong> <strong>of</strong> <strong>the</strong><br />
<strong>in</strong>dex have been obta<strong>in</strong>ed from <strong>the</strong> NSSO reports<br />
for <strong>the</strong> 55th and 61st Rounds (reference years<br />
1999-2000 and 2004-05, respectively) and <strong>the</strong><br />
sec<strong>on</strong>d and third NFHS <str<strong>on</strong>g>Report</str<strong>on</strong>g>s for 1998-99 and<br />
2005-06, respectively.<br />
3.4 Indicator-wise Performance <strong>of</strong><br />
<strong>State</strong>s<br />
This subsecti<strong>on</strong> reviews <strong>the</strong> performance<br />
<strong>of</strong> <strong>the</strong> <strong>State</strong>s <strong>in</strong> respect <strong>of</strong> each <strong>in</strong>dicator <strong>in</strong> <strong>the</strong><br />
two periods under c<strong>on</strong>siderati<strong>on</strong>, 1998-2000 and<br />
2004-06.<br />
<strong>State</strong>s Abbreviati<strong>on</strong> <strong>State</strong>s Abbreviati<strong>on</strong> <strong>State</strong>s Abbreviati<strong>on</strong><br />
Andhra Pradesh AP Jharkhand JD Punjab PU<br />
Assam AS Karnataka KA Rajasthan RA<br />
Bihar BI Kerala KE Tamil Nadu TN<br />
Chhattisgarh CHH Madhya Pradesh MP Uttar Pradesh UP<br />
Gujarat GU Maharashtra MA Uttarakhand UT<br />
Haryana HA Orissa OR West Bengal WB
3.4.1 Proporti<strong>on</strong> <strong>of</strong> <strong>Urban</strong> Populati<strong>on</strong><br />
with Calorie Intake below 1890 Kcal per<br />
C<strong>on</strong>sumer Unit per Day<br />
Table 3.1 presents <strong>the</strong> proporti<strong>on</strong>s <strong>of</strong> urban<br />
populati<strong>on</strong> <strong>in</strong> each <strong>State</strong> that have a calorie <strong>in</strong>take<br />
<strong>of</strong> less than 1890 Kcal per day <strong>in</strong> 1999-2000 and<br />
2004-05. For <strong>India</strong> as a whole, <strong>the</strong>re has been a<br />
slight deteriorati<strong>on</strong>, with <strong>the</strong> marg<strong>in</strong>al difference <strong>in</strong><br />
Sl.<br />
No.<br />
URBAN FOOD INSECURITY ACROSS STATES 61<br />
Table 3.1<br />
Percentage <strong>of</strong> <strong>Urban</strong> Populati<strong>on</strong> C<strong>on</strong>sum<strong>in</strong>g Less than 1890 Kcal/Cu/diem,<br />
1999-2000 and 2004-2005<br />
<strong>State</strong>s<br />
Percentage <strong>of</strong> Populati<strong>on</strong> C<strong>on</strong>sum<strong>in</strong>g<br />
Less than 1890 Kcal/Cu/diem<br />
1999-2000 2004-05<br />
1 Andhra Pradesh 17.6 17.4<br />
2 Assam 14.7 6.6<br />
3 Bihar 14.0 9.3<br />
4 Gujarat 16.4 15.2<br />
5 Haryana 13.9 16.3<br />
6 Karnataka 19.0 16.3<br />
7 Kerala 19.8 21.8<br />
8 Madhya Pradesh 17.2 16.0<br />
9 Maharashtra 18.4 24.4<br />
10 Orissa 6.2 12.5<br />
11 Punjab 11.7 9.6<br />
12 Rajasthan 7.4 15.7<br />
13 Tamil Nadu 22.5 21.3<br />
14 Uttar Pradesh 16.7 10.6<br />
15 West Bengal 14.2 15.6<br />
<strong>India</strong> 16.2 16.7<br />
Source: NSSO 2001b; NSSO 2007c<br />
<strong>the</strong> percentage <strong>of</strong> urban populati<strong>on</strong> with a calorie<br />
<strong>in</strong>take less than 1890 Kcal per day go<strong>in</strong>g up from<br />
16.2 to 16.7.<br />
Am<strong>on</strong>g <strong>the</strong> 15 <strong>State</strong>s, 9 have shown<br />
improvement while <strong>the</strong> situati<strong>on</strong> has worsened <strong>in</strong><br />
<strong>the</strong> o<strong>the</strong>r 6. Assam, Uttar Pradesh and Bihar have<br />
shown significant improvement while <strong>the</strong> situati<strong>on</strong><br />
has worsened equally significantly <strong>in</strong> Rajasthan,<br />
Orissa and Maharashtra.<br />
The distributi<strong>on</strong> <strong>of</strong> <strong>the</strong> <strong>State</strong>s <strong>in</strong> terms <strong>of</strong><br />
<strong>the</strong> degree <strong>of</strong> food <strong>in</strong>security with respect to this<br />
<strong>in</strong>dicator <strong>in</strong> <strong>the</strong> two periods is shown <strong>in</strong> Table 3.1a<br />
and Maps 3.1a and 3.1b. Interest<strong>in</strong>gly, <strong>the</strong> more<br />
urbanised states like Tamil Nadu and Maharashtra<br />
and Kerala with <strong>the</strong>ir unique “urban” pr<strong>of</strong>ile have<br />
figured am<strong>on</strong>g <strong>the</strong> most food <strong>in</strong>secure by this<br />
<strong>in</strong>dicator.<br />
3.4.2 Share <strong>of</strong> <strong>Urban</strong> Male Workforce<br />
Not Regularly Employed<br />
Table 3.2 presents data <strong>on</strong> <strong>the</strong> number <strong>of</strong><br />
urban male workers not “regularly employed”<br />
per 1000 workers for <strong>the</strong> two periods 1999-2000
62 REPORT ON THE STATE OF FOOD INSECURITY IN URBAN INDIA<br />
Table 3.1a<br />
Distributi<strong>on</strong> <strong>of</strong> <strong>State</strong>s by Prevalence <strong>of</strong> Calorie Deprivati<strong>on</strong>, 1999-2000 and 2004-05<br />
Percentage <strong>of</strong> Populati<strong>on</strong> C<strong>on</strong>sum<strong>in</strong>g<br />
Less than 1890 Kcal/Cu/diem<br />
1999-2000 2004-05<br />
6 - 9.8 (Very Low <strong>Insecurity</strong>) OR, RA AS, BI, PU<br />
9.8 - 13.6 (Low <strong>Insecurity</strong>) PU UP, OR<br />
13.6 - 17.4 (Moderate <strong>Insecurity</strong>)<br />
GU, HA, MP, WB, BI,<br />
AS, UP<br />
GU, HA, MP, WB, RA,<br />
KA, AP<br />
17.4 - 21.2 (High <strong>Insecurity</strong>) AP, MA, KA, KE –<br />
21.2 - 25 (Very High <strong>Insecurity</strong>) TN TN, KE, MA<br />
Sl.<br />
No.<br />
Table 3.2<br />
Number per 1000 <strong>Urban</strong> Male Workers Not Regularly Employed, 1999-2000 and 2004-05<br />
Number per 1000 Male Workers<br />
Not Regularly Employed<br />
<strong>State</strong>s<br />
1999-2000 2004-05<br />
1 Andhra Pradesh 580 614<br />
2 Assam 595 567<br />
3 Bihar 690 661<br />
4 Gujarat 641 518<br />
5 Haryana 556 553<br />
6 Karnataka 583 610<br />
7 Kerala 720 748<br />
8 Madhya Pradesh 631 601<br />
9 Maharashtra 460 527<br />
10 Orissa 601 643<br />
11 Punjab 596 572<br />
12 Rajasthan 596 626<br />
13 Tamil Nadu 546 548<br />
14 Uttar Pradesh 666 636<br />
15 West Bengal 601 627<br />
<strong>India</strong> 583 594<br />
Source: NSSO 2001a; NSSO 2006
Percentage <strong>of</strong> Populati<strong>on</strong> C<strong>on</strong>sum<strong>in</strong>g less than 1890 Kcal/Cu/diem <strong>in</strong> <strong>Urban</strong> <strong>India</strong><br />
(1999-2000)
Percentage <strong>of</strong> Populati<strong>on</strong> C<strong>on</strong>sum<strong>in</strong>g less than 1890 Kcal/Cu/diem <strong>in</strong> <strong>Urban</strong> <strong>India</strong><br />
(2004-05)
and 2004-05. At <strong>the</strong> all-<strong>India</strong> level, <strong>the</strong>re has<br />
been a marg<strong>in</strong>al <strong>in</strong>crease <strong>in</strong> <strong>the</strong> proporti<strong>on</strong> <strong>of</strong> <strong>the</strong><br />
workforce that is ei<strong>the</strong>r self-employed or is <strong>in</strong> casual<br />
employment. Gujarat showed <strong>the</strong> largest decl<strong>in</strong>e<br />
<strong>in</strong> <strong>the</strong> percentage <strong>of</strong> <strong>the</strong> urban male workforce<br />
not regularly employed while its neighbour<br />
Maharashtra showed <strong>the</strong> largest <strong>in</strong>crease. It is<br />
difficult to discern any pattern l<strong>in</strong>ked to <strong>the</strong> degree<br />
<strong>of</strong> urbanisati<strong>on</strong>/<strong>in</strong>dustrialisati<strong>on</strong>. <strong>Urban</strong>ised<br />
Tamil Nadu displayed hardly any change but<br />
Maharashtra and Gujarat, both relatively more<br />
<strong>in</strong>dustrialised than many o<strong>the</strong>r <strong>State</strong>s, moved <strong>in</strong><br />
opposite directi<strong>on</strong>s. Am<strong>on</strong>g <strong>the</strong> relatively less<br />
<strong>in</strong>dustrialised <strong>State</strong>s, while Bihar, Madhya Pradesh<br />
and Uttar Pradesh showed an <strong>in</strong>crease <strong>in</strong> <strong>the</strong> share<br />
<strong>of</strong> regular employment, Orissa and Rajasthan<br />
exhibited a decrease. Overall, 7 <strong>State</strong>s have shown<br />
an <strong>in</strong>crease <strong>in</strong> <strong>the</strong> proporti<strong>on</strong> regularly employed,<br />
and 8 a decrease. Haryana and Tamil Nadu had<br />
<strong>the</strong> smallest change. It seems as if <strong>State</strong>-specific<br />
factors ra<strong>the</strong>r than <strong>the</strong> degree <strong>of</strong> urbanisati<strong>on</strong> or<br />
<strong>in</strong>dustrialisati<strong>on</strong> per se may have been at work.<br />
Table 3.2a and Maps 3.2a and 3.2b present<br />
<strong>the</strong> distributi<strong>on</strong> <strong>of</strong> <strong>State</strong>s by category <strong>of</strong> <strong>in</strong>security<br />
with respect to earn<strong>in</strong>gs from work.<br />
URBAN FOOD INSECURITY ACROSS STATES 63<br />
In terms <strong>of</strong> this <strong>in</strong>dicator, Kerala has emerged<br />
as <strong>the</strong> most <strong>in</strong>secure <strong>State</strong> while Maharashtra<br />
showed <strong>the</strong> highest proporti<strong>on</strong> <strong>of</strong> regularly<br />
employed <strong>in</strong> 1999-2000 but was sec<strong>on</strong>d beh<strong>in</strong>d<br />
Gujarat <strong>in</strong> 2004-05 <strong>in</strong> this respect. However, with<br />
a general <strong>in</strong>crease <strong>in</strong> <strong>the</strong> proporti<strong>on</strong> <strong>of</strong> workers<br />
not regularly employed, n<strong>on</strong>e <strong>of</strong> <strong>the</strong> <strong>State</strong>s figured<br />
<strong>in</strong> <strong>the</strong> least <strong>in</strong>secure category. Most <strong>State</strong>s have<br />
reta<strong>in</strong>ed <strong>the</strong> same <strong>in</strong>security status <strong>in</strong> both periods.<br />
Maharashtra and Orissa moved down a category<br />
while <strong>the</strong> Punjab and Assam moved up a category.<br />
Gujarat improved c<strong>on</strong>siderably, ris<strong>in</strong>g two<br />
categories higher <strong>in</strong> 2004-05.<br />
3.4.3 Share <strong>of</strong> <strong>Urban</strong> Female Workers<br />
Not Regularly Employed<br />
Table 3.3 presents <strong>the</strong> number <strong>of</strong> urban<br />
female workers per 1000 not regularly employed<br />
<strong>in</strong> <strong>the</strong> two periods.<br />
Unlike <strong>in</strong> <strong>the</strong> case <strong>of</strong> urban male workers,<br />
<strong>the</strong>re has been <strong>in</strong> fact an <strong>in</strong>crease from 333 to<br />
356 <strong>in</strong> <strong>the</strong> number <strong>of</strong> females regularly employed<br />
between 1999-2000 and 2004-05 at <strong>the</strong> all-<strong>India</strong><br />
level. Similarly, 10 <strong>State</strong>s reported a decl<strong>in</strong>e <strong>in</strong><br />
<strong>the</strong> number <strong>of</strong> urban female workers who are not<br />
Table 3.2a<br />
Distributi<strong>on</strong> <strong>of</strong> <strong>State</strong>s by Earn<strong>in</strong>gs <strong>Insecurity</strong> am<strong>on</strong>g <strong>Urban</strong> Male Workers, 1999-2000 and 2004-05<br />
Number <strong>of</strong> Male Workers Not <strong>in</strong><br />
Regular Employment (per 1000)<br />
1999-2000 2004-05<br />
460 - 517.6 (Very Low <strong>Insecurity</strong>) MA –<br />
517.6 - 575.2 (Low <strong>Insecurity</strong>) HA , TN HA, TN, AS, GU, MA, PU<br />
575.2 - 632.8 (Moderate <strong>Insecurity</strong>)<br />
AP, KA, MP, RA,<br />
WB, AS, OR, PU<br />
AP, KA, MP, RA, WB<br />
632.8 - 690.4 (High <strong>Insecurity</strong>) BI, UP, GU BI, UP, OR<br />
690.4 - 748 (Very High <strong>Insecurity</strong>) KE KE
64 REPORT ON THE STATE OF FOOD INSECURITY IN URBAN INDIA<br />
regularly employed. Only West Bengal reported<br />
a significant <strong>in</strong>crease. Four o<strong>the</strong>r <strong>State</strong>s – Andhra<br />
Pradesh, Assam, Bihar and Haryana – all showed<br />
<strong>on</strong>ly small changes. Several <strong>State</strong>s show large<br />
<strong>in</strong>creases <strong>in</strong> <strong>the</strong> proporti<strong>on</strong> <strong>of</strong> urban female workers<br />
who are regularly employed, but most <strong>of</strong> <strong>the</strong>se are<br />
<strong>in</strong>terest<strong>in</strong>gly, relatively less urbanised <strong>State</strong>s like<br />
Madhya Pradesh, Uttar Pradesh and Orissa as well<br />
as <strong>the</strong> more urbanised Gujarat, Karnataka and <strong>the</strong><br />
Punjab have exhibited a significant <strong>in</strong>crease <strong>in</strong><br />
<strong>the</strong> proporti<strong>on</strong> <strong>of</strong> urban female workers regularly<br />
employed. Kerala too showed a large <strong>in</strong>crease,<br />
while <strong>the</strong>re was little change <strong>in</strong> Tamil Nadu <strong>on</strong>ce<br />
aga<strong>in</strong>.<br />
Table 3.3a and Maps 3.3a and 3.3b show <strong>the</strong><br />
distributi<strong>on</strong> <strong>of</strong> <strong>State</strong>s by <strong>the</strong> degree <strong>of</strong> <strong>in</strong>security<br />
based <strong>on</strong> <strong>the</strong> <strong>in</strong>dicator <strong>of</strong> proporti<strong>on</strong> <strong>of</strong> urban<br />
female workers not regularly employed. A general<br />
decl<strong>in</strong>e <strong>in</strong> <strong>in</strong>security <strong>in</strong> terms <strong>of</strong> this <strong>in</strong>dicator is<br />
evident.<br />
Rajasthan, Gujarat, Bihar, Andhra Pradesh,<br />
Tamil Nadu, Karnataka, Maharashtra, West<br />
Bengal and Assam rema<strong>in</strong>ed <strong>in</strong> <strong>the</strong> same <strong>in</strong>security<br />
category <strong>in</strong> both periods, while <strong>the</strong> Punjab, Kerala,<br />
Uttar Pradesh, Orissa and Madhya Pradesh<br />
decl<strong>in</strong>ed <strong>in</strong> <strong>in</strong>security. Only Haryana moved <strong>in</strong> <strong>the</strong><br />
opposite directi<strong>on</strong>.<br />
Table 3.3<br />
Number Per 1000 <strong>Urban</strong> Female Workers Not Regularly Employed, 1999-2000 and 2004-05<br />
Sl.<br />
No.<br />
Number per 1000 Female Workers who are<br />
Not Regularly Employed<br />
<strong>State</strong>s<br />
1999-2000 2004-05<br />
1 Andhra Pradesh 715 700<br />
2 Assam 444 455<br />
3 Bihar 748 750<br />
4 Gujarat 736 697<br />
5 Haryana 670 680<br />
6 Karnataka 674 629<br />
7 Kerala 681 619<br />
8 Madhya Pradesh 828 672<br />
9 Maharastra 590 562<br />
10 Orissa 788 648<br />
11 Punjab 566 486<br />
12 Rajasthan 791 814<br />
13 Tamil Nadu 593 588<br />
14 Uttar Pradesh 743 670<br />
15 West Bengal 599 633<br />
<strong>India</strong> 667 644<br />
Source: NSSO 2001a; NSSO 2006
Number per 1000 <strong>Urban</strong> Male Workers not <strong>in</strong> Regular Employment<br />
(1999-2000)
Number per 1000 <strong>Urban</strong> Male Workers not <strong>in</strong> Regular Employment<br />
(2004-05)
3.4.4 Percentage <strong>of</strong> <strong>Urban</strong> Households<br />
without Access to Safe Dr<strong>in</strong>k<strong>in</strong>g Water<br />
Table 3.4 shows <strong>the</strong> percentage <strong>of</strong> urban<br />
households without access to safe dr<strong>in</strong>k<strong>in</strong>g water<br />
<strong>in</strong> 1999-2000 and 2004-05. NFHS data has been<br />
URBAN FOOD INSECURITY ACROSS STATES 65<br />
Table 3.3a<br />
Distributi<strong>on</strong> <strong>of</strong> <strong>State</strong>s by Earn<strong>in</strong>gs <strong>Insecurity</strong> am<strong>on</strong>g <strong>Urban</strong> Female Workers, 1999-2000 and 2004-05<br />
Number <strong>of</strong> Female Workers (per 1000)<br />
Not <strong>in</strong> Regular Employment<br />
1999-2000 2004-05<br />
444 - 520.8 (Very Low <strong>Insecurity</strong>) AS AS, PU<br />
520.8 - 597.6 (Low <strong>Insecurity</strong>) MA, TN, PU MA, TN<br />
597.6 - 674.4 (Moderate <strong>Insecurity</strong>) KA, WB, HA KA, WB, KE, MP, OR, UP<br />
674.4 - 751.2 (High <strong>Insecurity</strong>) AP, BI, GU, KE, UP AP, BI, GU, HA<br />
751.2 - 828 (Very High <strong>Insecurity</strong>) RA, MP, OR RA<br />
used for a comparis<strong>on</strong> <strong>of</strong> <strong>the</strong> situati<strong>on</strong> <strong>in</strong> <strong>the</strong> two<br />
periods. On closer exam<strong>in</strong>ati<strong>on</strong>, <strong>the</strong> def<strong>in</strong>iti<strong>on</strong>al<br />
differences between NFHS 2 and NFHS 3 earlier<br />
noted with regard to this <strong>in</strong>dicator do not appear to<br />
affect <strong>the</strong> comparis<strong>on</strong> significantly.<br />
Table 3.4<br />
Percentage <strong>of</strong> <strong>Urban</strong> Households Without Access to Safe Dr<strong>in</strong>k<strong>in</strong>g Water, 1998-99 and 2005-06<br />
Sl.<br />
No.<br />
<strong>State</strong>s<br />
Percentage <strong>of</strong> Households Without Access to SDW<br />
1998-99 2005-06<br />
1 Andhra Pradesh 4.6 3.6<br />
2 Assam 17.4 21.8<br />
3 Bihar 15.0 12.3<br />
4 Gujarat 4.1 4.1<br />
5 Haryana 0.5 1.4<br />
6 Karnataka 3.9 14.4<br />
7 Kerala 60.2 52.0<br />
8 Madhya Pradesh 9.0 8.5<br />
9 Maharashtra 3.0 1.5<br />
10 Orissa 19.0 21.2<br />
11 Punjab 0.2 0.4<br />
12 Rajasthan 4.5 2.4<br />
13 Tamil Nadu 11.4 11.8<br />
14 Uttar Pradesh 1.9 2.0<br />
15 West Bengal 7.8 3.6<br />
<strong>India</strong> 7.4 7.7<br />
Source: NFHS 2000; NFHS 2007
66 REPORT ON THE STATE OF FOOD INSECURITY IN URBAN INDIA<br />
Seven <strong>State</strong>s showed improvement while<br />
<strong>the</strong> o<strong>the</strong>r 8 marg<strong>in</strong>ally worsened, for <strong>the</strong> most<br />
part. The all-<strong>India</strong> figure did not change much.<br />
Kerala significantly improved while Karnataka<br />
equally significantly deteriorated. In <strong>the</strong> o<strong>the</strong>r<br />
<strong>State</strong>s, <strong>the</strong> changes were marg<strong>in</strong>al. A po<strong>in</strong>t<br />
that needs to be made about <strong>the</strong> figure for Kerala<br />
is that if <strong>on</strong>e were to <strong>in</strong>clude “o<strong>the</strong>r improved<br />
sources” <strong>of</strong> dr<strong>in</strong>k<strong>in</strong>g water (ma<strong>in</strong>ly referr<strong>in</strong>g to<br />
boil<strong>in</strong>g <strong>of</strong> water), <strong>the</strong> percentage <strong>of</strong> households<br />
without access to safe dr<strong>in</strong>k<strong>in</strong>g water decl<strong>in</strong>ed<br />
to 22.7.<br />
Table 3.4a and Maps 3.4a and 3.4b show<br />
<strong>the</strong> distributi<strong>on</strong> <strong>of</strong> <strong>the</strong> <strong>State</strong>s by <strong>the</strong>ir level <strong>of</strong><br />
<strong>in</strong>security with respect to access to safe dr<strong>in</strong>k<strong>in</strong>g<br />
water. There is <strong>on</strong>ly <strong>on</strong>e change between <strong>the</strong> two<br />
periods: Karnataka has moved <strong>in</strong>to a category<br />
<strong>of</strong> greater <strong>in</strong>security <strong>in</strong> 2005-06 as compared to<br />
1998-99 21 .<br />
3.4.5 Percentage <strong>of</strong> Households without<br />
Access to a Toilet<br />
Table 3.5 presents data <strong>on</strong> <strong>the</strong> positi<strong>on</strong> <strong>of</strong><br />
various <strong>State</strong>s with regard to <strong>the</strong> proporti<strong>on</strong> <strong>of</strong> urban<br />
households without access to a toilet facility.<br />
In general, <strong>the</strong>re is an improvement <strong>in</strong><br />
<strong>the</strong> situati<strong>on</strong> with respect to access to toilets as<br />
measured by this <strong>in</strong>dicator over <strong>the</strong> period 1998-<br />
99 and 2005-06. The proporti<strong>on</strong> <strong>of</strong> households<br />
without access to toilets has decl<strong>in</strong>ed <strong>in</strong> 13 <strong>State</strong>s.<br />
The <strong>on</strong>ly two <strong>State</strong>s where it has <strong>in</strong>creased are<br />
Tamil Nadu and West Bengal, but <strong>the</strong> <strong>in</strong>creases<br />
have been marg<strong>in</strong>al. However, <strong>the</strong> improvement <strong>in</strong><br />
most <strong>of</strong> <strong>the</strong> o<strong>the</strong>r <strong>State</strong>s has also been modest, not<br />
dramatic, except for Gujarat where <strong>the</strong> proporti<strong>on</strong><br />
without access to toilets has decl<strong>in</strong>ed by nearly<br />
50 per cent. Bihar, Haryana and Rajasthan also<br />
showed significant improvement. The decl<strong>in</strong>e at<br />
<strong>the</strong> all-<strong>India</strong> level has been modest 22 .<br />
Table 3.4a<br />
<strong>State</strong>s by Level <strong>of</strong> <strong>Insecurity</strong> with regard to Access to Safe Dr<strong>in</strong>k<strong>in</strong>g Water, 1998-99 and 2005-06<br />
Percentage <strong>of</strong> Households<br />
without Access to SDW<br />
0 - 12.2 (Very Low <strong>Insecurity</strong>)<br />
1998-99 2005-06<br />
AP, GU, HA, KA, MA, MP,<br />
PU, RA, TN, UP, WB<br />
AP, GU, HA, MA, MP, PU,<br />
RA, TN, UP, WB<br />
12.2 - 24.4 (Low <strong>Insecurity</strong>) AS, BI, OR AS, BI, OR, KA<br />
24.4 - 36.6 (Moderate <strong>Insecurity</strong>) – –<br />
36.6 - 48.8 (High <strong>Insecurity</strong>) – –<br />
48.8 - 61 (Very High <strong>Insecurity</strong>) KE KE<br />
21 Though Kerala is categorised here as most <strong>in</strong>secure, <strong>the</strong> practice <strong>of</strong> boil<strong>in</strong>g water that prevails <strong>in</strong> Kerala makes a big difference, render<strong>in</strong>g<br />
<strong>the</strong> categorisati<strong>on</strong> somewhat mislead<strong>in</strong>g.<br />
22 It needs to be stressed that <strong>the</strong> mere availability <strong>of</strong> a toilet may not imply safe disposal <strong>of</strong> human excreta with corresp<strong>on</strong>d<strong>in</strong>g implicati<strong>on</strong>s<br />
for improv<strong>in</strong>g hygiene.
Number per 1000 <strong>Urban</strong> Female Workers not <strong>in</strong> Regular Employment<br />
(1999-2000)
Number per 1000 <strong>Urban</strong> Female Workers not <strong>in</strong> Regular Employment<br />
(2004-05)
Percentage <strong>of</strong> <strong>Urban</strong> Households without Access to Safe Dr<strong>in</strong>k<strong>in</strong>g Water<br />
(1998-99)
Percentage <strong>of</strong> <strong>Urban</strong> Households without Access to Safe Dr<strong>in</strong>k<strong>in</strong>g Water<br />
(2005-06)
Table 3.5a and Maps 3.5a and 3.5b<br />
illustrate <strong>the</strong> distributi<strong>on</strong> <strong>of</strong> <strong>the</strong> <strong>State</strong>s by <strong>the</strong><br />
category <strong>of</strong> <strong>in</strong>security with respect to access to<br />
toilets. Though most <strong>State</strong>s rema<strong>in</strong>ed <strong>in</strong> <strong>the</strong> same<br />
URBAN FOOD INSECURITY ACROSS STATES 67<br />
category <strong>in</strong> 2005-06 that <strong>the</strong>y were <strong>in</strong> 1998-99,<br />
Gujarat, Rajasthan, Karnataka, Andhra Pradesh<br />
and Orissa, however, have all moved to <strong>the</strong> next<br />
less <strong>in</strong>secure category.<br />
Table 3.5<br />
Percentage <strong>of</strong> <strong>Urban</strong> Households without Access to Toilet Facilities, 1998-99 and 2005-06<br />
Sl.<br />
No.<br />
<strong>State</strong>s<br />
Percentage <strong>of</strong> Households with No Toilet Facility<br />
1998-99 2005-06<br />
1 Andhra Pradesh 28.1 24.3<br />
2 Assam 5.1 2.5<br />
3 Bihar 33.5 26.5<br />
4 Gujarat 23.1 11.7<br />
5 Haryana 17.9 10.8<br />
6 Karnataka 19.0 17.0<br />
7 Kerala 6.8 1.6<br />
8 Madhya Pradesh 35.2 31.2<br />
9 Maharashtra 13.6 12.1<br />
10 Orissa 45.0 40.9<br />
11 Punjab 7.1 6.3<br />
12 Rajasthan 22.9 14.7<br />
13 Tamil Nadu 25.3 26.5<br />
14 Uttar Pradesh 16.5 10.6<br />
15 West Bengal 8.6 9.5<br />
<strong>India</strong> 19.3 16.8<br />
Source: NFHS 2000; NFHS 2007<br />
Table 3.5a<br />
<strong>State</strong>s by Level <strong>of</strong> <strong>Insecurity</strong> with regard to Access to Toilets, 1998-99 and 2005-06<br />
Percentage <strong>of</strong> Households<br />
with No Toilet Facility<br />
1998-99 2005-06<br />
1 - 9.8 (Very Low <strong>Insecurity</strong>) AS, KE, PU, WB AS, KE, PU, WB<br />
9.8 - 18.6 (Low <strong>Insecurity</strong>) HA, MA, UP<br />
HA, MA, UP, GU,<br />
KA, RA<br />
18.6 - 27.4 (Moderate <strong>Insecurity</strong>) TN, GU, KA, RA TN, AP, BI<br />
27.4 - 36.2 (High <strong>Insecurity</strong>) MP, AP, BI MP<br />
36.2 - 45 (Very High <strong>Insecurity</strong>) OR OR
68 REPORT ON THE STATE OF FOOD INSECURITY IN URBAN INDIA<br />
So far <strong>the</strong> discussi<strong>on</strong> has been <strong>on</strong> <strong>in</strong>put<br />
<strong>in</strong>dicators, <strong>of</strong> which <strong>the</strong> first three related to <strong>the</strong><br />
access dimensi<strong>on</strong> <strong>of</strong> food security and <strong>the</strong> last two<br />
to <strong>the</strong> absorpti<strong>on</strong> dimensi<strong>on</strong>. Now, a set <strong>of</strong> outcome<br />
<strong>in</strong>dicators that reflect <strong>the</strong> outcome <strong>of</strong> both access<br />
and absorpti<strong>on</strong> aspects are explored.<br />
3.4.6 Percentage <strong>of</strong> <strong>Urban</strong> Women with<br />
Anaemia<br />
Table 3.6 presents <strong>the</strong> data <strong>on</strong> <strong>the</strong> percentage<br />
<strong>of</strong> urban women aged 15 to 49 years with anaemia.<br />
There has been a rise <strong>of</strong> over 5 percentage po<strong>in</strong>ts<br />
<strong>in</strong> <strong>the</strong> proporti<strong>on</strong> <strong>of</strong> urban women with anaemia<br />
for <strong>the</strong> country as a whole. Only <strong>on</strong>e <strong>State</strong>, Assam,<br />
showed a (marg<strong>in</strong>al) decl<strong>in</strong>e. The rise has been<br />
especially steep <strong>in</strong> Andhra Pradesh, Gujarat,<br />
Haryana, Karnataka and Kerala. Despite <strong>the</strong> large<br />
<strong>in</strong>crease, however, Kerala depicted <strong>the</strong> lowest<br />
<strong>in</strong>cidence <strong>of</strong> anaemia am<strong>on</strong>g all <strong>the</strong> <strong>State</strong>s, with<br />
<strong>the</strong> Punjab be<strong>in</strong>g <strong>the</strong> next best. It is a matter <strong>of</strong><br />
great c<strong>on</strong>cern that <strong>the</strong> <strong>in</strong>cidence <strong>of</strong> anaemia<br />
am<strong>on</strong>g women <strong>in</strong> <strong>the</strong> reproductive age group is<br />
c<strong>on</strong>siderably more than 50 per cent <strong>in</strong> 5 <strong>State</strong>s and<br />
hovers around 50 per cent <strong>in</strong> 7 o<strong>the</strong>r <strong>State</strong>s.<br />
Table 3.6a and Maps 3.6a and 3.6b portray<br />
<strong>the</strong> distributi<strong>on</strong> <strong>of</strong> <strong>State</strong>s by <strong>the</strong>ir level <strong>of</strong> <strong>in</strong>security<br />
with respect to <strong>the</strong> <strong>in</strong>cidence <strong>of</strong> anaemia am<strong>on</strong>g<br />
urban women. The Table br<strong>in</strong>gs out <strong>the</strong> general<br />
worsen<strong>in</strong>g <strong>in</strong> <strong>the</strong> situati<strong>on</strong> between 1998-99 and<br />
2005-06. Bihar, <strong>the</strong> Punjab, Maharashtra, Madhya<br />
Pradesh, Rajasthan, Tamil Nadu, Orissa and Assam<br />
showed no change <strong>in</strong> <strong>the</strong> category <strong>of</strong> <strong>in</strong>security <strong>in</strong><br />
which <strong>the</strong>y have figured. The rema<strong>in</strong><strong>in</strong>g <strong>State</strong>s all<br />
moved to a category <strong>of</strong> greater <strong>in</strong>security.<br />
Table 3.6<br />
Percentage <strong>of</strong> <strong>Urban</strong> Women (15-49 years) with Anaemia, 1998-99 and 2005-06<br />
Sl.<br />
No.<br />
<strong>State</strong>s<br />
Percentage <strong>of</strong> <strong>Urban</strong> Women (15-49 years) with Anaemia<br />
1998-99 2005-06<br />
1 Andhra Pradesh 47.4 59.7<br />
2 Assam 67.2 65.9<br />
3 Bihar 59.6 61.2<br />
4 Gujarat 39.5 50.9<br />
5 Haryana 45.8 55.2<br />
6 Karnataka 35.7 48.3<br />
7 Kerala 20.4 34.1<br />
8 Madhya Pradesh 46.2 48.0<br />
9 Maharashtra 44.8 46.0<br />
10 Orissa 54.8 55.9<br />
11 Punjab 39.0 39.1<br />
12 Rajasthan 46.7 48.0<br />
13 Tamil Nadu 51.6 52.0<br />
14 Uttar Pradesh 46.0 49.6<br />
15 West Bengal 57.8 59.4<br />
<strong>India</strong> 45.7 50.9<br />
Source: NFHS 2000; NFHS 2007
Percentage <strong>of</strong> <strong>Urban</strong> Households without Access to Toilets<br />
(1998-99)<br />
JK
Percentage <strong>of</strong> <strong>Urban</strong> Households without Access to Toilets<br />
(2005-06)
Percentage <strong>of</strong> Ever-married <strong>Urban</strong> Women with Any Anaemia<br />
(1998-99)
Percentage <strong>of</strong> Ever-married <strong>Urban</strong> Women with Any Anaemia<br />
(2005-06)
3.4.7 Percentage <strong>of</strong> <strong>Urban</strong> Women with<br />
Chr<strong>on</strong>ic Energy Deficiency<br />
Table 3.7 presents <strong>the</strong> situati<strong>on</strong> with regard<br />
to ano<strong>the</strong>r outcome <strong>in</strong>dicator <strong>of</strong> food <strong>in</strong>security that<br />
URBAN FOOD INSECURITY ACROSS STATES 69<br />
is also gender sensitive, namely, <strong>the</strong> percentage <strong>of</strong><br />
women with chr<strong>on</strong>ic energy deficiency.<br />
In this respect, <strong>the</strong>re has been deteriorati<strong>on</strong><br />
between 1998-99 and 2005-06 for <strong>India</strong> as a whole,<br />
Table 3.6a<br />
Distributi<strong>on</strong> <strong>of</strong> <strong>State</strong>s by Level <strong>of</strong> <strong>Insecurity</strong> <strong>in</strong> terms <strong>of</strong> Incidence <strong>of</strong><br />
Women with Anaemia, 1998-99 and 2005-06<br />
Percentage <strong>of</strong> Women with Anaemia 1998-99 2005-06<br />
20 - 29.6 (Very Low <strong>Insecurity</strong>) KE –<br />
29.6 - 39.2 (Low <strong>Insecurity</strong>) PU, KA PU, KE<br />
39.2 - 48.8 (Moderate <strong>Insecurity</strong>) MA, MP, RA, AP, GU, HA, UP MA, MP, RA, KA<br />
48.8 - 58.4 (High <strong>Insecurity</strong>) OR, TN, WB OR, TN, GU, HA, UP<br />
58.4 - 68 (Very High <strong>Insecurity</strong>) AS, BI AS, BI, AP, WB<br />
Table 3.7<br />
Percentage <strong>of</strong> <strong>Urban</strong> Women (15-49 years) with Chr<strong>on</strong>ic Energy Deficiency, 1998-99 and 2005-06<br />
Sl.<br />
No.<br />
<strong>State</strong>s<br />
Percentage <strong>of</strong> <strong>Urban</strong> Women with CED<br />
1998-99 2005-06<br />
1 Andhra Pradesh 19.7 22.1<br />
2 Assam 18.8 26.4<br />
3 Bihar 31.1 30.5<br />
4 Gujarat 22.8 24.6<br />
5 Haryana 13.7 20.6<br />
6 Karnataka 23.8 26.3<br />
7 Kerala 14.7 15.2<br />
8 Madhya Pradesh 28.2 30.7<br />
9 Maharashtra 26.2 26.6<br />
10 Orissa 32.9 28.6<br />
11 Punjab 9.2 17.2<br />
12 Rajasthan 28.5 30.9<br />
13 Tamil Nadu 17.5 22.8<br />
14 Uttar Pradesh 23.3 22.9<br />
15 West Bengal 24.5 23.3<br />
<strong>India</strong> 22.6 25.0<br />
Source: NFHS 2000; NFHS 2007
70 REPORT ON THE STATE OF FOOD INSECURITY IN URBAN INDIA<br />
Table 3.7a<br />
<strong>State</strong>s by Level <strong>of</strong> <strong>Insecurity</strong> <strong>in</strong> terms <strong>of</strong> CED am<strong>on</strong>g <strong>Urban</strong> Women, 1998-99 and 2005-06<br />
Percentage <strong>of</strong> CED am<strong>on</strong>g<br />
<strong>Urban</strong> Women<br />
1998-99 2005-06<br />
9 - 13.8 (Very Low <strong>Insecurity</strong>) PU, HA –<br />
13.8 - 18.6 (Low <strong>Insecurity</strong>) KE, TN KE, PU<br />
18.6 - 23.4 (Moderate <strong>Insecurity</strong>) AP, AS, GU, UP AP, HA, TN, UP, WB<br />
23.4 - 28.2 (High <strong>Insecurity</strong>) KA, MA, MP, WB KA, MA, AS, GU<br />
28.2 - 33 (Very High <strong>Insecurity</strong>) BI, OR, RA BI, OR, RA, MP<br />
with <strong>the</strong> percentage <strong>of</strong> women with CED <strong>in</strong>creas<strong>in</strong>g<br />
from 22.6 per cent to 25 per cent. Eleven <strong>State</strong>s<br />
showed an <strong>in</strong>crease <strong>in</strong> <strong>the</strong> percentage too, with <strong>the</strong><br />
situati<strong>on</strong> <strong>in</strong> 3 – <strong>the</strong> Punjab, Haryana and Assam –<br />
c<strong>on</strong>siderably worse. Bihar, Orissa, Uttar Pradesh<br />
and West Bengal marg<strong>in</strong>ally improved. All <strong>the</strong><br />
o<strong>the</strong>r <strong>State</strong>s performed more poorly <strong>in</strong> 2005-06<br />
than <strong>in</strong> 1998-99.<br />
In absolute terms, Kerala was <strong>the</strong> best<br />
performer <strong>in</strong> 2005-06 and Punjab <strong>in</strong> 1998-99.<br />
The <strong>State</strong>s which reported a higher percentage <strong>of</strong><br />
urban women with CED than <strong>the</strong> country average<br />
<strong>in</strong> 2005-06 <strong>in</strong>cluded Assam, Bihar, Karnataka,<br />
Madhya Pradesh, Maharashtra, Orissa and<br />
Rajasthan.<br />
The distributi<strong>on</strong> <strong>of</strong> <strong>State</strong>s by category <strong>of</strong><br />
food <strong>in</strong>security <strong>in</strong> 1998-99 and 2005-06 as<br />
measured by <strong>the</strong> percentage <strong>of</strong> urban women<br />
with CED is presented <strong>in</strong> Table 3.7a and<br />
Maps 3.7a and 3.7b.<br />
There has been a worsen<strong>in</strong>g <strong>in</strong> <strong>the</strong> sense<br />
that 4 <strong>State</strong>s – Madhya Pradesh, Assam, Haryana,<br />
and <strong>the</strong> Punjab – have moved to higher <strong>in</strong>security<br />
categories over this period, with <strong>the</strong> situati<strong>on</strong> be<strong>in</strong>g<br />
quite severe <strong>in</strong> <strong>the</strong> last three. Improvement, where<br />
it has occurred, has been marg<strong>in</strong>al.<br />
3.4.8 Percentage <strong>of</strong> <strong>Urban</strong> Children with<br />
Anaemia<br />
Table 3.8 presents <strong>the</strong> data <strong>on</strong> <strong>the</strong><br />
percentage <strong>of</strong> urban children with anaemia.<br />
The percentage <strong>of</strong> children with anaemia for<br />
urban <strong>India</strong> as a whole has <strong>in</strong>creased marg<strong>in</strong>ally<br />
between 1998-99 and 2005-06, from an already<br />
high level <strong>of</strong> 70.8 per cent to 72.2 per cent.<br />
Seven <strong>State</strong>s reported a decl<strong>in</strong>e while <strong>the</strong> rest<br />
reported a rise <strong>in</strong> <strong>the</strong> <strong>in</strong>cidence <strong>of</strong> anaemia am<strong>on</strong>g<br />
urban children between 1998-99 and 2005-06.<br />
In every s<strong>in</strong>gle <strong>State</strong>, more than half <strong>the</strong> children<br />
were anaemic <strong>in</strong> 2005-06. Assam and Karnataka<br />
showed an alarm<strong>in</strong>g rise while <strong>in</strong> Bihar <strong>the</strong>re was<br />
an impressive decl<strong>in</strong>e. Overall, however, anaemia<br />
rates am<strong>on</strong>g urban children rema<strong>in</strong>ed unacceptably<br />
high.<br />
Table 3.8a and Maps 3.8a and 3.8b<br />
present <strong>the</strong> distributi<strong>on</strong> <strong>of</strong> <strong>State</strong>s by <strong>the</strong> category<br />
<strong>of</strong> <strong>in</strong>security with respect to <strong>the</strong> <strong>in</strong>dicator <strong>of</strong><br />
percentage <strong>of</strong> anaemia am<strong>on</strong>g urban children <strong>in</strong><br />
<strong>the</strong> age group <strong>of</strong> 6-35 m<strong>on</strong>ths.<br />
Bihar has moved up from be<strong>in</strong>g highly<br />
<strong>in</strong>secure <strong>in</strong> 1998-99 to be<strong>in</strong>g moderately <strong>in</strong>secure<br />
<strong>in</strong> 2005-06. The o<strong>the</strong>r <strong>State</strong>s to have moved to<br />
a less <strong>in</strong>secure category between 1998-99 and
Percentage <strong>of</strong> <strong>Urban</strong> Children (6-35 m<strong>on</strong>ths) with Any Anaemia<br />
(1998-99)
Percentage <strong>of</strong> <strong>Urban</strong> Children (6-35 m<strong>on</strong>ths) with Any Anaemia<br />
(2005-06)
2005-06 were West Bengal, Maharashtra and<br />
Rajasthan, each by <strong>on</strong>e category. At <strong>the</strong> o<strong>the</strong>r end,<br />
Assam and Karnataka moved down two notches<br />
<strong>in</strong> 2005-06. Kerala, Orissa, Madhya Pradesh,<br />
Uttar Pradesh and Haryana rema<strong>in</strong>ed <strong>in</strong> <strong>the</strong> same<br />
respective category. All <strong>the</strong> o<strong>the</strong>r <strong>State</strong>s moved<br />
down a level to a more <strong>in</strong>secure category.<br />
URBAN FOOD INSECURITY ACROSS STATES 71<br />
Table 3.8<br />
Percentage <strong>of</strong> <strong>Urban</strong> Children (6-35 m<strong>on</strong>ths) with Anaemia, 1998-99 and 2005-06<br />
Sl.<br />
No.<br />
<strong>State</strong>s<br />
Percentage <strong>of</strong> Children with Anaemia<br />
1998-99 2005-06<br />
1 Andhra Pradesh 69.5 73.5<br />
2 Assam 52.3 70.4<br />
3 Bihar 80.7 69.1<br />
4 Gujarat 67.9 73.8<br />
5 Haryana 86.6 79.8<br />
6 Karnataka 66.3 81.6<br />
7 Kerala 46.8 53.2<br />
8 Madhya Pradesh 73.7 75.4<br />
9 Maharashtra 72.8 65.7<br />
10 Orissa 68.3 63.2<br />
11 Punjab 77.2 80.5<br />
12 Rajasthan 81.3 78.5<br />
13 Tamil Nadu 66.2 74.2<br />
14 Uttar Pradesh 74.1 73.5<br />
15 West Bengal 64.1 58.2<br />
<strong>India</strong> 70.8 72.2<br />
Source: NFHS 2000; NFHS 2007<br />
Table 3.8a<br />
Distributi<strong>on</strong> <strong>of</strong> <strong>State</strong>s by Category <strong>of</strong> <strong>Insecurity</strong> <strong>in</strong> terms <strong>of</strong> Children with Anaemia, 1998-99 and 2005-06<br />
Percentage <strong>of</strong> Children with Anaemia 1998-99 2005-06<br />
46 - 54.2 (Very Low <strong>Insecurity</strong>) KE, AS KE<br />
54.2 - 62.4 (Low <strong>Insecurity</strong>) – WB<br />
62.4 - 70.6 (Moderate <strong>Insecurity</strong>) OR, AP, GU, KA, TN, WB OR, AS, BI, MA<br />
70.6 - 78.8 (High <strong>Insecurity</strong>) MP, UP, MA, PU MP, UP, AP, GU, RA, TN<br />
78.8 - 87 (Very High <strong>Insecurity</strong>) HA, BI, RA HA, KA, PU<br />
3.4.9 Percentage <strong>of</strong> <strong>Urban</strong> Children<br />
Stunted<br />
Table 3.9 presents data for <strong>the</strong> years1998-99<br />
and 2005-06 <strong>on</strong> <strong>the</strong> percentage <strong>of</strong> urban children<br />
<strong>in</strong> <strong>the</strong> age group <strong>of</strong> six to thirty-five m<strong>on</strong>ths who<br />
were stunted.
72 REPORT ON THE STATE OF FOOD INSECURITY IN URBAN INDIA<br />
Table 3.9<br />
Percentage <strong>of</strong> <strong>Urban</strong> Children (6-35 m<strong>on</strong>ths) who are Stunted, 1998-99 and 2005-06<br />
Sl.<br />
No.<br />
<strong>State</strong>s<br />
Percentage <strong>of</strong> Children who are Stunted<br />
1998-99 2005-06<br />
1 Andhra Pradesh 29.7 33.2<br />
2 Assam 37.1 35.3<br />
3 Bihar 42.2 38.2<br />
4 Gujarat 38.5 42.4<br />
5 Haryana 40.3 36.1<br />
6 Karnataka 30.9 33.9<br />
7 Kerala 18.5 27.3<br />
8 Madhya Pradesh 39.8 41.1<br />
9 Maharashtra 33.3 40.0<br />
10 Orissa 37.0 36.0<br />
11 Punjab 29.4 32.9<br />
12 Rajasthan 44.0 29.4<br />
13 Tamil Nadu 27.1 30.1<br />
14 Uttar Pradesh 46.7 33.1<br />
15 West Bengal 25.5 29.6<br />
<strong>India</strong> 35.6 37.4<br />
Source: NFHS 2000; NFHS 2007<br />
As with anaemia am<strong>on</strong>g children, <strong>the</strong>re was<br />
a slight deteriorati<strong>on</strong> between 1998-99 and 2005-<br />
06 at <strong>the</strong> all-<strong>India</strong> level <strong>in</strong> terms <strong>of</strong> <strong>the</strong> <strong>in</strong>cidence <strong>of</strong><br />
stunt<strong>in</strong>g am<strong>on</strong>g urban children. N<strong>in</strong>e <strong>State</strong>s showed<br />
a worsen<strong>in</strong>g while six improved. Kerala suffered<br />
a major deteriorati<strong>on</strong> <strong>in</strong> 2005-06 compared to its<br />
positi<strong>on</strong> <strong>in</strong> 1998-99, but still reta<strong>in</strong>ed its positi<strong>on</strong><br />
as <strong>the</strong> best performer. Maharashtra also showed<br />
a large <strong>in</strong>crease <strong>in</strong> <strong>the</strong> percentage <strong>of</strong> children<br />
stunted, but Rajasthan and Uttar Pradesh improved<br />
dramatically. In <strong>the</strong> case <strong>of</strong> all <strong>the</strong> o<strong>the</strong>r <strong>State</strong>s,<br />
<strong>the</strong> changes have been small, though a general<br />
worsen<strong>in</strong>g is evident.<br />
Table 3.9a and Maps 3.9a and 3.9b<br />
describe <strong>the</strong> distributi<strong>on</strong> <strong>of</strong> <strong>State</strong>s by category <strong>of</strong><br />
<strong>in</strong>security <strong>in</strong> terms <strong>of</strong> child stunt<strong>in</strong>g.<br />
Kerala moved down a category as did Tamil<br />
Nadu, <strong>the</strong> Punjab, Maharashtra and Gujarat. By<br />
c<strong>on</strong>trast, Rajasthan transformed from be<strong>in</strong>g a very<br />
highly <strong>in</strong>secure <strong>State</strong> <strong>in</strong> 1998-99 to a low <strong>in</strong>security<br />
status <strong>in</strong> 2005-06. Uttar Pradesh too did well to<br />
move from a very highly <strong>in</strong>secure status to <strong>on</strong>e <strong>of</strong><br />
moderate <strong>in</strong>security. Bihar and Assam shifted up a<br />
notch while West Bengal, Andhra Pradesh, Orissa<br />
and Karnataka showed no change <strong>of</strong> category.<br />
3.4.10 Percentage <strong>of</strong> <strong>Urban</strong> Children<br />
Underweight for Age<br />
Table 3.10 presents <strong>the</strong> percentage <strong>of</strong><br />
underweight urban children for age <strong>in</strong> 1998-99<br />
and 2005-06. This is <strong>on</strong>e <strong>in</strong>dicator <strong>in</strong> respect <strong>of</strong><br />
which <strong>the</strong>re has been c<strong>on</strong>siderable improvement
Percentage <strong>of</strong> Stunted Children (6-35 m<strong>on</strong>ths) <strong>in</strong> <strong>Urban</strong> <strong>India</strong><br />
(1998-99)
Percentage <strong>of</strong> Stunted Children (6-35 m<strong>on</strong>ths) <strong>in</strong> <strong>Urban</strong> <strong>India</strong><br />
(2005 06)
etween 1998-99 and 2005-06. At <strong>the</strong> all-<strong>India</strong><br />
level, <strong>the</strong> percentage <strong>of</strong> urban children aged<br />
6-35 m<strong>on</strong>ths underweight has decl<strong>in</strong>ed<br />
substantially from 38.4 to 30.1. Twelve out <strong>of</strong><br />
15 <strong>State</strong>s showed a decl<strong>in</strong>e as well, with<br />
URBAN FOOD INSECURITY ACROSS STATES 73<br />
Table 3.9a<br />
Distributi<strong>on</strong> <strong>of</strong> <strong>State</strong>s by Category <strong>of</strong> <strong>Insecurity</strong> with respect to <strong>the</strong> Incidence <strong>of</strong><br />
Stunt<strong>in</strong>g am<strong>on</strong>g <strong>Urban</strong> Children, 1998-99 and 2005-06<br />
Percentage <strong>of</strong> <strong>Urban</strong> children<br />
(6-35 m<strong>on</strong>ths) Stunted<br />
1998-99 2005-06<br />
18 - 23.8 (Very Low <strong>Insecurity</strong>) KE –<br />
23.8 - 29.6 (Low <strong>Insecurity</strong>) WB, PU, TN WB, KE, RA<br />
29.6 - 35.4 (Moderate <strong>Insecurity</strong>) AP, KA, MA AP, KA, AS, PU, TN, UP<br />
35.4 - 41.2 (High <strong>Insecurity</strong>) HA, OR, MP, AS, GU HA, OR, MP, BI, MA<br />
41.2 - 47 (Very High <strong>Insecurity</strong>) BI, RA, UP GU<br />
Table 3.10<br />
Percentage <strong>of</strong> <strong>Urban</strong> Children (6-35 m<strong>on</strong>ths) Underweight for Age, 1998-99 and 2005-06<br />
Sl.<br />
No.<br />
<strong>State</strong>s<br />
Percentage <strong>of</strong> Children Underweight<br />
1998-99 2005-06<br />
1 Andhra Pradesh 28.6 23.9<br />
2 Assam 27.3 27.9<br />
3 Bihar 47.4 33.4<br />
4 Gujarat 38.1 35.7<br />
5 Haryana 31.3 36.7<br />
6 Karnataka 38.7 26.4<br />
7 Kerala 22.4 15.3<br />
8 Madhya Pradesh 44.3 44.1<br />
9 Maharashtra 44.1 27.1<br />
10 Orissa 45.3 28.4<br />
11 Punjab 18.6 19.6<br />
12 Rajasthan 46.0 26.1<br />
13 Tamil Nadu 33.5 22.6<br />
14 Uttar Pradesh 42.6 25.8<br />
15 West Bengal 31.5 24.5<br />
<strong>India</strong> 38.4 30.1<br />
Source: NFHS 2000; NFHS 2007<br />
Rajasthan, Maharashtra, Uttar Pradesh, Orissa,<br />
Karnataka, Bihar and Tamil Nadu greatly<br />
improv<strong>in</strong>g. Only Haryana showed a significant<br />
worsen<strong>in</strong>g, mirror<strong>in</strong>g <strong>the</strong> all-<strong>India</strong> trend <strong>in</strong> <strong>the</strong><br />
opposite directi<strong>on</strong>.
74 REPORT ON THE STATE OF FOOD INSECURITY IN URBAN INDIA<br />
Table 3.10a and Maps 3.10a and 3.10b<br />
present <strong>the</strong> distributi<strong>on</strong> <strong>of</strong> <strong>State</strong>s by <strong>the</strong> category <strong>of</strong><br />
<strong>in</strong>security with respect to children underweight.<br />
Only <strong>on</strong>e <strong>State</strong> – Haryana – moved to a more<br />
<strong>in</strong>secure category between 1998-99 and 2005-06.<br />
The Punjab, Assam, Gujarat and Madhya Pradesh<br />
reported no category change. Of <strong>the</strong>se, <strong>the</strong> Punjab<br />
was <strong>in</strong> <strong>the</strong> least <strong>in</strong>secure category <strong>in</strong> both periods<br />
anyway! All <strong>the</strong> o<strong>the</strong>r <strong>State</strong>s – 11, to be precise –<br />
moved to lower categories <strong>of</strong> <strong>in</strong>security between<br />
1998-99 and 2005-06.<br />
3.4.11 Percentage <strong>of</strong> <strong>Urban</strong> Children<br />
Wast<strong>in</strong>g<br />
Table 3.11 presents <strong>the</strong> positi<strong>on</strong> <strong>in</strong> respect<br />
<strong>of</strong> <strong>the</strong> percentage <strong>of</strong> urban children aged 6-35<br />
m<strong>on</strong>ths who are wast<strong>in</strong>g.<br />
At <strong>the</strong> all-<strong>India</strong> level, <strong>the</strong>re has been a<br />
significant <strong>in</strong>crease <strong>in</strong> percentage <strong>of</strong> urban<br />
children wast<strong>in</strong>g from 13.1 per cent <strong>in</strong> 1998-99 to<br />
19 per cent <strong>in</strong> 2005-06. Twelve <strong>State</strong>s recorded an<br />
<strong>in</strong>crease <strong>in</strong> <strong>the</strong> percentage <strong>of</strong> urban children<br />
wast<strong>in</strong>g, with Haryana, Madhya Pradesh, Bihar<br />
and Rajasthan show<strong>in</strong>g very large <strong>in</strong>creases. Only<br />
three <strong>State</strong>s recorded a decl<strong>in</strong>e, with Kerala and<br />
Table 3.10a<br />
Distributi<strong>on</strong> <strong>of</strong> <strong>State</strong>s by Category <strong>of</strong> <strong>Insecurity</strong> with respect to<br />
<strong>Urban</strong> Children Underweight, 1998-99 and 2005-06<br />
Percentage <strong>of</strong> <strong>Urban</strong> Children<br />
(6-35 m<strong>on</strong>ths) Underweight<br />
1998-99 2005-06<br />
15 - 21.6 (Very Low <strong>Insecurity</strong>) PU PU, KE<br />
21.6 - 28.2 (Low <strong>Insecurity</strong>) AS, KE<br />
Maharashtra register<strong>in</strong>g <strong>on</strong>ly a marg<strong>in</strong>al decl<strong>in</strong>e.<br />
The <strong>on</strong>ly <strong>State</strong> to show a significant improvement<br />
was Orissa.<br />
Table 3.11a and Maps 3.11a and 3.11b<br />
show <strong>the</strong> distributi<strong>on</strong> <strong>of</strong> <strong>State</strong>s by <strong>the</strong> category<br />
<strong>of</strong> <strong>in</strong>security with respect to <strong>the</strong> <strong>in</strong>cidence <strong>of</strong><br />
wast<strong>in</strong>g am<strong>on</strong>g urban children. Only <strong>on</strong>e <strong>State</strong>, i.e,<br />
Orissa moved to a less <strong>in</strong>secure category between<br />
1998-99 and 2005-06. There was no change<br />
<strong>in</strong> category status for Kerala, <strong>the</strong> Punjab,<br />
Maharashtra, Tamil Nadu and Karnataka, while<br />
Madhya Pradesh, Assam, Rajasthan, Haryana,<br />
West Bengal, Andhra Pradesh, Uttar Pradesh<br />
and Gujarat moved down marg<strong>in</strong>ally to a more<br />
<strong>in</strong>secure category <strong>in</strong> 2005-06. Bihar fared most<br />
poorly, mov<strong>in</strong>g from be<strong>in</strong>g a low <strong>in</strong>security <strong>State</strong> <strong>in</strong><br />
1998-99 to a very high <strong>in</strong>secure status <strong>in</strong> 2005-06.<br />
3.5 The Composite Index <strong>of</strong> <strong>Urban</strong> <strong>Food</strong><br />
<strong>Insecurity</strong><br />
Go<strong>in</strong>g bey<strong>on</strong>d <strong>the</strong> urban food <strong>in</strong>security<br />
situati<strong>on</strong> <strong>in</strong> respect <strong>of</strong> <strong>India</strong> and 15 <strong>State</strong>s <strong>in</strong> terms<br />
<strong>of</strong> each <strong>of</strong> <strong>the</strong> chosen <strong>in</strong>dicators for <strong>the</strong> two periods<br />
1998-2000 and 2004-06, <strong>the</strong> discussi<strong>on</strong> turns to<br />
how <strong>the</strong> <strong>State</strong>s and <strong>the</strong> country have performed <strong>in</strong><br />
terms <strong>of</strong> <strong>the</strong> composite <strong>in</strong>dex.<br />
AS, AP, KA, MA, RA,<br />
TN, UP, WB<br />
28.2 - 34.8 (Moderate <strong>Insecurity</strong>) AP, HA, TN, WB BI, OR<br />
34.8 - 41.4 (High <strong>Insecurity</strong>) GU, KA GU, HA<br />
41.4 – 48 (Very High <strong>Insecurity</strong>) MP, BI, MA, OR, RA, UP MP
Percentage <strong>of</strong> Children Underweight (6-35 m<strong>on</strong>ths) <strong>in</strong> <strong>Urban</strong> <strong>India</strong><br />
(1998-99)
Percentage <strong>of</strong> Children Underweight (6-35 m<strong>on</strong>ths) <strong>in</strong> <strong>Urban</strong> <strong>India</strong><br />
(2005-06)
Percentage <strong>of</strong> <strong>Urban</strong> Children Wast<strong>in</strong>g (6-35 m<strong>on</strong>ths)<br />
(1998-99)
Percentage <strong>of</strong> <strong>Urban</strong> Children Wast<strong>in</strong>g (6-35 m<strong>on</strong>ths)<br />
(2005-06)
Sl.<br />
No.<br />
The picture emerg<strong>in</strong>g from a study <strong>of</strong> <strong>the</strong><br />
performance <strong>in</strong> terms <strong>of</strong> each <strong>in</strong>dicator is ra<strong>the</strong>r<br />
mixed. At <strong>the</strong> all-<strong>India</strong> level, <strong>the</strong> positi<strong>on</strong> seems<br />
to have improved with respect to access to toilets,<br />
URBAN FOOD INSECURITY ACROSS STATES 75<br />
Table 3.11<br />
Percentage <strong>of</strong> <strong>Urban</strong> Children (6-35 m<strong>on</strong>ths) Wast<strong>in</strong>g, 1998-99 and 2005-06<br />
<strong>State</strong>s<br />
Percentage <strong>of</strong> Children Wast<strong>in</strong>g<br />
1998-99 2005-06<br />
1 Andhra Pradesh 7.6 14.6<br />
2 Assam 10.4 19.1<br />
3 Bihar 17.1 37.4<br />
4 Gujarat 11.3 16.7<br />
5 Haryana 5.5 23.8<br />
6 Karnataka 16.2 17.0<br />
7 Kerala 10.9 9.1<br />
8 Madhya Pradesh 17.3 31.2<br />
9 Maharashtra 15.7 14.9<br />
10 Orissa 23.6 13.8<br />
11 Punjab 7.4 10.7<br />
12 Rajasthan 8.6 19.6<br />
13 Tamil Nadu 20.6 22.3<br />
14 Uttar Pradesh 9.5 12.8<br />
15 West Bengal 11.1 15.5<br />
<strong>India</strong> 13.1 19.0<br />
Source: NFHS 2000; NFHS 2007<br />
Table 3.11a<br />
Distributi<strong>on</strong> <strong>of</strong> <strong>State</strong>s by Category <strong>of</strong> <strong>Insecurity</strong> with respect to<br />
Wast<strong>in</strong>g am<strong>on</strong>g <strong>Urban</strong> Children, 1998-99 and 2005-06<br />
Percentage <strong>of</strong> Children<br />
(6-35 m<strong>on</strong>ths) Wast<strong>in</strong>g<br />
5 - 11.6 (Very Low <strong>Insecurity</strong>)<br />
1998-99 2005-06<br />
KE, PU, AP, AS, GU,<br />
HA, RA, UP, WB<br />
11.6 - 18.2 (Low <strong>Insecurity</strong>) KA, MA, BI, MP<br />
KE, PU<br />
KA, MA, AP, GU,<br />
OR, UP, WB<br />
18.2 - 24.8 (Moderate <strong>Insecurity</strong>) TN, OR TN, AS, HA, RA<br />
24.8 - 31.4 (High <strong>Insecurity</strong>) – MP<br />
31.4 - 38 (Very High <strong>Insecurity</strong>) – BI<br />
proporti<strong>on</strong> <strong>of</strong> female workers regularly employed<br />
and percentage <strong>of</strong> children underweight. In<br />
respect <strong>of</strong> <strong>the</strong> o<strong>the</strong>r <strong>in</strong>dicators, <strong>the</strong> situati<strong>on</strong><br />
worsened between 1998-2000 and 2004-06. The
76 REPORT ON THE STATE OF FOOD INSECURITY IN URBAN INDIA<br />
deteriorati<strong>on</strong> at <strong>the</strong> nati<strong>on</strong>al level was marg<strong>in</strong>al<br />
with regard to most <strong>in</strong>dicators, but was somewhat<br />
substantial with regard to percentage <strong>of</strong> women<br />
with anaemia and children wast<strong>in</strong>g. With respect to<br />
<strong>the</strong> <strong>in</strong>dicator <strong>of</strong> women with anaemia, <strong>the</strong> situati<strong>on</strong><br />
has worsened <strong>in</strong> 14 out <strong>of</strong> 15 <strong>State</strong>s. With regard<br />
to women with CED, <strong>the</strong> situati<strong>on</strong> has worsened <strong>in</strong><br />
11 <strong>State</strong>s, although marg<strong>in</strong>ally <strong>in</strong> most <strong>of</strong> <strong>the</strong>m.<br />
With regard to <strong>the</strong> percentage <strong>of</strong> children<br />
stunted, <strong>the</strong> situati<strong>on</strong> has decl<strong>in</strong>ed <strong>in</strong> 9 <strong>State</strong>s.<br />
The percentage <strong>of</strong> urban children wast<strong>in</strong>g has<br />
risen <strong>in</strong> 12 out <strong>of</strong> <strong>the</strong> 15 <strong>State</strong>s. In respect <strong>of</strong> <strong>the</strong><br />
<strong>in</strong>dicators <strong>of</strong> access to toilets, female workers<br />
regularly employed and percentage <strong>of</strong> children<br />
underweight, <strong>the</strong> situati<strong>on</strong> has improved <strong>in</strong> 10 or<br />
more <strong>State</strong>s. It must also be noted that many <strong>of</strong> <strong>the</strong><br />
nutriti<strong>on</strong>al outcome <strong>in</strong>dicators have suggested an<br />
unacceptably high level <strong>of</strong> <strong>in</strong>security.<br />
3.5.1 Variants <strong>of</strong> <strong>the</strong> <strong>Urban</strong> <strong>Food</strong><br />
<strong>Insecurity</strong> Index<br />
In <strong>the</strong> f<strong>in</strong>al analysis, out <strong>of</strong> <strong>the</strong> 11 <strong>in</strong>dicators<br />
c<strong>on</strong>sidered so far, that <strong>of</strong> wast<strong>in</strong>g am<strong>on</strong>g urban<br />
children has been excluded for <strong>the</strong> overall <strong>in</strong>dex.<br />
From <strong>the</strong> 10 rema<strong>in</strong><strong>in</strong>g <strong>in</strong>dicators, 6 variants <strong>of</strong> <strong>the</strong><br />
composite <strong>in</strong>dex have been generated for detailed<br />
exam<strong>in</strong>ati<strong>on</strong>. Comm<strong>on</strong> to all <strong>the</strong> variants are <strong>the</strong><br />
follow<strong>in</strong>g <strong>in</strong>dicators:<br />
1. Percentage <strong>of</strong> urban populati<strong>on</strong> c<strong>on</strong>sum<strong>in</strong>g<br />
less than 1890 Kcal per day<br />
2. Number (per 1000) <strong>of</strong> urban male workers<br />
not <strong>in</strong> regular employment<br />
3. Number (per 1000) <strong>of</strong> urban female workers<br />
not <strong>in</strong> regular employment<br />
4. Percentage <strong>of</strong> urban households without<br />
access to toilets<br />
5. Percentage <strong>of</strong> ever-married urban women<br />
(15-49 years) with any anaemia<br />
6. Percentage <strong>of</strong> ever-married urban women<br />
(15-49 years) with chr<strong>on</strong>ic energy<br />
deficiency<br />
In additi<strong>on</strong>, each <strong>of</strong> <strong>the</strong> 6 variants <strong>in</strong>cludes<br />
ei<strong>the</strong>r two or three o<strong>the</strong>r <strong>in</strong>dicators from <strong>the</strong> 10<br />
c<strong>on</strong>sidered. The <strong>in</strong>dicators specific to each variant<br />
are shown below:<br />
Variant 1 (The preferred variant)<br />
• Percentage <strong>of</strong> urban children (6-35 m<strong>on</strong>ths)<br />
with any anaemia<br />
• Percentage <strong>of</strong> urban children (6-35 m<strong>on</strong>ths)<br />
stunted<br />
Variant 2<br />
• Percentage <strong>of</strong> urban households without<br />
access to safe dr<strong>in</strong>k<strong>in</strong>g water<br />
• Percentage <strong>of</strong> urban children (6-35 m<strong>on</strong>ths)<br />
with any anaemia<br />
• Percentage <strong>of</strong> urban children (6-35 m<strong>on</strong>ths)<br />
underweight<br />
Variant 3<br />
• Percentage <strong>of</strong> urban households without<br />
access to safe dr<strong>in</strong>k<strong>in</strong>g water<br />
• Percentage <strong>of</strong> urban children (6-35 m<strong>on</strong>ths)<br />
with any anaemia<br />
• Percentage <strong>of</strong> stunted urban children (6-35<br />
m<strong>on</strong>ths)<br />
Variant 4<br />
• Percentage <strong>of</strong> urban children (6-35 m<strong>on</strong>ths)<br />
with any anaemia<br />
• Percentage <strong>of</strong> urban children (6-35 m<strong>on</strong>ths)<br />
underweight<br />
Variant 5<br />
• Percentage <strong>of</strong> urban households without<br />
access to safe dr<strong>in</strong>k<strong>in</strong>g water
• Percentage <strong>of</strong> urban children (6-35 m<strong>on</strong>ths)<br />
stunted<br />
Variant 6<br />
• Percentage <strong>of</strong> urban households without<br />
access to safe dr<strong>in</strong>k<strong>in</strong>g water<br />
• Percentage <strong>of</strong> underweight children<br />
(6-35 m<strong>on</strong>ths)<br />
Based <strong>on</strong> <strong>the</strong> <strong>in</strong>dex values for any given<br />
variant, <strong>the</strong> <strong>State</strong>s have been classified <strong>on</strong> a fivepo<strong>in</strong>t<br />
scale <strong>of</strong> food <strong>in</strong>security for each <strong>of</strong> <strong>the</strong> time<br />
periods 1998-2000 and 2004-06, rang<strong>in</strong>g from very<br />
low levels <strong>of</strong> food <strong>in</strong>security to very high levels.<br />
The composite <strong>in</strong>dex has been arrived at as<br />
follows:<br />
1) For each <strong>of</strong> <strong>the</strong> <strong>in</strong>dicators, <strong>the</strong> actual value<br />
for any given <strong>State</strong> has been c<strong>on</strong>verted <strong>in</strong>to<br />
a relative distance measure or <strong>in</strong>dex value<br />
by us<strong>in</strong>g <strong>the</strong> formula discussed <strong>in</strong> secti<strong>on</strong><br />
3.3.1. The <strong>State</strong> with <strong>the</strong> maximum <strong>in</strong>dicator<br />
value has been given <strong>the</strong> <strong>in</strong>dex value <strong>of</strong><br />
1 and that with <strong>the</strong> m<strong>in</strong>imum value an<br />
<strong>in</strong>dex value equal to zero.<br />
2) This procedure has been carried out for all<br />
<strong>the</strong> <strong>in</strong>dicators and <strong>the</strong> result<strong>in</strong>g <strong>in</strong>dex values<br />
for <strong>the</strong> <strong>State</strong>s for each <strong>of</strong> <strong>the</strong> <strong>in</strong>dicators<br />
for <strong>the</strong> two time periods has been brought<br />
toge<strong>the</strong>r <strong>in</strong> Tables 3.12 to 3.17. Based <strong>on</strong><br />
<strong>the</strong>se <strong>in</strong>dex values for each <strong>State</strong> for each<br />
<strong>in</strong>dicator <strong>in</strong>cluded <strong>in</strong> <strong>the</strong> particular variant <strong>of</strong><br />
<strong>the</strong> composite <strong>in</strong>dex <strong>in</strong> each <strong>of</strong> <strong>the</strong> two time<br />
periods, <strong>the</strong> value <strong>of</strong> <strong>the</strong> composite <strong>in</strong>dex<br />
for each <strong>State</strong> has been calculated <strong>in</strong> each<br />
period.<br />
3.5.2 Variant 1<br />
In choos<strong>in</strong>g <strong>the</strong> preferred <strong>in</strong>dex <strong>of</strong> urban<br />
food <strong>in</strong>security, two po<strong>in</strong>ts have been kept <strong>in</strong> m<strong>in</strong>d.<br />
URBAN FOOD INSECURITY ACROSS STATES 77<br />
First, it has been argued by many, not entirely<br />
without merit, that <strong>the</strong> <strong>in</strong>dicator for access to safe<br />
dr<strong>in</strong>k<strong>in</strong>g water could be mislead<strong>in</strong>g as a measure <strong>of</strong><br />
food <strong>in</strong>security. This is, <strong>in</strong> part, due to def<strong>in</strong>iti<strong>on</strong>al<br />
problems and comparability across time periods<br />
and data sources. On a closer exam<strong>in</strong>ati<strong>on</strong> <strong>of</strong> <strong>the</strong><br />
NFHS data, this <str<strong>on</strong>g>Report</str<strong>on</strong>g> has taken <strong>the</strong> view that <strong>the</strong>re<br />
are no serious comparability problems between <strong>the</strong><br />
sec<strong>on</strong>d and third rounds <strong>of</strong> NFHS. However, it is<br />
true that Kerala, with its cultural practice <strong>of</strong> boil<strong>in</strong>g<br />
water before dr<strong>in</strong>k<strong>in</strong>g, is less <strong>in</strong>secure <strong>on</strong> this<br />
count than would be suggested by NFHS figures.<br />
Ano<strong>the</strong>r important issue is that <strong>the</strong> availability <strong>of</strong><br />
a safe dr<strong>in</strong>k<strong>in</strong>g water facility by <strong>of</strong>ficial reck<strong>on</strong><strong>in</strong>g<br />
is no guarantee <strong>of</strong> adequacy <strong>of</strong> supply or <strong>of</strong> quality<br />
c<strong>on</strong>trol, especially given <strong>the</strong> suspected degree <strong>of</strong><br />
c<strong>on</strong>tam<strong>in</strong>ati<strong>on</strong> <strong>of</strong> water supplies <strong>in</strong> urban sett<strong>in</strong>gs.<br />
Sec<strong>on</strong>d, am<strong>on</strong>g <strong>the</strong> various child malnutriti<strong>on</strong><br />
<strong>in</strong>dicators, <strong>the</strong> percentage <strong>of</strong> children stunted has<br />
been c<strong>on</strong>sidered <strong>the</strong> most apposite <strong>in</strong>dicator <strong>of</strong><br />
chr<strong>on</strong>ic malnutriti<strong>on</strong>.<br />
So, <strong>the</strong> preferred <strong>in</strong>dex, called Variant 1,<br />
<strong>in</strong>cludes, besides <strong>the</strong> six comm<strong>on</strong> <strong>in</strong>dicators listed<br />
earlier, <strong>the</strong> two <strong>in</strong>dicators relat<strong>in</strong>g to children with<br />
anaemia and children stunted.<br />
The positi<strong>on</strong>s <strong>of</strong> different <strong>State</strong>s <strong>in</strong> terms <strong>of</strong><br />
this chosen <strong>in</strong>dex are presented <strong>in</strong> Tables 3.12 and<br />
3.12a.<br />
Kerala topped <strong>the</strong> <strong>State</strong>s <strong>in</strong> 1998-2000,<br />
closely followed by <strong>the</strong> Punjab. In 2004-06, <strong>the</strong><br />
Punjab took over <strong>the</strong> list, followed closely by<br />
Kerala. The Punjab, Kerala, Assam and West<br />
Bengal rema<strong>in</strong>ed <strong>the</strong> four top <strong>State</strong>s <strong>in</strong> both 1998-<br />
2000 and 2004-06. Maharashtra, which occupied<br />
<strong>the</strong> fifth place <strong>in</strong> 1998-2000 was replaced<br />
by a dramatically improved Uttar Pradesh <strong>in</strong><br />
2004-06. The five bottom <strong>State</strong>s <strong>in</strong> 1998-2000<br />
were familiar faces: Bihar, Madhya Pradesh,<br />
Orissa, Uttar Pradesh and Rajasthan. Despite<br />
significant improvement between 1998-2000 and
78 REPORT ON THE STATE OF FOOD INSECURITY IN URBAN INDIA<br />
Table 3.12<br />
Composite Index <strong>of</strong> <strong>Urban</strong> <strong>Food</strong> <strong>Insecurity</strong>, Variant 1 (V1), 1998-2000 and 2004-06<br />
Sl.<br />
No.<br />
<strong>State</strong>s 1998-2000 2004-06<br />
1 Andhra Pradesh 0.554 0.579<br />
2 Assam 0.405 0.386<br />
3 Bihar 0.790 0.667<br />
4 Gujarat 0.594 0.533<br />
5 Haryana 0.532 0.511<br />
6 Karnataka 0.510 0.552<br />
7 Kerala 0.341 0.289<br />
8 Madhya Pradesh 0.734 0.671<br />
9 Maharashtra 0.470 0.498<br />
10 Orissa 0.671 0.610<br />
11 Punjab 0.347 0.278<br />
12 Rajasthan 0.637 0.598<br />
13 Tamil Nadu 0.504 0.491<br />
14 Uttar Pradesh 0.666 0.455<br />
15 West Bengal 0.457 0.414<br />
<strong>India</strong> 0.542 0.538<br />
2004-06, four <strong>of</strong> <strong>the</strong>se five rema<strong>in</strong>ed at <strong>the</strong> bottom<br />
<strong>in</strong> 2004-06 as well. The excepti<strong>on</strong> was Uttar<br />
Pradesh, as already noted. Andhra Pradesh had <strong>the</strong><br />
unenviable dist<strong>in</strong>cti<strong>on</strong> <strong>of</strong> becom<strong>in</strong>g <strong>the</strong> fifth worst<br />
performer <strong>in</strong> 2004-06.<br />
The picture <strong>of</strong> general improvement<br />
c<strong>on</strong>t<strong>in</strong>ued, with 12 <strong>State</strong>s show<strong>in</strong>g improvement,<br />
with <strong>the</strong> “backward” <strong>State</strong>s <strong>of</strong> Bihar, Madhya<br />
Pradesh, Orissa and Uttar Pradesh show<strong>in</strong>g<br />
<strong>the</strong> most impressive improvement. Only three<br />
<strong>State</strong>s deteriorated between 1998-2000 and<br />
2004-06 – Andhra Pradesh, Karnataka and<br />
Maharashtra.<br />
The locati<strong>on</strong> <strong>of</strong> various <strong>State</strong>s by <strong>the</strong><br />
category <strong>of</strong> <strong>in</strong>security <strong>in</strong> both periods is shown <strong>in</strong><br />
Table 3.12a.<br />
Table 3.12a<br />
Distributi<strong>on</strong> <strong>of</strong> <strong>State</strong>s by Category <strong>of</strong> <strong>Food</strong> <strong>Insecurity</strong> (V1), 1998-2000 and 2004-06<br />
Index Class Interval, Variant 1 1998-2000 2004-06<br />
0.278 - 0.380 (Very Low <strong>Insecurity</strong>) KE, PU KE, PU<br />
0.380 - 0.483 (Low <strong>Insecurity</strong>) AS, WB, MA AS, WB, UP<br />
0.483 - 0.585 (Moderate <strong>Insecurity</strong>) AP, HA, KA, TN AP, HA, KA, TN, GU, MA<br />
0.585 - 0.688 (High <strong>Insecurity</strong>) OR, RA, GU, UP OR, RA, BI, MP<br />
0.688 - 0.790 (Very High <strong>Insecurity</strong>) BI, MP –
There has generally been not much change<br />
<strong>in</strong> <strong>the</strong> category status <strong>of</strong> <strong>the</strong> <strong>State</strong>s across <strong>the</strong><br />
two periods. Most <strong>State</strong>s rema<strong>in</strong>ed <strong>in</strong> <strong>the</strong> same<br />
category <strong>in</strong> 2004-06 that <strong>the</strong>y occupied <strong>in</strong><br />
1998-2000 (Maps 3.12a and 3.12b). Bihar and<br />
Madhya Pradesh improved from a very high<br />
<strong>in</strong>security category to a high <strong>in</strong>security category.<br />
Gujarat moved up from be<strong>in</strong>g highly <strong>in</strong>secure<br />
<strong>in</strong> 1998-2000 to be<strong>in</strong>g moderately <strong>in</strong>secure <strong>in</strong><br />
2004-06 while Maharashtra, <strong>the</strong> <strong>on</strong>ly <strong>State</strong> to<br />
have moved to a more <strong>in</strong>secure status, became<br />
moderately <strong>in</strong>secure <strong>in</strong> 2004-06, after hav<strong>in</strong>g<br />
been <strong>in</strong> <strong>the</strong> low <strong>in</strong>security category <strong>in</strong> 1998-2000.<br />
Uttar Pradesh has been <strong>the</strong> outstand<strong>in</strong>g performer,<br />
mov<strong>in</strong>g from be<strong>in</strong>g highly <strong>in</strong>secure <strong>in</strong> 1998-2000<br />
to <strong>the</strong> low <strong>in</strong>security category <strong>in</strong> 2004-06.<br />
3.5.3 Variant 2<br />
In <strong>the</strong> preferred first variant, <strong>the</strong> percentage<br />
<strong>of</strong> children who are stunted has been used as<br />
URBAN FOOD INSECURITY ACROSS STATES 79<br />
an <strong>in</strong>dicator <strong>of</strong> child nutriti<strong>on</strong> as it reflects <strong>the</strong><br />
nutriti<strong>on</strong>al status <strong>of</strong> children. In <strong>the</strong> relevant<br />
literature, <strong>the</strong> percentage <strong>of</strong> children who are<br />
underweight has also <strong>of</strong>ten been c<strong>on</strong>sidered as an<br />
<strong>in</strong>dicator <strong>of</strong> malnutriti<strong>on</strong>. Keep<strong>in</strong>g this <strong>in</strong> m<strong>in</strong>d,<br />
<strong>the</strong> <strong>in</strong>dex values have been recalculated us<strong>in</strong>g<br />
<strong>the</strong> percentage <strong>of</strong> urban children (6-35 m<strong>on</strong>ths)<br />
underweight as an <strong>in</strong>dicator <strong>in</strong> place <strong>of</strong> <strong>the</strong><br />
corresp<strong>on</strong>d<strong>in</strong>g percentage <strong>of</strong> stunted urban children.<br />
Also <strong>in</strong>cluded has been <strong>the</strong> <strong>in</strong>dicator perta<strong>in</strong><strong>in</strong>g to<br />
access to safe dr<strong>in</strong>k<strong>in</strong>g water. The o<strong>the</strong>r <strong>in</strong>dicators<br />
rema<strong>in</strong> <strong>the</strong> same as <strong>in</strong> <strong>the</strong> preferred first variant.<br />
The results are shown <strong>in</strong> Tables 3.13 and 3.13a.<br />
Four <strong>State</strong>s have depicted deteriorati<strong>on</strong><br />
between 1998-2000 and 2004-06, while all <strong>the</strong><br />
o<strong>the</strong>rs showed improvement. The top five positi<strong>on</strong>s<br />
<strong>in</strong> 1998-2000 bel<strong>on</strong>ged to <strong>the</strong> Punjab, Assam,<br />
Kerala, Haryana and West Bengal. However,<br />
Haryana became more <strong>in</strong>secure <strong>in</strong> 2004-06 and has<br />
been replaced by a much improved Maharashtra.<br />
Table 3.13<br />
Composite Index <strong>of</strong> <strong>Urban</strong> <strong>Food</strong> <strong>Insecurity</strong>, Variant 2 (V2), 1998-2000 and 2004-06<br />
Sl.<br />
No.<br />
<strong>State</strong>s 1998-2000 2004-06<br />
1 Andhra Pradesh 0.495 0.512<br />
2 Assam 0.353 0.379<br />
3 Bihar 0.747 0.608<br />
4 Gujarat 0.532 0.450<br />
5 Haryana 0.437 0.474<br />
6 Karnataka 0.489 0.515<br />
7 Kerala 0.429 0.368<br />
8 Madhya Pradesh 0.684 0.624<br />
9 Maharashtra 0.463 0.397<br />
10 Orissa 0.662 0.574<br />
11 Punjab 0.266 0.223<br />
12 Rajasthan 0.579 0.562<br />
13 Tamil Nadu 0.493 0.469<br />
14 Uttar Pradesh 0.577 0.406<br />
15 West Bengal 0.442 0.394<br />
<strong>India</strong> 0.504 0.476
80 REPORT ON THE STATE OF FOOD INSECURITY IN URBAN INDIA<br />
The bottom five positi<strong>on</strong>s <strong>in</strong> 1998-2000 were<br />
occupied by <strong>the</strong> usual suspects – Bihar, Madhya<br />
Pradesh, Orissa, Rajasthan and Uttar Pradesh.<br />
However, Uttar Pradesh improved dramatically<br />
between <strong>the</strong> two periods, and ended up sixth from<br />
<strong>the</strong> top <strong>in</strong> 2004-06, just beh<strong>in</strong>d Maharashtra. While<br />
Bihar, Madhya Pradesh and Orissa all showed<br />
significant improvement, <strong>the</strong>y still brought up <strong>the</strong><br />
rear <strong>in</strong> 2004-06 al<strong>on</strong>g with Rajasthan which was<br />
<strong>on</strong>ly marg<strong>in</strong>ally better. Karnataka jo<strong>in</strong>ed <strong>the</strong>m<br />
at <strong>the</strong> bottom part <strong>of</strong> <strong>the</strong> distributi<strong>on</strong> as <strong>the</strong> fifth<br />
worst <strong>State</strong> <strong>in</strong> 2004-06 while Andhra Pradesh was<br />
just ahead. Tamil Nadu and Gujarat rema<strong>in</strong>ed <strong>the</strong><br />
middl<strong>in</strong>g <strong>State</strong>s.<br />
Table 3.13a illustrates <strong>the</strong> positi<strong>on</strong> <strong>of</strong><br />
<strong>the</strong> various <strong>State</strong>s <strong>in</strong> terms <strong>of</strong> <strong>the</strong> category <strong>of</strong><br />
<strong>in</strong>security.<br />
The general improvement is evident<br />
from <strong>the</strong> fact that <strong>the</strong>re was no <strong>State</strong> <strong>in</strong> <strong>the</strong> very<br />
highly <strong>in</strong>secure category <strong>in</strong> 2004-06, with Bihar,<br />
Madhya Pradesh and Orissa mov<strong>in</strong>g up a category<br />
(Maps 3.13a and 3.13b). Uttar Pradesh shifted<br />
dramatically from be<strong>in</strong>g highly <strong>in</strong>secure <strong>in</strong> 1998-<br />
2000 to <strong>the</strong> category <strong>of</strong> low <strong>in</strong>security <strong>in</strong> 2004-06.<br />
West Bengal and Maharashtra moved up a notch<br />
from moderate <strong>in</strong>security to low <strong>in</strong>security, while<br />
<strong>the</strong> rema<strong>in</strong><strong>in</strong>g <strong>State</strong>s showed no change <strong>in</strong> category<br />
between 1998-2000 and 2004-06.<br />
3.5.4 Variant 3<br />
Table 3.13a<br />
Distributi<strong>on</strong> <strong>of</strong> <strong>State</strong>s by Category <strong>of</strong> <strong>Food</strong> <strong>Insecurity</strong> (V2), 1998-2000 and 2004-06<br />
Index Class Interval, Variant 2 1998-2000 2004-06<br />
0.223 - 0.328 (Very Low <strong>Insecurity</strong>) PU PU<br />
0.328 - 0.433 (Low <strong>Insecurity</strong>) AS, KE AS, KE, MA, UP, WB<br />
0.433 - 0.537 (Moderate <strong>Insecurity</strong>) AP, GU, HA, KA, TN, MA, WB AP, GU, HA, KA, TN<br />
0.537 - 0.642 (High <strong>Insecurity</strong>) RA, UP RA, BI, MP, OR<br />
0.642 - 0.747 (Very High <strong>Insecurity</strong>) BI, MP, OR<br />
In this variant, al<strong>on</strong>g with <strong>the</strong> six comm<strong>on</strong><br />
<strong>in</strong>dicators, three more have been <strong>in</strong>cluded:<br />
percentage <strong>of</strong> urban populati<strong>on</strong> with access to<br />
safe dr<strong>in</strong>k<strong>in</strong>g water, percentage <strong>of</strong> urban children<br />
(6-35 m<strong>on</strong>ths) with anaemia and percentage <strong>of</strong><br />
urban children (6-35 m<strong>on</strong>ths) stunted. The results<br />
are shown <strong>in</strong> Tables 3.14 and 3.14a.<br />
The Punjab has been <strong>the</strong> best performer <strong>in</strong><br />
both periods, with Assam tak<strong>in</strong>g <strong>the</strong> sec<strong>on</strong>d place<br />
<strong>in</strong> 1998-2000 and Kerala <strong>in</strong> 2004-06. Kerala was<br />
<strong>in</strong> third place <strong>in</strong> 1998-2000 and West Bengal <strong>in</strong><br />
2004-06. Unsurpris<strong>in</strong>gly, Bihar was at <strong>the</strong> bottom<br />
<strong>in</strong> both periods, with Madhya Pradesh and Orissa<br />
as <strong>the</strong> sec<strong>on</strong>d and third worst performers <strong>in</strong> both<br />
periods. In terms <strong>of</strong> <strong>the</strong> directi<strong>on</strong> <strong>of</strong> movement<br />
between <strong>the</strong> two periods, many <strong>State</strong>s have shown<br />
improvement. Only Andhra Pradesh, Karnataka<br />
and Maharashtra showed deteriorati<strong>on</strong>, with<br />
Karnataka <strong>the</strong> worst. The “backward” <strong>State</strong>s <strong>of</strong><br />
Uttar Pradesh, Bihar and Madhya Pradesh showed<br />
c<strong>on</strong>siderable improvement. Rajasthan, Orissa,<br />
Gujarat and Kerala showed some improvement<br />
as well.<br />
While <strong>the</strong> Punjab, Kerala, Assam and West<br />
Bengal rema<strong>in</strong>ed <strong>the</strong> four best <strong>State</strong>s <strong>in</strong> both<br />
periods, <strong>the</strong> fifth place, occupied by Maharashtra<br />
<strong>in</strong> 1998-2000, was taken by a rapidly improv<strong>in</strong>g
Composite Index <strong>of</strong> <strong>Urban</strong> <strong>Food</strong> <strong>Insecurity</strong> (Variant 1)<br />
(1998-2000)
Composite Index <strong>of</strong> <strong>Urban</strong> <strong>Food</strong> <strong>Insecurity</strong> (Variant 1)<br />
(2004-06)
Composite Index <strong>of</strong> <strong>Urban</strong> <strong>Food</strong> <strong>Insecurity</strong> (Variant 2)<br />
(1998-2000)
Composite Index <strong>of</strong> <strong>Urban</strong> <strong>Food</strong> <strong>Insecurity</strong> (Variant 2)<br />
(2004-06)
URBAN FOOD INSECURITY ACROSS STATES 81<br />
Table 3.14<br />
Composite Index <strong>of</strong> <strong>Urban</strong> <strong>Food</strong> <strong>Insecurity</strong>, Variant 3 (V3), 1998-2000 and 2004-06<br />
Sl.<br />
No.<br />
<strong>State</strong>s 1998-2000 2004-06<br />
1 Andhra Pradesh 0.500 0.522<br />
2 Assam 0.392 0.389<br />
3 Bihar 0.730 0.618<br />
4 Gujarat 0.536 0.482<br />
5 Haryana 0.474 0.456<br />
6 Karnataka 0.460 0.520<br />
7 Kerala 0.414 0.368<br />
8 Madhya Pradesh 0.669 0.614<br />
9 Maharashtra 0.423 0.445<br />
10 Orissa 0.631 0.587<br />
11 Punjab 0.308 0.247<br />
12 Rajasthan 0.574 0.536<br />
13 Tamil Nadu 0.469 0.461<br />
14 Uttar Pradesh 0.595 0.408<br />
15 West Bengal 0.420 0.375<br />
<strong>India</strong> 0.495 0.494<br />
Uttar Pradesh <strong>in</strong> 2004-06. Likewise, <strong>the</strong> bottom<br />
three <strong>State</strong>s <strong>in</strong> both periods were Bihar, Madhya<br />
Pradesh and Orissa, but <strong>the</strong> fourth place from <strong>the</strong><br />
bottom, occupied by Uttar Pradesh <strong>in</strong> 1998-2000,<br />
went to Rajasthan <strong>in</strong> 2004-06.<br />
The value <strong>of</strong> <strong>the</strong> <strong>in</strong>dex <strong>in</strong>creased for<br />
Andhra Pradesh between 1998-2000 and<br />
2004-06 from 0.500 to 0.522, signify<strong>in</strong>g a<br />
Table 3.14a<br />
worsen<strong>in</strong>g <strong>of</strong> <strong>the</strong> food security situati<strong>on</strong>. This<br />
is an <strong>in</strong>terest<strong>in</strong>g result, given that <strong>the</strong> general<br />
impressi<strong>on</strong> has been that urban Andhra Pradesh<br />
was a “happen<strong>in</strong>g” place <strong>in</strong> <strong>the</strong> period under<br />
reck<strong>on</strong><strong>in</strong>g.<br />
Based <strong>on</strong> <strong>the</strong> <strong>in</strong>dex values, <strong>the</strong> <strong>State</strong>s have<br />
been classified by <strong>the</strong>ir level <strong>of</strong> food <strong>in</strong>security <strong>in</strong><br />
Table 3.14a.<br />
Distributi<strong>on</strong> <strong>of</strong> <strong>State</strong>s by Category <strong>of</strong> <strong>Food</strong> <strong>Insecurity</strong> (V3), 1998-2000 and 2004-06<br />
Index Class Interval, Variant 3 1998-2000 2004-06<br />
0.247 - 0.344 (Very Low <strong>Insecurity</strong>) PU PU<br />
0.344 - 0.440 (Low <strong>Insecurity</strong>) AS, KE, WB, MA AS, KE, WB, UP<br />
0.440 - 0.537 (Moderate <strong>Insecurity</strong>) AP, GU, HA, KA, TN AP, GU, HA, KA, TN, MA, RA<br />
0.537 - 0.633 (High <strong>Insecurity</strong>) OR, RA, UP OR, BI, MP<br />
0.633 - 0.730 (Very High <strong>Insecurity</strong>) BI, MP –
82 REPORT ON THE STATE OF FOOD INSECURITY IN URBAN INDIA<br />
The four top <strong>State</strong>s <strong>in</strong> both periods were <strong>the</strong><br />
same: <strong>the</strong> Punjab, Kerala, West Bengal and Assam<br />
(Maps 3.14a and 3.14b). Uttar Pradesh went up<br />
two categories from be<strong>in</strong>g highly <strong>in</strong>secure <strong>in</strong> 1998-<br />
2000 to <strong>the</strong> status <strong>of</strong> low <strong>in</strong>security <strong>in</strong> 2004-06,<br />
while Rajasthan, Madhya Pradesh and Bihar all<br />
moved up by <strong>on</strong>e category to a less <strong>in</strong>secure status<br />
over <strong>the</strong> same period. Maharashtra shifted down a<br />
bit, while <strong>the</strong>re was no change <strong>of</strong> <strong>in</strong>security status<br />
<strong>in</strong> <strong>the</strong> case <strong>of</strong> <strong>the</strong> rema<strong>in</strong><strong>in</strong>g <strong>State</strong>s.<br />
3.5.5 Variant 4<br />
This variant differs from <strong>the</strong> <strong>on</strong>e just<br />
discussed <strong>in</strong> <strong>on</strong>ly <strong>on</strong>e particular: <strong>the</strong> percentage <strong>of</strong><br />
urban children underweight has been <strong>in</strong>cluded <strong>in</strong><br />
place <strong>of</strong> percentage <strong>of</strong> children stunted. The results<br />
are presented <strong>in</strong> Tables 3.15 and 3.15a.<br />
Once aga<strong>in</strong>, <strong>the</strong> Punjab, Kerala, Assam<br />
and West Bengal figured <strong>in</strong> <strong>the</strong> top four <strong>in</strong><br />
both periods, <strong>in</strong> <strong>the</strong> same order. The fifth<br />
spot was taken by Haryana <strong>in</strong> 1998-2000 and<br />
Maharashtra <strong>in</strong> 2004-06. Andhra Pradesh,<br />
Assam, Haryana and Karnataka deteriorated<br />
marg<strong>in</strong>ally between <strong>the</strong> two periods. The<br />
most impressive improvements aga<strong>in</strong> came from<br />
Uttar Pradesh, Orissa and Bihar, with Maharashtra<br />
and Madhya Pradesh also show<strong>in</strong>g impressive<br />
progress. Kerala, Tamil Nadu, <strong>the</strong> Punjab and<br />
West Bengal also showed decent improvement.<br />
In short, most <strong>State</strong>s did better <strong>in</strong> 2004-06 than <strong>in</strong><br />
1998-2000.<br />
The distributi<strong>on</strong> <strong>of</strong> <strong>State</strong>s by category <strong>of</strong><br />
<strong>in</strong>security between 1998-2000 and 2004-06 is<br />
shown <strong>in</strong> Table 3.15a.<br />
Table 3.15<br />
Composite Index <strong>of</strong> <strong>Urban</strong> <strong>Food</strong> <strong>Insecurity</strong>, Variant 4 (V4), 1998-2000 and 2004-06<br />
Sl.<br />
No.<br />
<strong>State</strong>s 1998-2000 2004-06<br />
1 Andhra Pradesh 0.548 0.568<br />
2 Assam 0.361 0.374<br />
3 Bihar 0.810 0.655<br />
4 Gujarat 0.590 0.497<br />
5 Haryana 0.491 0.531<br />
6 Karnataka 0.542 0.545<br />
7 Kerala 0.357 0.289<br />
8 Madhya Pradesh 0.751 0.682<br />
9 Maharashtra 0.515 0.444<br />
10 Orissa 0.705 0.595<br />
11 Punjab 0.299 0.251<br />
12 Rajasthan 0.643 0.627<br />
13 Tamil Nadu 0.531 0.500<br />
14 Uttar Pradesh 0.645 0.453<br />
15 West Bengal 0.481 0.435<br />
<strong>India</strong> 0.552 0.518
URBAN FOOD INSECURITY ACROSS STATES 83<br />
Table 3.15a<br />
Distributi<strong>on</strong> <strong>of</strong> <strong>State</strong>s by Category <strong>of</strong> <strong>Food</strong> <strong>Insecurity</strong> (V4), 1998-2000 and 2004-06<br />
Index Class Interval, Variant 4 1998-2000 2004-06<br />
0.251 - 0.363 (Very Low <strong>Insecurity</strong>) KE, PU, AS KE, PU<br />
0.363 - 0.475 (Low <strong>Insecurity</strong>) – AS, MA, UP, WB<br />
0.475 - 0.586 (Moderate <strong>Insecurity</strong>) AP, HA, KA, TN, MA, WB AP, HA, KA, TN, GU<br />
0.586 - 0.698 (High <strong>Insecurity</strong>) RA, GU, UP RA, BI, MP, OR<br />
0.698 - 0.810 (Very High <strong>Insecurity</strong>) BI, MP, OR –<br />
The Punjab and Kerala rema<strong>in</strong>ed at <strong>the</strong><br />
top <strong>in</strong> <strong>the</strong> category <strong>of</strong> very low <strong>in</strong>security while<br />
Haryana, Tamil Nadu, Andhra Pradesh and<br />
Karnataka rema<strong>in</strong>ed moderately <strong>in</strong>secure <strong>in</strong> both<br />
periods (Maps 3.15a and 3.15b). Rajasthan stayed<br />
highly <strong>in</strong>secure while Assam moved down from<br />
a very low <strong>in</strong>security status to low <strong>in</strong>security<br />
status. Seven <strong>State</strong>s have shown improvement.<br />
Uttar Pradesh was <strong>the</strong> most impressive, mov<strong>in</strong>g<br />
from high <strong>in</strong>security to low <strong>in</strong>security status. West<br />
Bengal, Maharashtra, Gujarat, Bihar, Madhya<br />
Pradesh and Orissa all moved to <strong>the</strong> next lower<br />
level <strong>of</strong> <strong>in</strong>security <strong>in</strong> 2004-06 relative to <strong>the</strong>ir<br />
positi<strong>on</strong> <strong>in</strong> 1998-2000.<br />
3.5.6 Variant 5<br />
Two anaemia <strong>in</strong>dicators – <strong>on</strong>e relat<strong>in</strong>g to<br />
anaemia am<strong>on</strong>g women and <strong>the</strong> o<strong>the</strong>r to anaemia<br />
am<strong>on</strong>g children – figure <strong>in</strong> this discussi<strong>on</strong>. It may<br />
be worthwhile to drop <strong>on</strong>e <strong>of</strong> <strong>the</strong>se and exam<strong>in</strong>e<br />
<strong>the</strong> result<strong>in</strong>g picture, carry<strong>in</strong>g out <strong>the</strong> exercise<br />
<strong>in</strong> two variants. Variant 5 <strong>in</strong>cludes 8 <strong>in</strong>dicators:<br />
calorie deprivati<strong>on</strong>, proporti<strong>on</strong> <strong>of</strong> male workers<br />
not regularly employed, <strong>the</strong> proporti<strong>on</strong> <strong>of</strong> female<br />
workers not regularly employed, <strong>the</strong> proporti<strong>on</strong> <strong>of</strong><br />
households without access to safe dr<strong>in</strong>k<strong>in</strong>g water,<br />
<strong>the</strong> proporti<strong>on</strong> <strong>of</strong> households without access to<br />
toilet facilities, <strong>the</strong> proporti<strong>on</strong> <strong>of</strong> women with<br />
anaemia, <strong>the</strong> proporti<strong>on</strong> <strong>of</strong> women with CED and<br />
<strong>the</strong> proporti<strong>on</strong> <strong>of</strong> children stunted. The sixth and<br />
f<strong>in</strong>al variant discussed <strong>in</strong> <strong>the</strong> next subsecti<strong>on</strong> has<br />
<strong>on</strong>e change from variant 5, with <strong>the</strong> proporti<strong>on</strong><br />
<strong>of</strong> children underweight used <strong>in</strong> place <strong>of</strong> <strong>the</strong><br />
proporti<strong>on</strong> stunted. In both <strong>the</strong>se variants, <strong>the</strong><br />
<strong>in</strong>dicator <strong>of</strong> percentage <strong>of</strong> urban children anaemic<br />
has been dropped.<br />
The results <strong>in</strong> terms <strong>of</strong> variant 5 are presented<br />
<strong>in</strong> Tables 3.16 and 3.16a.<br />
Kerala’s performance <strong>in</strong> both periods has<br />
immediately worsened by <strong>the</strong> <strong>in</strong>clusi<strong>on</strong> <strong>of</strong> lack <strong>of</strong><br />
access to safe dr<strong>in</strong>k<strong>in</strong>g water, a mislead<strong>in</strong>g <strong>in</strong>dicator<br />
as far as that <strong>State</strong> is c<strong>on</strong>cerned. Never<strong>the</strong>less,<br />
Kerala did show improvement between 1998-<br />
2000 and 2004-06. Once aga<strong>in</strong>, Andhra Pradesh,<br />
Karnataka and Maharashtra showed deteriorati<strong>on</strong>.<br />
All <strong>the</strong> o<strong>the</strong>r <strong>State</strong>s improved, and Uttar Pradesh,<br />
<strong>the</strong> Punjab, Bihar, Gujarat and Madhya Pradesh<br />
did so significantly. The overall trend between<br />
1998-2000 and 2004-06 has clearly been <strong>on</strong>e <strong>of</strong><br />
improvement.<br />
While <strong>the</strong> Punjab rema<strong>in</strong>ed at <strong>the</strong> top <strong>in</strong><br />
both periods, and by a l<strong>on</strong>g way, <strong>the</strong>re have been<br />
dist<strong>in</strong>ct changes <strong>in</strong> <strong>the</strong> top five as compared to<br />
earlier variants <strong>of</strong> <strong>the</strong> <strong>in</strong>dex, and across <strong>the</strong> two<br />
periods. In 1998-2000, <strong>the</strong> Punjab, Maharashtra,<br />
Haryana, West Bengal and Assam figured <strong>in</strong> <strong>the</strong> top<br />
five, and Kerala did not. In 2004-06, <strong>the</strong> Punjab,<br />
Assam, Haryana and West Bengal rema<strong>in</strong>ed at<br />
<strong>the</strong> top, but Uttar Pradesh replaced Maharashtra.
84 REPORT ON THE STATE OF FOOD INSECURITY IN URBAN INDIA<br />
Table 3.16<br />
Composite Index <strong>of</strong> <strong>Urban</strong> <strong>Food</strong> <strong>Insecurity</strong>, Variant 5 (V5), 1998-2000 and 2004-06<br />
Sl.<br />
No.<br />
<strong>State</strong>s 1998-2000 2004-06<br />
1 Andhra Pradesh 0.492 0.498<br />
2 Assam 0.424 0.362<br />
3 Bihar 0.714 0.626<br />
4 Gujarat 0.536 0.452<br />
5 Haryana 0.408 0.396<br />
6 Karnataka 0.456 0.460<br />
7 Kerala 0.466 0.414<br />
8 Madhya Pradesh 0.668 0.593<br />
9 Maharashtra 0.394 0.446<br />
10 Orissa 0.643 0.616<br />
11 Punjab 0.252 0.158<br />
12 Rajasthan 0.537 0.491<br />
13 Tamil Nadu 0.467 0.427<br />
14 Uttar Pradesh 0.584 0.370<br />
15 West Bengal 0.418 0.400<br />
<strong>India</strong> 0.482 0.472<br />
The bottom five <strong>State</strong>s <strong>in</strong> 1998-2000 – Bihar,<br />
Madhya Pradesh, Orissa, Uttar Pradesh and<br />
Rajasthan – rema<strong>in</strong>ed <strong>the</strong> same as <strong>in</strong> earlier<br />
variants, with Gujarat perform<strong>in</strong>g almost as<br />
badly as Rajasthan. The five at <strong>the</strong> bottom <strong>in</strong><br />
2004-06 <strong>in</strong>cluded Bihar, Orissa, Madhya Pradesh<br />
and Rajasthan aga<strong>in</strong>, but Uttar Pradesh has<br />
been replaced by Andhra Pradesh which <strong>in</strong> fact<br />
performed marg<strong>in</strong>ally worse than Rajasthan. Uttar<br />
Pradesh zoomed from <strong>the</strong> fourth positi<strong>on</strong> from <strong>the</strong><br />
bottom <strong>in</strong> 1998-2000 to <strong>the</strong> third positi<strong>on</strong> from<br />
<strong>the</strong> top, just beh<strong>in</strong>d Assam but a l<strong>on</strong>g way beh<strong>in</strong>d<br />
Punjab <strong>in</strong> 2004-06.<br />
Table 3.16a illustrates <strong>the</strong> distributi<strong>on</strong> <strong>of</strong><br />
<strong>State</strong>s by <strong>the</strong>ir category <strong>of</strong> <strong>in</strong>security.<br />
Table 3.16a<br />
Distributi<strong>on</strong> <strong>of</strong> <strong>State</strong>s by Category <strong>of</strong> <strong>Food</strong> <strong>Insecurity</strong> (V5), 1998-2000 and 2004-06<br />
Index Class Interval, Variant 5 1998-2000 2004-06<br />
0.158 - 0.269 (Very Low <strong>Insecurity</strong>) PU PU<br />
0.269 - 0.380 (Low <strong>Insecurity</strong>) – AS, UP<br />
0.380- 0.492 (Moderate <strong>Insecurity</strong>)<br />
HA, KA, KE, MA, TN,<br />
WB, AP, AS<br />
HA, KA, KE, MA, TN,<br />
WB, GU, RA<br />
0.492 - 0.603 (High <strong>Insecurity</strong>) GU, RA, UP AP, MP<br />
0.603 - 0.714 (Very High <strong>Insecurity</strong>) BI, MP, OR BI, OR
Composite Index <strong>of</strong> <strong>Urban</strong> <strong>Food</strong> <strong>Insecurity</strong> (Variant 3)<br />
(1998-2000)
Composite Index <strong>of</strong> <strong>Urban</strong> <strong>Food</strong> <strong>Insecurity</strong> (Variant 3)<br />
(2004-06)
Composite Index <strong>of</strong> <strong>Urban</strong> <strong>Food</strong> <strong>Insecurity</strong> (Variant 4)<br />
(1998-2000)
Composite Index <strong>of</strong> <strong>Urban</strong> <strong>Food</strong> <strong>Insecurity</strong> (Variant 4)<br />
(2004-06)
Most <strong>State</strong>s have rema<strong>in</strong>ed <strong>in</strong> <strong>the</strong> same<br />
category <strong>in</strong> 2004-06 as <strong>the</strong>y were <strong>in</strong> 1998-2000<br />
(Maps 3.16a and 3.16b). Uttar Pradesh has<br />
shown dramatic improvement, mov<strong>in</strong>g from<br />
high <strong>in</strong>security <strong>in</strong> 1998-2000 to low <strong>in</strong>security <strong>in</strong><br />
2004-06. Assam, Gujarat, Rajasthan and Madhya<br />
Pradesh all moved up <strong>in</strong> 2004-06 to <strong>the</strong> next less<br />
<strong>in</strong>secure category. The rema<strong>in</strong><strong>in</strong>g <strong>State</strong>s, except<br />
Andhra Pradesh, showed no change <strong>of</strong> category.<br />
3.5.7 Variant 6<br />
The discussi<strong>on</strong> <strong>in</strong> this secti<strong>on</strong> ends with a<br />
presentati<strong>on</strong> <strong>of</strong> <strong>the</strong> results us<strong>in</strong>g <strong>the</strong> sixth and f<strong>in</strong>al<br />
variant <strong>of</strong> <strong>the</strong> composite <strong>in</strong>dex. This differs from<br />
<strong>the</strong> previous variant <strong>in</strong> <strong>on</strong>ly <strong>on</strong>e respect. Stunt<strong>in</strong>g<br />
am<strong>on</strong>g urban children has been replaced by <strong>the</strong><br />
<strong>in</strong>cidence <strong>of</strong> underweight am<strong>on</strong>g <strong>the</strong>m. The results<br />
are shown <strong>in</strong> Tables 3.17 and 3.17a.<br />
URBAN FOOD INSECURITY ACROSS STATES 85<br />
Practically every <strong>State</strong> has shown<br />
improvement between 1998-2000 and 2004-06.<br />
The <strong>on</strong>ly excepti<strong>on</strong>s were Haryana whose <strong>in</strong>dex<br />
value rose to 0.416 from 0.366 and Andhra Pradesh<br />
which worsened marg<strong>in</strong>ally from 0.485 to 0.486.<br />
Once aga<strong>in</strong>, Uttar Pradesh, Bihar, Madhya Pradesh<br />
and Orissa displayed impressive improvement, as<br />
did Gujarat, <strong>the</strong> Punjab, Kerala and Tamil Nadu.<br />
The Punjab, Haryana, Assam, Maharashtra<br />
and West Bengal were <strong>the</strong> top five <strong>State</strong>s <strong>in</strong> 1998-<br />
2000. In 2004-06, <strong>the</strong> Punjab, Assam, Maharashtra,<br />
Uttar Pradesh and Kerala were <strong>the</strong> top five, but<br />
several o<strong>the</strong>r <strong>State</strong>s were closely beh<strong>in</strong>d, <strong>in</strong>clud<strong>in</strong>g<br />
Gujarat, West Bengal and Haryana.<br />
The bottom five <strong>State</strong>s <strong>in</strong> 1998-2000 were<br />
aga<strong>in</strong> Bihar, Madhya Pradesh, Orissa, Uttar<br />
Pradesh and Rajasthan. However, <strong>in</strong> 2004-06,<br />
Uttar Pradesh was replaced by Andhra Pradesh.<br />
Table 3.17<br />
Composite Index <strong>of</strong> <strong>Urban</strong> <strong>Food</strong> <strong>Insecurity</strong>, Variant 6 (V6), 1998-2000 and 2004-06<br />
Sl.<br />
No.<br />
<strong>State</strong>s 1998-2000 2004-06<br />
1 Andhra Pradesh 0.485 0.486<br />
2 Assam 0.379 0.350<br />
3 Bihar 0.734 0.614<br />
4 Gujarat 0.532 0.415<br />
5 Haryana 0.366 0.416<br />
6 Karnataka 0.489 0.454<br />
7 Kerala 0.482 0.414<br />
8 Madhya Pradesh 0.685 0.604<br />
9 Maharashtra 0.439 0.392<br />
10 Orissa 0.677 0.601<br />
11 Punjab 0.203 0.130<br />
12 Rajasthan 0.543 0.521<br />
13 Tamil Nadu 0.493 0.435<br />
14 Uttar Pradesh 0.563 0.368<br />
15 West Bengal 0.443 0.421<br />
<strong>India</strong> 0.492 0.452
86 REPORT ON THE STATE OF FOOD INSECURITY IN URBAN INDIA<br />
Changes have been similar to what was seen with<br />
earlier variants <strong>of</strong> <strong>the</strong> <strong>in</strong>dex.<br />
The distributi<strong>on</strong> <strong>of</strong> <strong>the</strong> <strong>State</strong>s by <strong>the</strong> category<br />
<strong>of</strong> <strong>in</strong>security is shown <strong>in</strong> Table 3.17a.<br />
Most <strong>State</strong>s improved to higher categories<br />
between 1998-2000 and 2004-06 (Maps 3.17a and<br />
3.17b). Only Haryana moved from low <strong>in</strong>security<br />
to moderate <strong>in</strong>security. Uttar Pradesh jumped from<br />
high <strong>in</strong>security to low <strong>in</strong>security. Assam, Tamil<br />
Nadu, Gujarat, Madhya Pradesh and Orissa all<br />
improved by <strong>on</strong>e category from <strong>the</strong>ir respective<br />
positi<strong>on</strong>s <strong>in</strong> 1998-2000. The rema<strong>in</strong><strong>in</strong>g <strong>State</strong>s<br />
showed no change.<br />
3.6 An Overall Assessment<br />
Work<strong>in</strong>g with <strong>the</strong> broad results thrown up by<br />
<strong>the</strong> exercise <strong>of</strong> <strong>in</strong>dex c<strong>on</strong>structi<strong>on</strong>, <strong>the</strong> values <strong>of</strong><br />
<strong>the</strong> variants <strong>of</strong> <strong>the</strong> <strong>in</strong>dex have been calculated for<br />
urban <strong>India</strong> as a whole <strong>in</strong> <strong>the</strong> two periods. The data<br />
is summarised <strong>in</strong> Table 3.18.<br />
It is clear that no matter which variant <strong>of</strong><br />
<strong>the</strong> overall <strong>in</strong>dex <strong>of</strong> urban food <strong>in</strong>security for<br />
urban <strong>India</strong> as a whole is c<strong>on</strong>sidered, <strong>the</strong>re has<br />
been an improvement <strong>in</strong> <strong>the</strong> situati<strong>on</strong>. Recall<strong>in</strong>g<br />
that a higher value <strong>of</strong> <strong>the</strong> <strong>in</strong>dex implies a greater<br />
degree <strong>of</strong> food <strong>in</strong>security, it would appear that<br />
variants that exclude <strong>the</strong> <strong>in</strong>dicator <strong>of</strong> access to<br />
safe dr<strong>in</strong>k<strong>in</strong>g water reflect a higher degree <strong>of</strong> food<br />
<strong>in</strong>security than <strong>the</strong> <strong>on</strong>es which <strong>in</strong>clude it. Variant 1,<br />
<strong>the</strong> variant deemed as <strong>the</strong> most appropriate <strong>in</strong>dex<br />
for reas<strong>on</strong>s already discussed, and variant 4 – both<br />
<strong>of</strong> which exclude <strong>the</strong> <strong>in</strong>dicator <strong>of</strong> lack <strong>of</strong> access<br />
to safe dr<strong>in</strong>k<strong>in</strong>g water – may provide a closer<br />
approximati<strong>on</strong> to reality than <strong>the</strong> o<strong>the</strong>rs. Sec<strong>on</strong>d,<br />
<strong>the</strong>re has been an impressive reducti<strong>on</strong> <strong>in</strong> <strong>the</strong><br />
percentage <strong>of</strong> urban children underweight between<br />
1998-2000 and 2004-06 while <strong>the</strong>re has been a<br />
marg<strong>in</strong>al rise <strong>in</strong> <strong>the</strong> percentage <strong>of</strong> urban children<br />
stunted. So, it is not a surpris<strong>in</strong>g fact that <strong>the</strong><br />
improvement between 1998-2000 and 2004-06 has<br />
been greater <strong>in</strong> variants that used <strong>the</strong> percentage <strong>of</strong><br />
urban children underweight as an <strong>in</strong>dicator than <strong>in</strong><br />
those that used <strong>the</strong> proporti<strong>on</strong> <strong>of</strong> children stunted.<br />
Thus, variants 2, 4 and 6 have shown a greater<br />
decl<strong>in</strong>e <strong>in</strong> food <strong>in</strong>security between 1998-2000 and<br />
2004-06 than variants 1, 3 and 5. Third, variants 5<br />
and 6 have depicted a lower overall degree <strong>of</strong> food<br />
<strong>in</strong>security than all <strong>the</strong> o<strong>the</strong>r variants. This is not<br />
surpris<strong>in</strong>g ei<strong>the</strong>r. The percentage <strong>of</strong> urban children<br />
Table 3.17a<br />
Distributi<strong>on</strong> <strong>of</strong> <strong>State</strong>s by Category <strong>of</strong> <strong>Food</strong> <strong>Insecurity</strong> (V6), 1998-2000 and 2004-06<br />
Index Class Interval, Variant 6 1998-2000 2004-06<br />
0.130 - 0.251(Very Low <strong>Insecurity</strong> PU PU<br />
0.251 - 0.372 (Low <strong>Insecurity</strong>) HA AS, UP<br />
0.372 - 0.492 (Moderate <strong>Insecurity</strong>) AP, KA, KE, MA, WB, AS<br />
AP, KA, KE, MA, WB, GU,<br />
HA, TN<br />
0.492 - 0.613 (High <strong>Insecurity</strong>) RA, GU, TN, UP RA, MP, OR<br />
0.613 - 0.734 (Very High <strong>Insecurity</strong>) BI, MP, OR BI
Composite Index <strong>of</strong> <strong>Urban</strong> <strong>Food</strong> <strong>Insecurity</strong> (Variant 5)<br />
(1998-2000)
Composite Index <strong>of</strong> <strong>Urban</strong> <strong>Food</strong> <strong>Insecurity</strong> (Variant 5)<br />
(2004-06)
Composite Index <strong>of</strong> <strong>Urban</strong> <strong>Food</strong> <strong>Insecurity</strong> (Variant 6)<br />
(1998-2000)
Composite Index <strong>of</strong> <strong>Urban</strong> <strong>Food</strong> <strong>Insecurity</strong> (Variant 6)<br />
(2004-06)
Period<br />
Composite<br />
Index<br />
Variant 1<br />
with anaemia has <strong>in</strong>creased between 1998-2000<br />
and 2004-06 at <strong>the</strong> nati<strong>on</strong>al level, even if not by<br />
much. So its exclusi<strong>on</strong> is bound to have resulted <strong>in</strong><br />
a lower degree <strong>of</strong> <strong>in</strong>security.<br />
While <strong>the</strong>re has been improvement between<br />
1998-2000 and 2004-06 <strong>in</strong> <strong>the</strong> food security<br />
situati<strong>on</strong> <strong>in</strong> urban <strong>India</strong> as measured by any <strong>of</strong> <strong>the</strong><br />
six variants <strong>of</strong> <strong>the</strong> composite <strong>in</strong>dex, it must also be<br />
noted that it has been ra<strong>the</strong>r modest.<br />
Perhaps <strong>the</strong> most appropriate variant <strong>in</strong><br />
terms <strong>of</strong> <strong>the</strong> quality <strong>of</strong> data and <strong>the</strong> issue <strong>of</strong><br />
chr<strong>on</strong>ic food and nutriti<strong>on</strong> <strong>in</strong>security is variant<br />
1. This, it may be recalled, excludes both lack <strong>of</strong><br />
access to safe dr<strong>in</strong>k<strong>in</strong>g water and percentage <strong>of</strong><br />
children underweight, but <strong>in</strong>cludes <strong>the</strong> percentage<br />
<strong>of</strong> children stunted. In terms <strong>of</strong> this variant, <strong>the</strong><br />
decl<strong>in</strong>e <strong>in</strong> <strong>the</strong> composite urban food <strong>in</strong>security<br />
<strong>in</strong>dex is quite small, from 0.542 <strong>in</strong> 1998-2000 to<br />
0.538 <strong>in</strong> 2004-06. This is dur<strong>in</strong>g a period when<br />
<strong>India</strong>’s GDP growth rate has been <strong>in</strong> excess <strong>of</strong> 6<br />
per cent per annum compound. Clearly, <strong>the</strong>re has<br />
to be more than <strong>the</strong> rhetoric <strong>of</strong> <strong>in</strong>clusive growth<br />
if a significant improvement <strong>in</strong> <strong>the</strong> food security<br />
situati<strong>on</strong> <strong>in</strong> urban <strong>India</strong> is to occur.<br />
While detailed analyses <strong>of</strong> <strong>the</strong> performance<br />
<strong>of</strong> each <strong>State</strong> <strong>in</strong> <strong>the</strong> two periods and <strong>the</strong> reas<strong>on</strong>s<br />
<strong>the</strong>re<strong>of</strong> would require more research, some<br />
key aspects can be highlighted from a general<br />
understand<strong>in</strong>g <strong>of</strong> <strong>the</strong> prevail<strong>in</strong>g scenario <strong>in</strong> <strong>the</strong><br />
different <strong>State</strong>s.<br />
URBAN FOOD INSECURITY ACROSS STATES 87<br />
Table 3.18<br />
Values <strong>of</strong> <strong>the</strong> Composite <strong>Urban</strong> <strong>Food</strong> <strong>Insecurity</strong> Index Variants for <strong>India</strong> 1998-2000 and 2004-06<br />
Composite<br />
Index<br />
Variant 2<br />
Composite<br />
Index<br />
Variant 3<br />
Composite<br />
Index<br />
Variant 4<br />
Composite<br />
Index<br />
Variant 5<br />
Composite<br />
Index<br />
Variant 6<br />
1998-2000 0.542 0.504 0.495 0.552 0.482 0.492<br />
2004-06 0.538 0.476 0.494 0.518 0.472 0.452<br />
The performance <strong>of</strong> all <strong>the</strong> <strong>State</strong>s <strong>in</strong> terms<br />
<strong>of</strong> <strong>the</strong> value <strong>of</strong> <strong>the</strong> composite <strong>in</strong>dex <strong>of</strong> urban food<br />
<strong>in</strong>security under all variants <strong>in</strong> both periods is<br />
brought toge<strong>the</strong>r <strong>in</strong> Table 3.19.<br />
The rank<strong>in</strong>g <strong>of</strong> <strong>the</strong> <strong>State</strong>s <strong>in</strong> terms <strong>of</strong> <strong>the</strong><br />
value <strong>of</strong> <strong>the</strong> urban food <strong>in</strong>security <strong>in</strong>dex emerges as<br />
be<strong>in</strong>g very similar under all <strong>the</strong> variants. It is also<br />
pretty unambiguous that <strong>in</strong> 1998-2000, <strong>the</strong> bottom<br />
five <strong>State</strong>s were Bihar, Madhya Pradesh, Orissa,<br />
Uttar Pradesh and Rajasthan. Perhaps <strong>the</strong> most<br />
remarakble story <strong>in</strong> terms <strong>of</strong> <strong>the</strong> change between<br />
1998-2000 and 2004-06 has been <strong>the</strong> enormous<br />
improvement <strong>in</strong> <strong>the</strong> performance <strong>of</strong> urban Uttar<br />
Pradesh. The o<strong>the</strong>r <strong>State</strong>s <strong>in</strong> this group also<br />
improved, with Bihar hav<strong>in</strong>g d<strong>on</strong>e so relatively<br />
rapidly, Madhya Pradesh and Orissa not far beh<strong>in</strong>d,<br />
but Rajasthan progress<strong>in</strong>g <strong>on</strong>ly modestly. On <strong>the</strong><br />
o<strong>the</strong>r hand, <strong>the</strong> three <strong>State</strong>s that <strong>on</strong>e would have<br />
expected to do better with rapid growth – Haryana,<br />
Andhra Pradesh and Karnataka – have d<strong>on</strong>e worse<br />
<strong>in</strong> 2004-06 as compared to 1998-2000 <strong>in</strong> respect<br />
<strong>of</strong> all <strong>the</strong> variants, except for Karnataka <strong>in</strong> variant<br />
6. Am<strong>on</strong>g <strong>the</strong> three top performers, <strong>the</strong> Punjab and<br />
Kerala showed c<strong>on</strong>sistent improvement across<br />
<strong>the</strong> two periods under all <strong>the</strong> variants. Assam has<br />
been a mixed bag, improv<strong>in</strong>g under all <strong>the</strong><br />
variants except V2 and V4. Likewise, Maharashtra<br />
improved <strong>in</strong> terms <strong>of</strong> variants 2, 4 and 6, but<br />
deteriorated <strong>in</strong> terms <strong>of</strong> variants 1, 3 and 5. On <strong>the</strong><br />
o<strong>the</strong>r hand, Gujarat, Tamil Nadu and West Bengal<br />
c<strong>on</strong>sistently improved across <strong>the</strong> two periods
88 REPORT ON THE STATE OF FOOD INSECURITY IN URBAN INDIA<br />
Table 3.19<br />
Comparis<strong>on</strong> <strong>of</strong> <strong>State</strong>s <strong>in</strong> terms <strong>of</strong> Composite Index, All Variants, 1998-2000 and 2004-06<br />
V6<br />
04/06<br />
V6<br />
98/2000<br />
V5<br />
04/06<br />
V5<br />
98/2000<br />
V4<br />
04/06<br />
V4<br />
98/2000<br />
V3<br />
04/06<br />
V3<br />
98/2000<br />
V2<br />
04/06<br />
V2<br />
98/2000<br />
V1<br />
04/06<br />
V1<br />
98/2000<br />
<strong>State</strong>s<br />
AP 0.554 0.579 0.495 0.512 0.500 0.522 0.548 0.568 0.492 0.498 0.485 0.486<br />
AS 0.405 0.386 0.353 0.379 0.392 0.389 0.361 0.374 0.424 0.362 0.379 0.350<br />
BI 0.790 0.667 0.747 0.608 0.730 0.618 0.810 0.655 0.714 0.626 0.734 0.614<br />
GU 0.594 0.533 0.532 0.450 0.536 0.482 0.590 0.497 0.536 0.452 0.532 0.415<br />
HA 0.532 0.511 0.437 0.474 0.474 0.456 0.491 0.531 0.408 0.396 0.366 0.416<br />
KA 0.510 0.552 0.489 0.515 0.460 0.520 0.542 0.545 0.456 0.460 0.489 0.454<br />
KE 0.341 0.289 0.429 0.368 0.414 0.368 0.357 0.289 0.466 0.414 0.482 0.414<br />
MP 0.734 0.671 0.684 0.624 0.669 0.614 0.751 0.682 0.668 0.593 0.685 0.604<br />
MA 0.470 0.498 0.463 0.397 0.423 0.445 0.515 0.444 0.394 0.446 0.439 0.392<br />
OR 0.671 0.610 0.662 0.574 0.631 0.587 0.705 0.595 0.643 0.616 0.677 0.601<br />
PU 0.347 0.278 0.266 0.223 0.308 0.247 0.299 0.251 0.252 0.158 0.203 0.130<br />
RJ 0.637 0.598 0.579 0.562 0.574 0.536 0.643 0.627 0.537 0.491 0.543 0.521<br />
TN 0.504 0.491 0.493 0.469 0.469 0.461 0.531 0.500 0.467 0.427 0.493 0.435<br />
UP 0.666 0.455 0.577 0.406 0.595 0.408 0.645 0.453 0.584 0.370 0.563 0.368<br />
WB 0.457 0.414 0.442 0.394 0.420 0.375 0.481 0.435 0.418 0.400 0.443 0.421<br />
IND 0.542 0.538 0.504 0.476 0.495 0.494 0.552 0.518 0.482 0.472 0.492 0.452
under all <strong>the</strong> variants, just as Kerala, <strong>the</strong> Punjab<br />
and all <strong>the</strong> “weaker” <strong>State</strong>s did.<br />
The performance <strong>of</strong> Karnataka may<br />
come as a surprise to those impressed with <strong>the</strong><br />
ec<strong>on</strong>omic growth <strong>of</strong> <strong>the</strong> <strong>State</strong> between 1993-<br />
94 and 2004-05, a growth that was more-over<br />
urban-centered, with Bangalore be<strong>in</strong>g a key site.<br />
Perhaps <strong>the</strong> results reviewed here should cause<br />
less complaceny about <strong>the</strong> growth process “tak<strong>in</strong>g<br />
care” <strong>of</strong> food security even <strong>in</strong> urban sett<strong>in</strong>gs. The<br />
improvement <strong>of</strong> <strong>the</strong> more backward <strong>State</strong>s is no<br />
doubt <strong>in</strong> part because <strong>the</strong>y were so backward<br />
to beg<strong>in</strong> with, but may also reflect a pattern <strong>of</strong><br />
urbanisati<strong>on</strong> over <strong>the</strong> period under c<strong>on</strong>siderati<strong>on</strong><br />
<strong>in</strong>volv<strong>in</strong>g rapid growth <strong>in</strong> <strong>on</strong>e or two major urban<br />
centres accompanied by <strong>in</strong>vestments <strong>in</strong> urban<br />
civic <strong>in</strong>frastructure. This issue is worth pursu<strong>in</strong>g <strong>in</strong><br />
future research. Uttar Pradesh <strong>in</strong> particular needs<br />
to be closely studied <strong>in</strong> this regard.<br />
Hav<strong>in</strong>g reviewed and recognised <strong>the</strong> general<br />
improvement <strong>in</strong> <strong>the</strong> state <strong>of</strong> urban food <strong>in</strong>security<br />
<strong>in</strong> terms <strong>of</strong> <strong>the</strong> chosen <strong>in</strong>dex <strong>in</strong> all its variants,<br />
it must never<strong>the</strong>less be po<strong>in</strong>ted out that <strong>the</strong><br />
improvement is far from commensurate with <strong>the</strong><br />
rate <strong>of</strong> ec<strong>on</strong>omic growth that has occurred over <strong>the</strong><br />
URBAN FOOD INSECURITY ACROSS STATES 89<br />
period under c<strong>on</strong>siderati<strong>on</strong>. Moreover, <strong>the</strong> values <strong>of</strong><br />
many <strong>of</strong> <strong>the</strong> <strong>in</strong>dicators – especially <strong>the</strong> nutriti<strong>on</strong>al<br />
outcome <strong>in</strong>dicators – are scandalously high <strong>in</strong> <strong>the</strong><br />
case <strong>of</strong> most <strong>State</strong>s. The nature <strong>of</strong> urban growth,<br />
<strong>in</strong>volv<strong>in</strong>g growth <strong>of</strong> employment mostly <strong>in</strong> <strong>the</strong><br />
unorganised sector and <strong>of</strong> <strong>in</strong>formal employment<br />
even <strong>in</strong> <strong>the</strong> organised sector, implies c<strong>on</strong>siderable<br />
<strong>in</strong>security <strong>of</strong> earn<strong>in</strong>gs for <strong>the</strong> workforce. Inadequate<br />
<strong>in</strong>vestments <strong>in</strong> urban civic <strong>in</strong>frastructure has lead<br />
to poor envir<strong>on</strong>mental hygiene. The growth <strong>of</strong><br />
very poorly served urban slums, both recognised<br />
and o<strong>the</strong>rwise, has also been a key factor <strong>in</strong> <strong>the</strong><br />
tardy improvement <strong>in</strong> <strong>the</strong> urban food security<br />
situati<strong>on</strong>. It needs also to be emphasised that<br />
some variants <strong>of</strong> <strong>the</strong> <strong>in</strong>dex may have overstated<br />
<strong>the</strong> improvement <strong>in</strong> urban food security <strong>in</strong> so far<br />
as <strong>the</strong>y rely <strong>on</strong> certa<strong>in</strong> <strong>in</strong>put <strong>in</strong>dicators such as<br />
access to safe dr<strong>in</strong>k<strong>in</strong>g water and access to toilets<br />
where <strong>the</strong> numbers thrown up by <strong>of</strong>fical data may<br />
not reflect <strong>the</strong> actual situati<strong>on</strong> <strong>on</strong> <strong>the</strong> ground <strong>in</strong><br />
terms <strong>of</strong> <strong>the</strong> functi<strong>on</strong><strong>in</strong>g <strong>of</strong> <strong>the</strong> facilities assumed<br />
present.<br />
Therefore, <strong>the</strong> problem <strong>of</strong> urban food<br />
<strong>in</strong>security c<strong>on</strong>t<strong>in</strong>ues to rema<strong>in</strong> a massive<br />
challenge.
CHAPTER 4<br />
Public <strong>Food</strong> Delivery Systems <strong>in</strong><br />
<strong>Urban</strong> <strong>India</strong><br />
In an ec<strong>on</strong>omy where a substantial proporti<strong>on</strong><br />
<strong>of</strong> <strong>the</strong> populati<strong>on</strong> is food <strong>in</strong>secure and where markets<br />
for foodgra<strong>in</strong>s are poorly <strong>in</strong>tegrated, besides be<strong>in</strong>g<br />
characterised by significant elements <strong>of</strong> m<strong>on</strong>opoly,<br />
<strong>the</strong>re is an obvious need for public food delivery<br />
systems. Historically, <strong>the</strong> most important <strong>of</strong> such<br />
systems <strong>in</strong> <strong>India</strong> has been PDS.<br />
It is sometimes argued that <strong>the</strong> existence <strong>of</strong><br />
a large number <strong>of</strong> retail outlets <strong>in</strong> urban centres<br />
makes PDS unnecessary. There is little merit <strong>in</strong><br />
this debate, given <strong>the</strong> huge problems <strong>of</strong> access that<br />
<strong>the</strong> urban poor face. It can, <strong>in</strong> fact, be claimed that<br />
public food delivery systems have an even more<br />
important role <strong>in</strong> <strong>the</strong> urban c<strong>on</strong>text vis-à-vis <strong>the</strong><br />
rural, where some amount <strong>of</strong> own or subsistence<br />
cultivati<strong>on</strong> and c<strong>on</strong>sumpti<strong>on</strong> may be expected<br />
<strong>of</strong> owner-cultivator households and <strong>the</strong>re is also<br />
sometimes payment <strong>in</strong> k<strong>in</strong>d for labour. The urban<br />
populati<strong>on</strong>, <strong>on</strong> <strong>the</strong> o<strong>the</strong>r hand, is largely dependent<br />
<strong>on</strong> <strong>the</strong> market, mak<strong>in</strong>g <strong>the</strong> urban poor <strong>in</strong> particular<br />
more vulnerable to price shocks and food and<br />
nutriti<strong>on</strong> <strong>in</strong>security 23 . In any event, PDS has been<br />
an extremely important <strong>in</strong>strument <strong>of</strong> food security<br />
<strong>in</strong> urban <strong>India</strong> for more than six decades now, and<br />
it <strong>the</strong>refore becomes essential to take a look at its<br />
functi<strong>on</strong><strong>in</strong>g <strong>in</strong> urban <strong>India</strong>.<br />
There is rich experience from countries<br />
across <strong>the</strong> world with respect to <strong>the</strong> modes <strong>of</strong> public<br />
provisi<strong>on</strong><strong>in</strong>g <strong>of</strong> food to address food <strong>in</strong>security 24 .<br />
In <strong>India</strong>, besides PDS, ICDS and MDMS are <strong>the</strong><br />
most important schemes <strong>of</strong> public provisi<strong>on</strong><strong>in</strong>g<br />
<strong>of</strong> food. Emergency feed<strong>in</strong>g programmes are<br />
also undertaken to reach <strong>the</strong> affected populati<strong>on</strong><br />
dur<strong>in</strong>g times <strong>of</strong> natural calamities like floods or<br />
cycl<strong>on</strong>es.<br />
The <str<strong>on</strong>g>Report</str<strong>on</strong>g> <strong>on</strong> <strong>the</strong> <strong>State</strong> <strong>of</strong> <strong>Food</strong> <strong>Insecurity</strong><br />
<strong>in</strong> Rural <strong>India</strong> (RSFIRI) (MSSRF-WFP 2008)<br />
dealt with <strong>the</strong> three largest public food delivery<br />
systems <strong>in</strong> <strong>the</strong> country <strong>in</strong> great detail – PDS, ICDS<br />
and MDMS – trac<strong>in</strong>g <strong>the</strong>ir history and evoluti<strong>on</strong><br />
23 FAO’s latest report <strong>on</strong> <strong>the</strong> <strong>State</strong> <strong>of</strong> <strong>Food</strong> <strong>Insecurity</strong> <strong>in</strong> <strong>the</strong> World (SOFI), states: ‘The ec<strong>on</strong>omic crisis will negatively affect<br />
large segments <strong>of</strong> <strong>the</strong> populati<strong>on</strong> <strong>in</strong> develop<strong>in</strong>g countries. The positi<strong>on</strong> <strong>of</strong> those who were hurt most by higher food prices (<strong>the</strong><br />
rural landless, female-headed households and <strong>the</strong> urban poor) is particularly precarious because <strong>the</strong>y have already approached,<br />
or <strong>in</strong> many cases reached, <strong>the</strong> limit <strong>of</strong> <strong>the</strong>ir ability to cope dur<strong>in</strong>g <strong>the</strong> food crisis. Am<strong>on</strong>g <strong>the</strong>se groups, <strong>the</strong> urban poor may<br />
experience <strong>the</strong> most severe problems because lower export demand and reduced FDI are more likely to cause employment to<br />
fall <strong>in</strong> urban areas, which are more closely c<strong>on</strong>nected to world markets than rural areas’ (FAO 2009).<br />
24 FAO advocates a tw<strong>in</strong>-track approach to achiev<strong>in</strong>g food security and <strong>the</strong> realisati<strong>on</strong> <strong>of</strong> <strong>the</strong> right to food. The first track<br />
<strong>in</strong>cludes measures to <strong>in</strong>crease producti<strong>on</strong>, <strong>in</strong>clud<strong>in</strong>g by small farmers, as well as improve <strong>in</strong>comes. The sec<strong>on</strong>d track <strong>in</strong>cludes<br />
food safety nets, or measures to broaden food access immediately for <strong>the</strong> food <strong>in</strong>secure (FAO 2004).
92 REPORT ON THE STATE OF FOOD INSECURITY IN URBAN INDIA<br />
over <strong>the</strong> years, <strong>the</strong>ir performance, lacunae and<br />
suggesti<strong>on</strong>s for better outreach and delivery.<br />
Follow<strong>in</strong>g <strong>the</strong> descripti<strong>on</strong> <strong>of</strong> each programme<br />
<strong>in</strong> three separate chapters, it looked at <strong>the</strong>ir<br />
functi<strong>on</strong><strong>in</strong>g with specific reference to rural areas.<br />
The reader is <strong>the</strong>refore referred to RSFIRI for a<br />
detailed descripti<strong>on</strong> <strong>of</strong> <strong>the</strong>se programmes. This<br />
chapter <strong>on</strong> urban food delivery systems, based<br />
<strong>on</strong> available sec<strong>on</strong>dary data, focuses primarily<br />
<strong>on</strong> <strong>the</strong> functi<strong>on</strong><strong>in</strong>g <strong>of</strong> PDS, ICDS and MDMS <strong>in</strong><br />
urban areas.<br />
4.1 Public Distributi<strong>on</strong> System<br />
PDS was first <strong>in</strong>troduced as a measure to<br />
ensure foodgra<strong>in</strong> availability <strong>in</strong> urban areas. Its<br />
orig<strong>in</strong>s <strong>in</strong> <strong>India</strong> date back to <strong>the</strong> Sec<strong>on</strong>d World War<br />
period, when <strong>the</strong> col<strong>on</strong>ial government undertook<br />
public distributi<strong>on</strong> <strong>of</strong> foodgra<strong>in</strong>s <strong>in</strong> 1939 as a<br />
wartime rati<strong>on</strong><strong>in</strong>g measure to ensure foodgra<strong>in</strong><br />
availability and distributi<strong>on</strong> am<strong>on</strong>g <strong>the</strong> urban<br />
populati<strong>on</strong> <strong>of</strong> Bombay (now Mumbai). With<br />
<strong>in</strong>flati<strong>on</strong> spirall<strong>in</strong>g and <strong>the</strong> food situati<strong>on</strong><br />
deteriorat<strong>in</strong>g persistently <strong>in</strong> many parts <strong>of</strong> <strong>the</strong><br />
country, <strong>the</strong> <strong>Food</strong>gra<strong>in</strong>s Policy Committee (1943)<br />
recommended <strong>the</strong> <strong>in</strong>troducti<strong>on</strong> <strong>of</strong> rati<strong>on</strong><strong>in</strong>g <strong>in</strong> urban<br />
centres with a populati<strong>on</strong> <strong>of</strong> more than 100,000.<br />
The c<strong>on</strong>sequent food distributi<strong>on</strong> system was<br />
exclusively focused <strong>on</strong> <strong>the</strong> urban centres (Plann<strong>in</strong>g<br />
Commissi<strong>on</strong> 2005). It ensured some degree <strong>of</strong><br />
equitable distributi<strong>on</strong> <strong>of</strong> foodgra<strong>in</strong>s am<strong>on</strong>g urban<br />
c<strong>on</strong>sumers <strong>in</strong> <strong>the</strong> c<strong>on</strong>text <strong>of</strong> ris<strong>in</strong>g prices. Till <strong>the</strong><br />
mid-1960s, PDS c<strong>on</strong>t<strong>in</strong>ued to be largely c<strong>on</strong>f<strong>in</strong>ed<br />
to urban areas, <strong>the</strong> aim be<strong>in</strong>g to cater to <strong>the</strong> food<br />
needs <strong>of</strong> <strong>the</strong> urban populati<strong>on</strong> as well as those <strong>in</strong><br />
highly food-deficit areas. Post Green Revoluti<strong>on</strong>,<br />
<strong>the</strong> move came towards develop<strong>in</strong>g a system <strong>of</strong><br />
procurement and countrywide public distributi<strong>on</strong><br />
<strong>of</strong> foodgra<strong>in</strong>s at affordable prices to <strong>the</strong> urban<br />
work<strong>in</strong>g people <strong>in</strong> <strong>the</strong> first <strong>in</strong>stance. However, it<br />
was <strong>on</strong>ly <strong>in</strong> <strong>the</strong> 1980s that expansi<strong>on</strong> <strong>on</strong> a large<br />
scale to cover n<strong>on</strong>-urban and n<strong>on</strong>-food-deficit areas<br />
took place. In a major policy shift, a targeted PDS<br />
(TPDS) was <strong>in</strong>troduced <strong>in</strong> 1997 by <strong>the</strong> Government<br />
<strong>of</strong> <strong>India</strong>, and most <strong>State</strong>s fell <strong>in</strong> l<strong>in</strong>e 25 .<br />
Data is available from <strong>the</strong> 61st round <strong>of</strong><br />
<strong>the</strong> Nati<strong>on</strong>al Sample Survey for reference year<br />
2004-05 <strong>on</strong> <strong>the</strong> extent to which urban households<br />
access PDS for rice and wheat, and <strong>on</strong> <strong>the</strong> share<br />
<strong>of</strong> c<strong>on</strong>sumpti<strong>on</strong> accounted for by PDS purchases.<br />
Some <strong>of</strong> this data has been utilised <strong>in</strong> <strong>the</strong> discussi<strong>on</strong><br />
that follows.<br />
Tables 4.1 and 4.2, respectively, show <strong>the</strong><br />
percentage <strong>of</strong> urban households c<strong>on</strong>sum<strong>in</strong>g rice<br />
from PDS and <strong>the</strong> percentage <strong>of</strong> quantity purchased<br />
from PDS to total household rice c<strong>on</strong>sumpti<strong>on</strong><br />
across <strong>the</strong> major <strong>State</strong>s <strong>of</strong> <strong>the</strong> country. Tables 4.3<br />
and 4.4 show <strong>the</strong> corresp<strong>on</strong>d<strong>in</strong>g figures for wheat.<br />
At <strong>the</strong> all-<strong>India</strong> level, just about 26 per<br />
cent <strong>of</strong> urban households <strong>in</strong> <strong>the</strong> bottom 30 per<br />
cent <strong>of</strong> m<strong>on</strong>thly per capita expenditure class<br />
(MPCE) and 13 per cent <strong>of</strong> all urban households<br />
were found to be c<strong>on</strong>sum<strong>in</strong>g rice from PDS. The<br />
percentage <strong>of</strong> households access<strong>in</strong>g rice from<br />
PDS am<strong>on</strong>g <strong>the</strong> bottom 30 per cent <strong>of</strong> MPCE was<br />
generally much higher <strong>in</strong> <strong>the</strong> sou<strong>the</strong>rn <strong>State</strong>s. The<br />
highest percentage was <strong>in</strong> Tamil Nadu at 78 per<br />
cent, followed by Andhra Pradesh (57 per cent),<br />
Kerala (53 per cent), and Karnataka (46 per cent).<br />
The quantitative share <strong>of</strong> PDS rice <strong>in</strong> total rice<br />
c<strong>on</strong>sumpti<strong>on</strong> am<strong>on</strong>g <strong>the</strong> bottom 30 per cent <strong>of</strong><br />
MPCE was also <strong>the</strong> highest <strong>in</strong> <strong>the</strong>se four <strong>State</strong>s,<br />
rang<strong>in</strong>g between 47 per cent <strong>in</strong> Tamil Nadu and 38<br />
per cent <strong>in</strong> Andhra Pradesh. About 25 per cent or<br />
25 Tamil Nadu has c<strong>on</strong>t<strong>in</strong>ued with a universal PDS. While <strong>the</strong> <strong>State</strong> is required to classify rati<strong>on</strong> cards as APL and BPL, PDS rati<strong>on</strong> is given<br />
also to APL cardholders at <strong>the</strong> same price. S<strong>in</strong>ce <strong>the</strong> Government <strong>of</strong> <strong>India</strong> charges <strong>the</strong> <strong>State</strong> government <strong>the</strong> APL price for APL supplies,<br />
<strong>the</strong> <strong>State</strong> has to <strong>in</strong>cur <strong>the</strong> subsidy expenditure <strong>in</strong>volved <strong>in</strong> not charg<strong>in</strong>g <strong>the</strong> APL rati<strong>on</strong> cardholders a different price from that it charges<br />
BPL cardholders.
Sl.<br />
No.<br />
<strong>State</strong>s<br />
PUBLIC FOOD DELIVERY SYSTEMS IN URBAN INDIA 93<br />
more <strong>of</strong> households <strong>in</strong> <strong>the</strong> middle 40 per cent <strong>of</strong> On <strong>the</strong> o<strong>the</strong>r hand, <strong>in</strong> <strong>State</strong>s such as <strong>the</strong> Punjab<br />
MPCE <strong>in</strong> <strong>the</strong>se <strong>State</strong>s also c<strong>on</strong>sumed PDS rice, <strong>the</strong> and Haryana hardly any household, irrespective <strong>of</strong><br />
highest percentage be<strong>in</strong>g <strong>in</strong> Tamil Nadu at 57 per c<strong>on</strong>sumpti<strong>on</strong> expenditure classes, depended <strong>on</strong><br />
cent followed by Andhra Pradesh at 33 per cent. PDS for <strong>the</strong>ir rice c<strong>on</strong>sumpti<strong>on</strong>.<br />
Table 4.1<br />
Percentage <strong>of</strong> <strong>Urban</strong> Households <str<strong>on</strong>g>Report</str<strong>on</strong>g><strong>in</strong>g C<strong>on</strong>sumpti<strong>on</strong> <strong>of</strong> Rice from PDS, 2004-05<br />
Percentage <strong>of</strong> urban households report<strong>in</strong>g c<strong>on</strong>sumpti<strong>on</strong> <strong>of</strong> rice<br />
from PDS across different c<strong>on</strong>sumpti<strong>on</strong> expenditure classes<br />
Bottom 30% Middle 40% Top 30% All<br />
1 Andhra Pradesh 57.27 32.82 6.24 31.10<br />
2 Assam 11.39 0.32 0.00 2.30<br />
3 Bihar 5.56 1.67 0.00 2.13<br />
4 Gujarat 25.02 8.29 0.58 7.20<br />
5 Haryana 0.10 0.00 0.00 0.00<br />
6 Karnataka 45.95 23.32 3.50 21.00<br />
7 Kerala 53.38 28.18 9.36 23.30<br />
8 Madhya Pradesh 21.56 6.42 1.27 10.63<br />
9 Maharashtra 21.39 4.42 0.56 6.00<br />
10 Orissa 12.27 1.08 0.51 5.80<br />
11 Punjab 0.00 0.20 0.03 0.10<br />
12 Rajasthan 0.37 0.04 0.09 0.20<br />
13 Tamil Nadu 77.74 57.30 20.90 47.70<br />
14 Uttar Pradesh 4.68 1.50 0.41 2.04<br />
15 West Bengal 13.96 3.82 2.37 5.40<br />
<strong>India</strong> 25.67 14.15 4.17 13.10<br />
Source: NSSO 2007c<br />
Sl.<br />
No.<br />
Table 4.2<br />
Importance <strong>of</strong> PDS Rice C<strong>on</strong>sumpti<strong>on</strong> am<strong>on</strong>g <strong>Urban</strong> Households, 2004-05<br />
<strong>State</strong>s<br />
Percentage <strong>of</strong> PDS rice c<strong>on</strong>sumpti<strong>on</strong> to total rice c<strong>on</strong>sumpti<strong>on</strong><br />
across different c<strong>on</strong>sumpti<strong>on</strong> expenditure classes<br />
Bottom 30% Middle 40% Top 30% All<br />
1 Andhra Pradesh 38.30 26.11 6.39 25.20<br />
2 Assam 10.47 0.33 0.00 2.44<br />
3 Bihar 5.36 1.72 0.00 2.24<br />
4 Gujarat 22.30 8.10 0.64 7.33<br />
5 Haryana 0.12 0.00 0.00 0.00<br />
6 Karnataka 39.50 20.77 3.93 20.17<br />
7 Kerala 40.93 23.85 9.66 21.18<br />
8 Madhya Pradesh 19.58 6.38 1.35 10.39<br />
9 Maharashtra 20.89 4.49 0.63 6.32<br />
10 Orissa 11.28 1.20 0.56 5.89<br />
11 Punjab 0.00 0.22 0.04 0.12<br />
12 Rajasthan 0.73 0.06 0.11 0.29<br />
13 Tamil Nadu 47.31 38.23 19.43 34.89<br />
14 Uttar Pradesh 4.75 1.57 0.43 2.12<br />
15 West Bengal 12.65 3.95 2.54 5.50<br />
<strong>India</strong> 23.00 13.39 4.49 12.82<br />
Source: NSSO 2007c
94 REPORT ON THE STATE OF FOOD INSECURITY IN URBAN INDIA<br />
Sl.<br />
No.<br />
Sl.<br />
No.<br />
Table 4.3<br />
Percentage <strong>of</strong> <strong>Urban</strong> Households <str<strong>on</strong>g>Report</str<strong>on</strong>g><strong>in</strong>g C<strong>on</strong>sumpti<strong>on</strong> <strong>of</strong> Wheat from PDS, 2004-05<br />
Table 4.4<br />
Importance <strong>of</strong> PDS Wheat C<strong>on</strong>sumpti<strong>on</strong> am<strong>on</strong>g <strong>Urban</strong> Households, 2004-05<br />
<strong>State</strong>s<br />
Percentage <strong>of</strong> PDS wheat c<strong>on</strong>sumpti<strong>on</strong> to total wheat<br />
c<strong>on</strong>sumpti<strong>on</strong> across different c<strong>on</strong>sumpti<strong>on</strong> expenditure classes<br />
Bottom 30% Middle 40% Top 30% All<br />
1 Andhra Pradesh 0.73 1.13 1.52 1.25<br />
2 Assam 0.00 0.73 0.03 0.38<br />
3 Bihar 3.63 1.98 0.44 2.01<br />
4 Gujarat 21.62 7.34 1.03 7.02<br />
5 Haryana 15.69 4.54 1.28 5.15<br />
6 Karnataka 44.62 17.06 2.10 17.44<br />
7 Kerala 31.36 19.67 10.92 16.53<br />
8 Madhya Pradesh 18.60 4.46 1.70 8.69<br />
9 Maharashtra 21.17 6.41 1.34 7.40<br />
10 Orissa 0.31 0.91 3.16 1.47<br />
11 Punjab 0.51 0.86 0.35 0.62<br />
12 Rajasthan 3.02 2.35 0.37 1.98<br />
13 Tamil Nadu 27.63 23.51 8.98 17.17<br />
14 Uttar Pradesh 3.65 1.90 1.08 2.37<br />
15 West Bengal 11.19 3.39 1.38 4.21<br />
<strong>India</strong> 13.95 6.75 2.42 6.80<br />
Source: NSSO 2007c<br />
<strong>State</strong>s<br />
Percentage <strong>of</strong> urban households report<strong>in</strong>g c<strong>on</strong>sumpti<strong>on</strong> <strong>of</strong> wheat from<br />
PDS across different c<strong>on</strong>sumpti<strong>on</strong> expenditure classes<br />
Bottom 30% Middle 40% Top 30% All<br />
1 Andhra Pradesh 0.26 0.64 1.11 0.70<br />
2 Assam 0.00 0.60 0.03 0.30<br />
3 Bihar 3.51 1.80 0.38 1.84<br />
4 Gujarat 23.99 7.39 0.92 6.80<br />
5 Haryana 17.01 4.68 1.23 5.20<br />
6 Karnataka 34.70 14.96 1.76 14.60<br />
7 Kerala 17.49 14.40 8.66 12.10<br />
8 Madhya Pradesh 16.58 4.42 1.54 8.19<br />
9 Maharashtra 21.60 6.17 1.17 6.90<br />
10 Orissa 0.16 0.71 2.72 1.00<br />
11 Punjab 0.51 0.86 0.33 0.60<br />
12 Rajasthan 2.96 2.31 0.34 1.90<br />
13 Tamil Nadu 10.31 15.00 6.75 10.70<br />
14 Uttar Pradesh 4.02 1.84 1.03 2.32<br />
15 West Bengal 9.04 2.80 1.17 3.50<br />
<strong>India</strong> 11.50 5.84 2.07 5.80<br />
Source: NSSO 2007c
PUBLIC FOOD DELIVERY SYSTEMS IN URBAN INDIA 95<br />
A comparis<strong>on</strong> <strong>of</strong> Tables 4.1 and 4.3 <strong>in</strong>dicate<br />
that a far smaller proporti<strong>on</strong> <strong>of</strong> households resort<br />
to PDS for wheat compared to rice across all <strong>the</strong><br />
<strong>State</strong>s, except Haryana. In <strong>the</strong> country as a whole,<br />
while <strong>on</strong>e-fourth <strong>of</strong> <strong>the</strong> bottom 30 per cent <strong>of</strong><br />
MPCE reported c<strong>on</strong>sumpti<strong>on</strong> <strong>of</strong> rice from PDS, <strong>the</strong><br />
corresp<strong>on</strong>d<strong>in</strong>g percentage for wheat was 11.5 per<br />
cent. 35 per cent households <strong>in</strong> <strong>the</strong> bottom 30 per<br />
cent <strong>of</strong> MPCE class <strong>in</strong> Karnataka and 24 per cent<br />
<strong>in</strong> Gujarat reported access<strong>in</strong>g wheat from PDS.<br />
Maharashtra reported 21.60 per cent <strong>of</strong> households<br />
<strong>in</strong> <strong>the</strong> same category. Eight major <strong>State</strong>s, n<strong>on</strong>e<br />
from <strong>the</strong> south <strong>of</strong> <strong>the</strong> country, reported less than<br />
10 per cent <strong>of</strong> households <strong>in</strong> <strong>the</strong> bottom 30 per<br />
cent <strong>of</strong> MPCE access<strong>in</strong>g wheat from PDS. On<br />
<strong>the</strong> o<strong>the</strong>r hand, around 15 per cent <strong>of</strong> households<br />
<strong>in</strong> <strong>the</strong> middle 40 per cent <strong>of</strong> MPCE category <strong>in</strong><br />
Tamil Nadu, Kerala and Karnataka, which are not<br />
traditi<strong>on</strong>ally wheat-c<strong>on</strong>sum<strong>in</strong>g <strong>State</strong>s, reported<br />
c<strong>on</strong>sumpti<strong>on</strong> <strong>of</strong> wheat from PDS.<br />
The share <strong>of</strong> PDS wheat <strong>in</strong> total wheat<br />
c<strong>on</strong>sumpti<strong>on</strong> was 45 per cent for <strong>the</strong> bottom 30 per<br />
cent <strong>of</strong> MPCE <strong>in</strong> Karnataka followed by 28 per cent<br />
<strong>in</strong> Tamil Nadu. While Tamil Nadu ranks way above<br />
<strong>the</strong> rest <strong>of</strong> <strong>the</strong> <strong>State</strong>s as regards rice c<strong>on</strong>sumpti<strong>on</strong><br />
from PDS and performs better than <strong>the</strong> all-<strong>India</strong><br />
average with regard to wheat c<strong>on</strong>sumpti<strong>on</strong>, <strong>the</strong><br />
Punjab is at <strong>the</strong> opposite end with less than <strong>on</strong>e per<br />
cent <strong>of</strong> urban households report<strong>in</strong>g c<strong>on</strong>sumpti<strong>on</strong><br />
<strong>of</strong> wheat or rice from PDS.<br />
Data from <strong>the</strong> 61 st Round <strong>of</strong> <strong>the</strong> NSSO<br />
perta<strong>in</strong><strong>in</strong>g to <strong>the</strong> year 2004-05 showed that<br />
expenditure <strong>on</strong> food accounted for 50 per cent or<br />
more <strong>of</strong> <strong>the</strong> total expenditure <strong>of</strong> urban households.<br />
The rise <strong>in</strong> food prices from 2009 is bound to skew<br />
<strong>the</strong> expenditure pattern <strong>of</strong> <strong>the</strong>se households fur<strong>the</strong>r.<br />
The latest <str<strong>on</strong>g>Report</str<strong>on</strong>g> <strong>on</strong> <strong>the</strong> <strong>State</strong> <strong>of</strong> <strong>Food</strong> <strong>Insecurity</strong><br />
<strong>in</strong> <strong>the</strong> World brought out by FAO draws attenti<strong>on</strong><br />
to this aspect: ‘In try<strong>in</strong>g to cope with <strong>the</strong> burden <strong>of</strong><br />
c<strong>on</strong>secutive food and ec<strong>on</strong>omic crises, poor people<br />
reduce <strong>the</strong>ir dietary diversity and spend<strong>in</strong>g <strong>on</strong><br />
essential items such as educati<strong>on</strong> and health care.<br />
These cop<strong>in</strong>g mechanisms were stra<strong>in</strong>ed dur<strong>in</strong>g<br />
<strong>the</strong> food crisis, and <strong>the</strong> poor will now be forced<br />
to draw <strong>on</strong> <strong>the</strong>ir meagre assets even more deeply,<br />
creat<strong>in</strong>g poverty traps and negatively affect<strong>in</strong>g<br />
l<strong>on</strong>ger-term food security. Infant mortality will<br />
<strong>in</strong>crease, with girls be<strong>in</strong>g more affected than boys’<br />
(FAO 2009).<br />
4.1.1 The Case for a Universal PDS –<br />
Evidence from <strong>Urban</strong> <strong>India</strong><br />
The argument made by several scholars<br />
for a return to a universal PDS <strong>in</strong> <strong>the</strong> <strong>in</strong>terest <strong>of</strong><br />
ensur<strong>in</strong>g food security for all becomes even more<br />
relevant <strong>in</strong> this c<strong>on</strong>text 26 . RSFIRI had this as a<br />
key recommendati<strong>on</strong> for ensur<strong>in</strong>g food security.<br />
Data reveals that TPDS has led to <strong>the</strong> exclusi<strong>on</strong> <strong>of</strong><br />
many from <strong>the</strong> purview <strong>of</strong> PDS itself. As emphasised<br />
by Madhura Swam<strong>in</strong>athan (2008), ‘dur<strong>in</strong>g periods<br />
<strong>of</strong> high <strong>in</strong>flati<strong>on</strong> <strong>in</strong> food prices, governments must<br />
provide a basic m<strong>in</strong>imum quantity <strong>of</strong> foodgra<strong>in</strong><br />
and o<strong>the</strong>r food items at low prices through public<br />
distributi<strong>on</strong> systems to low-<strong>in</strong>come, food-<strong>in</strong>secure,<br />
and vulnerable populati<strong>on</strong>s. In <strong>India</strong>, <strong>the</strong> ostensible<br />
purpose <strong>of</strong> <strong>the</strong> Targeted Public Distributi<strong>on</strong> System<br />
(TPDS) was to take food to <strong>the</strong> poor; <strong>in</strong> practice, it<br />
has resulted <strong>in</strong> <strong>the</strong> large-scale exclusi<strong>on</strong> <strong>of</strong> <strong>the</strong> poor<br />
and food-<strong>in</strong>secure from <strong>the</strong> public food system’<br />
(Swam<strong>in</strong>athan 2008).<br />
Data available from <strong>the</strong> NSSO 61 st Round<br />
clearly highlighted this. At <strong>the</strong> all-<strong>India</strong> level,<br />
26 Jayati Ghosh at <strong>the</strong> V P Ch<strong>in</strong>tan Memorial Lecture <strong>in</strong> Chennai <strong>on</strong> 23 October 2009 <strong>on</strong> “Global food crisis and food security <strong>in</strong> <strong>India</strong>”,<br />
presented a calculati<strong>on</strong> to show that revert<strong>in</strong>g to a universal PDS will cost just about 1.5 per cent <strong>of</strong> GDP, much less than <strong>the</strong> amount given<br />
as tax c<strong>on</strong>cessi<strong>on</strong>s to <strong>the</strong> well-to-do <strong>in</strong> recent years.
96 REPORT ON THE STATE OF FOOD INSECURITY IN URBAN INDIA<br />
<strong>the</strong> percentage <strong>of</strong> populati<strong>on</strong> with BPL and AAY<br />
(Antyodaya Anna Yojana) cards amounted to just<br />
11.3 per cent (Table 4.5). Households with APL<br />
cards be<strong>in</strong>g effectively excluded from PDS under<br />
<strong>the</strong> targeted system operative <strong>in</strong> most <strong>State</strong>s, <strong>the</strong><br />
majority <strong>of</strong> urban households <strong>in</strong> <strong>India</strong> fall under<br />
this category. In l<strong>in</strong>e with this, look<strong>in</strong>g at <strong>the</strong> social<br />
categories, even am<strong>on</strong>g <strong>the</strong> most deprived secti<strong>on</strong>s<br />
<strong>of</strong> <strong>the</strong> populati<strong>on</strong>, <strong>on</strong>e f<strong>in</strong>ds that 85.1 per cent <strong>of</strong><br />
ST households and 81.1 per cent <strong>of</strong> SC households<br />
<strong>in</strong> urban areas ei<strong>the</strong>r had no card or possessed an<br />
APL card.<br />
From <strong>the</strong> occupati<strong>on</strong>al angle, NSSO def<strong>in</strong>es<br />
four types <strong>of</strong> urban households – self-employed,<br />
casual labour, regular wage/salary earn<strong>in</strong>g and o<strong>the</strong>r<br />
households. A household which does not have any<br />
<strong>in</strong>come from ec<strong>on</strong>omic activities is assigned to <strong>the</strong><br />
‘o<strong>the</strong>rs’ category. In <strong>the</strong> country as a whole, 26 per<br />
cent <strong>of</strong> casual labour households had BPL cards<br />
and 3 per cent had AAY cards, <strong>the</strong> highest am<strong>on</strong>g<br />
urban households, <strong>in</strong>dicat<strong>in</strong>g that <strong>the</strong>ir relatively<br />
greater vulnerability has been factored <strong>in</strong>to <strong>the</strong><br />
system. However, 34 per cent <strong>of</strong> casual labour<br />
households <strong>in</strong> <strong>the</strong> country did not have any rati<strong>on</strong><br />
card. The percentage <strong>of</strong> casual labour households<br />
not possess<strong>in</strong>g a rati<strong>on</strong> card was <strong>the</strong> least <strong>in</strong> Kerala<br />
(17 per cent) followed by Tamil Nadu (20 per cent).<br />
In <strong>India</strong> as a whole, <strong>the</strong> percentage <strong>of</strong> households<br />
hold<strong>in</strong>g any k<strong>in</strong>d <strong>of</strong> rati<strong>on</strong> card was highest am<strong>on</strong>g<br />
self-employed households (74 per cent), about 11<br />
per cent <strong>of</strong> whom held BPL cards 27 . Am<strong>on</strong>g “o<strong>the</strong>r<br />
households”, <strong>on</strong>ly 51 per cent possessed a rati<strong>on</strong><br />
card (Table 4.6).<br />
Madhura Swam<strong>in</strong>athan (2008) has analysed<br />
issues <strong>of</strong> exclusi<strong>on</strong> and <strong>in</strong>clusi<strong>on</strong> <strong>in</strong> PDS <strong>in</strong> rural<br />
<strong>India</strong> by us<strong>in</strong>g <strong>the</strong> <strong>of</strong>ficial rural poverty l<strong>in</strong>e<br />
(an all-<strong>India</strong> level <strong>of</strong> Rs.360 per capita per m<strong>on</strong>th),<br />
and classify<strong>in</strong>g all households with MPCE less<br />
than Rs.365 as “poor” households 28 . This <str<strong>on</strong>g>Report</str<strong>on</strong>g><br />
has carried out a similar exercise for urban areas.<br />
Tak<strong>in</strong>g <strong>the</strong> <strong>of</strong>ficial urban poverty l<strong>in</strong>e (Rs.559<br />
per capita per m<strong>on</strong>th <strong>in</strong> 2004-05), all households<br />
with MPCE less than Rs.580 (c<strong>on</strong>stitut<strong>in</strong>g <strong>the</strong><br />
bottom 30 per cent <strong>of</strong> <strong>the</strong> MPCE class) have<br />
been classified as ‘poor households’ 29 . Def<strong>in</strong><strong>in</strong>g<br />
‘<strong>in</strong>clusi<strong>on</strong>’ as ‘obta<strong>in</strong><strong>in</strong>g a BPL or Antyodaya card’,<br />
it is observed that <strong>on</strong>ly 25.4 per cent <strong>of</strong> <strong>the</strong> bottom<br />
30 per cent MPCE class households possessed<br />
BPL or AAY card. While 28 per cent households<br />
<strong>in</strong> this category possessed no rati<strong>on</strong> card, 46.5<br />
per cent possessed cards o<strong>the</strong>r than BPL or AAY<br />
<strong>on</strong>es. Effectively, <strong>the</strong>refore, with <strong>the</strong> excepti<strong>on</strong> <strong>of</strong><br />
Tamil Nadu 30 which follows a universal PDS<br />
and covers <strong>the</strong> n<strong>on</strong>-BPL and AAY cardholders,<br />
even <strong>the</strong> majority <strong>of</strong> those below <strong>the</strong> <strong>of</strong>ficial<br />
poverty l<strong>in</strong>e were excluded from <strong>the</strong> urban PDS<br />
(Table 4.7). The figure for Rajasthan — where<br />
<strong>on</strong>ly 4.8 per cent <strong>of</strong> <strong>the</strong> bottom 30 per cent <strong>of</strong><br />
<strong>the</strong> MPCE class households possessed a BPL or<br />
AAY card — has been particularly shock<strong>in</strong>g. Only<br />
Andhra Pradesh had 50 per cent <strong>of</strong> <strong>the</strong> populati<strong>on</strong><br />
<strong>in</strong> this category possess<strong>in</strong>g a BPL or AAY card<br />
followed by Kerala at 46.3 per cent and Karnataka<br />
at 40.7 per cent. In all <strong>the</strong> o<strong>the</strong>r <strong>State</strong>s, more than<br />
sixty per cent <strong>of</strong> <strong>the</strong> <strong>of</strong>ficially poor were excluded<br />
from access to PDS.<br />
27 This is quite reveal<strong>in</strong>g, if read toge<strong>the</strong>r with <strong>the</strong> reports <strong>of</strong> <strong>the</strong> Nati<strong>on</strong>al Commissi<strong>on</strong> <strong>on</strong> Enterprises <strong>in</strong> <strong>the</strong> Unorganised Sector (NCEUS).<br />
The latter br<strong>in</strong>gs out <strong>the</strong> precarious nature <strong>of</strong> <strong>the</strong> livelihoods <strong>of</strong> a large majority <strong>of</strong> <strong>the</strong> self-employed.<br />
28 The <strong>of</strong>ficial <strong>India</strong>n poverty l<strong>in</strong>e <strong>in</strong> fact reflects absolute and extreme deprivati<strong>on</strong>.<br />
29 st MPCE classes as del<strong>in</strong>eated by <strong>the</strong> 61 Round <strong>of</strong> NSSO perta<strong>in</strong><strong>in</strong>g to <strong>the</strong> year 2004-05, adopted <strong>the</strong> follow<strong>in</strong>g size classes: Rs.0-335;<br />
335-395; 395 to 485; 485-580. C<strong>on</strong>sider<strong>in</strong>g that Rs.559 (<strong>the</strong> poverty l<strong>in</strong>e) falls <strong>in</strong> <strong>the</strong> MPCE class 485 to 580, all <strong>the</strong> four classes were<br />
c<strong>on</strong>sidered. Needless to say, <strong>the</strong> error <strong>of</strong> <strong>in</strong>clusi<strong>on</strong> <strong>of</strong> n<strong>on</strong>-poor would be m<strong>in</strong>imal <strong>in</strong> this exercise.<br />
30 57.4 per cent <strong>of</strong> <strong>the</strong> bottom 30 per cent <strong>of</strong> MPCE class households possessed o<strong>the</strong>r cards but had access to PDS.
Table 4.5<br />
Some Aspects <strong>on</strong> Possessi<strong>on</strong> <strong>of</strong> Different Types <strong>of</strong> Rati<strong>on</strong> Cards across Social Groups <strong>in</strong> <strong>Urban</strong> Areas, 2004-05<br />
Percentage <strong>of</strong> urban households across different social groups categorised by type <strong>of</strong> rati<strong>on</strong> cards<br />
O<strong>the</strong>r Backward Class O<strong>the</strong>rs All<br />
Scheduled<br />
Caste<br />
Scheduled<br />
Tribe<br />
<strong>State</strong>s<br />
Sl.<br />
No.<br />
No<br />
AAY BPL O<strong>the</strong>r<br />
RC<br />
No<br />
AAY BPL O<strong>the</strong>r<br />
RC<br />
No<br />
AAY BPL O<strong>the</strong>r<br />
RC<br />
No<br />
AAY BPL O<strong>the</strong>r<br />
RC<br />
AAY BPL O<strong>the</strong>r No<br />
RC<br />
PUBLIC FOOD DELIVERY SYSTEMS IN URBAN INDIA 97<br />
1 Andhra Pradesh 0.0 25.8 18.4 55.7 1.0 36.4 15.5 47.1 2.2 32.1 15.4 50.3 1.0 16.0 22.7 60.3 1.5 26.6 18.2 53.7<br />
2 Assam 0.0 1.1 62.8 36.1 1.3 6.2 36.5 56.1 0.3 5.6 45.0 49.0 0.0 2.0 36.8 61.2 0.2 3.2 40.2 56.4<br />
3 Bihar 2.8 19.1 23.6 54.5 3.0 8.0 28.5 60.4 0.1 10.5 38.6 50.7 0.2 1.3 38.5 59.9 0.8 6.6 36.2 56.4<br />
4 Gujarat 0.0 5.7 43.6 50.7 0.0 14.5 45.5 40.0 0.3 17.3 61.6 20.7 0.0 3.5 75.2 21.4 0.1 8.4 67.1 24.4<br />
5 Haryana 0.0 24.3 75.7 0.0 4.2 17.0 58.5 20.4 2.4 11.2 46.9 39.5 0.3 7.3 67.0 25.4 1.5 9.9 60.7 27.9<br />
6 Karnataka 3.2 38.9 16.3 41.7 5.5 25.9 32.7 35.9 2.1 19.4 31.6 47.0 1.2 6.5 34.2 58.2 2.0 14.4 32.6 51.0<br />
7 Kerala 2.0 8.0 60.4 29.7 4.3 43.2 33.9 18.6 0.8 21.8 59.6 17.9 0.2 10.8 67.4 21.6 0.9 19.8 60.2 19.2<br />
8 Madhya Pradesh 2.5 18.0 27.9 51.7 6.2 20.4 35.7 37.7 2.0 16.6 38.8 42.5 0.6 7.5 49.7 42.2 2.0 13.8 41.6 42.6<br />
9 Maharashtra 1.9 11.1 50.0 37.0 0.3 16.9 58.8 24.0 0.6 8.9 63.9 26.6 0.1 4.9 71.6 23.4 0.3 8.0 67.0 24.7<br />
10 Orissa 0.7 19.5 14.3 65.6 1.0 19.4 25.7 53.9 2.1 12.8 28.7 56.3 0.9 6.6 34.2 58.3 1.3 11.8 29.1 57.8<br />
11 Punjab 0.0 2.1 43.8 54.1 0.1 9.2 53.2 37.5 0.0 3.4 61.2 35.5 0.0 1.5 74.1 24.4 0.0 3.9 66.0 30.1<br />
12 Rajasthan 0.0 3.7 48.3 48.0 2.0 3.7 77.3 17.1 0.1 3.2 84.4 12.3 0.3 1.0 84.7 14.0 0.6 2.4 81.8 15.1<br />
13 Tamil Nadu 1.4 10.4 57.8 30.4 1.3 10.8 66.0 21.9 0.5 14.0 63.2 22.3 0.0 5.7 70.6 23.7 0.6 12.8 64.2 22.4<br />
14 Uttar Pradesh 1.3 38.2 31.9 28.6 0.8 19.2 52.3 27.8 0.2 7.5 62.2 30.0 0.4 2.2 67.7 29.8 0.4 6.6 64.1 28.9<br />
15 West Bengal 0.0 20.5 45.9 33.6 0.5 19.2 59.3 21.0 0.4 9.3 65.1 25.2 0.9 5.9 74.4 18.8 0.8 8.8 70.7 19.7<br />
<strong>India</strong> 1.3 13.6 37.6 47.5 1.6 17.3 49.8 31.3 0.9 14.4 51.5 33.2 0.4 5.2 61.8 32.6 0.8 10.5 55.6 33.1<br />
Note: RC- Rati<strong>on</strong> Card; AAY-Antyodaya Anna Yojana; BPL-Below Poverty L<strong>in</strong>e; O<strong>the</strong>rs-Card bel<strong>on</strong>g<strong>in</strong>g to n<strong>on</strong>e <strong>of</strong> <strong>the</strong> menti<strong>on</strong>ed categories<br />
Source: NSSO 2007c
98 REPORT ON THE STATE OF FOOD INSECURITY IN URBAN INDIA<br />
Table 4.6<br />
Some Aspects <strong>on</strong> Possessi<strong>on</strong> <strong>of</strong> Different Types <strong>of</strong> Rati<strong>on</strong> Cards across Various Household Types <strong>in</strong> <strong>Urban</strong> Areas, 2004-05<br />
Percentage <strong>of</strong> households possess<strong>in</strong>g rati<strong>on</strong> cards by different household types <strong>in</strong> urban areas<br />
Self employment Regular employment Casual labour O<strong>the</strong>rs All<br />
<strong>State</strong>s<br />
Sl.<br />
No.<br />
No<br />
AAY BPL O<strong>the</strong>r<br />
RC<br />
No<br />
AAY BPL O<strong>the</strong>r<br />
RC<br />
No<br />
AAY BPL O<strong>the</strong>r<br />
RC<br />
No<br />
AAY BPL O<strong>the</strong>r<br />
RC<br />
AAY BPL O<strong>the</strong>r No<br />
RC<br />
1 Andhra Pradesh 2.3 32.2 19.9 45.5 0.4 19.5 21.7 58.4 3.9 46.2 8.4 40.8 0.1 9.6 13.6 76.8 1.5 26.6 18.2 53.7<br />
2 Assam 0.4 3.1 43.7 52.8 0.2 3.0 38.4 58.4 0.3 12.6 21.7 65.4 0.0 0.6 42.8 56.6 0.2 3.2 40.2 56.4<br />
3 Bihar 1.5 9.2 43.4 45.9 0.2 3.6 37.0 59.1 2.3 18.8 32.0 46.8 0.0 1.0 24.4 74.6 0.8 6.6 36.2 56.4<br />
4 Gujarat 0.1 9.0 77.5 13.4 0.0 5.2 65.7 29.1 0.4 27.2 41.7 30.7 0.4 5.3 45.0 49.2 0.1 8.4 67.1 24.4<br />
5 Haryana 2.1 13.0 69.0 15.9 0.1 4.8 54.2 40.9 7.2 29.1 37.5 26.3 0.3 0.6 78.2 20.9 1.5 9.9 60.7 27.9<br />
6 Karnataka 1.5 13.8 40.1 44.6 0.8 8.5 34.6 56.1 7.7 37.1 18.9 36.4 0.5 7.0 22.5 70.0 2.0 14.4 32.6 51.0<br />
7 Kerala 0.5 16.6 72.5 10.4 1.3 12.7 64.4 21.6 1.3 38.3 43.5 16.9 0.1 7.6 53.9 38.7 0.9 19.8 60.2 19.2<br />
8 Madhya Pradesh 1.9 17.1 49.4 31.8 1.0 8.3 41.2 49.5 6.2 26.1 23.9 43.8 0.6 5.3 40.7 53.3 2.0 13.8 41.6 42.6<br />
9 Maharashtra 0.4 8.4 71.3 20.0 0.0 4.6 71.1 24.3 0.7 25.0 37.1 37.1 1.2 3.7 65.2 29.8 0.3 8.0 67.0 24.7<br />
10 Orissa 2.2 16.5 29.7 51.6 0.1 3.8 35.9 60.2 2.2 23.9 19.6 55.1 0.6 4.8 17.1 77.5 1.3 11.8 29.1 57.8<br />
11 Punjab 0.0 2.4 78.2 19.4 0.0 4.1 57.3 38.7 0.4 16.7 40.0 42.8 0.0 0.6 59.4 40.0 0.0 3.9 66.0 30.1<br />
12 Rajasthan 0.3 2.4 87.9 9.4 0.1 1.0 85.5 13.4 1.8 6.8 67.9 23.5 2.0 2.3 58.6 37.0 0.6 2.4 81.8 15.1<br />
13 Tamil Nadu 0.3 13.0 71.4 15.3 0.1 11.4 63.6 24.9 3.0 21.1 55.8 20.1 0.4 7.2 55.4 37.0 0.6 12.8 64.2 22.4<br />
14 Uttar Pradesh 0.5 6.9 75.0 17.6 0.2 5.8 56.6 37.4 1.2 10.9 63.7 24.1 0.2 3.3 52.8 43.7 0.4 6.6 64.1 28.9<br />
15 West Bengal 0.6 10.3 71.1 18.1 0.4 4.1 77.9 17.6 3.2 22.9 45.7 28.2 0.1 3.7 71.3 24.8 0.8 8.8 70.7 19.7<br />
<strong>India</strong> 0.8 11.4 62.0 25.8 0.3 6.5 57.6 35.6 3.0 26.4 36.8 33.8 0.5 5.0 45.4 49.1 0.8 10.5 55.6 33.1<br />
Note: RC- Rati<strong>on</strong> Card; AAY-Antyodaya Anna Yojana; BPL-Below Poverty L<strong>in</strong>e; O<strong>the</strong>rs-Card bel<strong>on</strong>g<strong>in</strong>g to n<strong>on</strong>e <strong>of</strong> <strong>the</strong> menti<strong>on</strong>ed categories<br />
Source: NSSO 2007c
Sl.<br />
No.<br />
PUBLIC FOOD DELIVERY SYSTEMS IN URBAN INDIA 99<br />
Table 4.7<br />
Some Aspects <strong>on</strong> Possessi<strong>on</strong> <strong>of</strong> Rati<strong>on</strong> Cards am<strong>on</strong>g Bottom 30 per cent <strong>of</strong> C<strong>on</strong>sumer<br />
Expenditure Classes <strong>in</strong> <strong>Urban</strong> Areas, 2004-05<br />
<strong>State</strong>s<br />
Percentage <strong>of</strong> urban households classified by type <strong>of</strong> rati<strong>on</strong> cards<br />
possessed am<strong>on</strong>g bottom 30% <strong>of</strong> MPCE class<br />
AAY BPL O<strong>the</strong>r No RC<br />
1 Andhra Pradesh 4.2 46.1 12.4 37.3<br />
2 Assam 0.1 11.8 38.2 49.8<br />
3 Bihar 1.4 13.2 36.3 49.1<br />
4 Gujarat 0.2 23.9 48.2 27.7<br />
5 Haryana 6.5 25.6 52.3 15.5<br />
6 Karnataka 4.7 35.4 20.3 39.6<br />
7 Kerala 3.7 42.6 44.3 9.4<br />
8 Madhya Pradesh 4.6 26.2 32.3 36.9<br />
9 Maharashtra 1.4 24.6 47.1 26.8<br />
10 Orissa 2.4 22.3 23.8 51.4<br />
11 Punjab 0.2 12.5 57.8 29.4<br />
12 Rajasthan 0.4 4.4 83.9 11.4<br />
13 Tamil Nadu 1.9 24.2 57.4 16.5<br />
14 Uttar Pradesh 1.0 14.8 67.5 16.7<br />
15 West Bengal 1.9 20.8 57.2 20.1<br />
<strong>India</strong> 2.4 23.0 46.5 28.1<br />
Note: RC-Rati<strong>on</strong> Card; AAY-Antyodaya Anna Yojana; BPL-Below Poverty L<strong>in</strong>e; O<strong>the</strong>rs-Card bel<strong>on</strong>g<strong>in</strong>g to n<strong>on</strong>e <strong>of</strong><br />
<strong>the</strong> menti<strong>on</strong>ed categories<br />
Source: NSSO 2007c<br />
Suryanarayana (2008) comments <strong>on</strong> <strong>the</strong> same<br />
data: ‘The estimates show that <strong>the</strong> poorest four<br />
MPCE classes, which accommodated <strong>the</strong> poorest<br />
thirty per cent <strong>of</strong> <strong>the</strong> populati<strong>on</strong>, did not exhaust<br />
<strong>the</strong> set <strong>of</strong> Antyodaya & BPL cardholders. More<br />
than 50 per cent <strong>of</strong> <strong>the</strong> households <strong>in</strong> <strong>the</strong>se MPCE<br />
classes did not have <strong>the</strong> Antyodaya & BPL rati<strong>on</strong><br />
cards. Households possess<strong>in</strong>g <strong>the</strong> Antyodaya and<br />
<strong>the</strong> BPL rati<strong>on</strong> cards, though generally decl<strong>in</strong><strong>in</strong>g<br />
<strong>in</strong> percentage number, were found across higher<br />
percentile classes <strong>of</strong> expenditure <strong>in</strong> both rural and<br />
urban sectors’.<br />
Transparency Internati<strong>on</strong>al <strong>India</strong> and <strong>the</strong><br />
Centre for Media Studies have been undertak<strong>in</strong>g<br />
corrupti<strong>on</strong> studies s<strong>in</strong>ce 2002. <strong>India</strong> Corrupti<strong>on</strong><br />
Study 2005 was based <strong>on</strong> a study <strong>of</strong> 11 public<br />
services. Accord<strong>in</strong>g to this, while <strong>the</strong> error <strong>of</strong><br />
<strong>in</strong>clusi<strong>on</strong> <strong>in</strong> Andhra Pradesh was 4.29 per cent<br />
<strong>in</strong> urban areas, <strong>the</strong> error <strong>of</strong> exclusi<strong>on</strong> was 36.40<br />
per cent. The corresp<strong>on</strong>d<strong>in</strong>g figures <strong>of</strong> errors <strong>of</strong><br />
<strong>in</strong>clusi<strong>on</strong> and exclusi<strong>on</strong> for urban Maharashtra<br />
were 4.12 per cent and 51.34 per cent respectively 31 .<br />
Madhura Swam<strong>in</strong>athan (1997) has highlighted<br />
<strong>the</strong> aspect <strong>of</strong> a shift to targeted welfare schemes<br />
from universal schemes be<strong>in</strong>g accompanied by a<br />
big <strong>in</strong>crease <strong>in</strong> Type I error, namely, <strong>the</strong> error <strong>of</strong><br />
exclusi<strong>on</strong> 32 : ‘While <strong>the</strong> costs <strong>of</strong> wr<strong>on</strong>g <strong>in</strong>clusi<strong>on</strong><br />
are <strong>on</strong>ly fiscal costs, adm<strong>in</strong>istrative costs for a<br />
targeted scheme are usually high, around 2 to 5 per<br />
cent <strong>of</strong> total expenditure, and much higher than for<br />
31 The corresp<strong>on</strong>d<strong>in</strong>g figures <strong>of</strong> error <strong>of</strong> <strong>in</strong>clusi<strong>on</strong> and exclusi<strong>on</strong> for rural areas <strong>in</strong> Andhra Pradesh was 22.35 per cent and 20.42 per cent<br />
respectively and for Maharashtra <strong>the</strong> figures were, 11.30 per cent and 49.90 per cent respectively.<br />
32 Refers to <strong>the</strong> exclusi<strong>on</strong> <strong>of</strong> genu<strong>in</strong>ely poor or deserv<strong>in</strong>g households from a programme.
100 REPORT ON THE STATE OF FOOD INSECURITY IN URBAN INDIA<br />
a universal scheme, with <strong>the</strong> costs depend<strong>in</strong>g <strong>on</strong><br />
<strong>the</strong> type <strong>of</strong> identificati<strong>on</strong> required. Besides, <strong>the</strong>re<br />
are large welfare costs associated with <strong>the</strong> error<br />
<strong>of</strong> exclud<strong>in</strong>g those deserv<strong>in</strong>g from a scheme, and<br />
<strong>the</strong>se are <strong>the</strong> social costs <strong>of</strong> hav<strong>in</strong>g a populati<strong>on</strong><br />
that is hungry and malnourished’.<br />
Juxtapos<strong>in</strong>g data from <strong>the</strong> NSSO<br />
61 st Round, with household poverty level<br />
estimated us<strong>in</strong>g NSSO unit level data and<br />
<strong>State</strong>-and sector-specific poverty l<strong>in</strong>es published<br />
by <strong>the</strong> Plann<strong>in</strong>g Commissi<strong>on</strong>, Suryanarayana<br />
(2008) has shown that, except <strong>in</strong> <strong>the</strong> case <strong>of</strong><br />
Andhra Pradesh, Assam, Haryana, Kerala and<br />
West Bengal, <strong>the</strong> percentage <strong>of</strong> households with<br />
AAY or BPL cards were less than <strong>the</strong> urban<br />
household poverty level for <strong>the</strong> respective<br />
<strong>State</strong>s. Ranjan Ray (2007) has shown, us<strong>in</strong>g <strong>the</strong><br />
m<strong>in</strong>imum calorie requirement as <strong>the</strong> benchmark<br />
for prevalence <strong>of</strong> undernutriti<strong>on</strong> (POU) 33 , that<br />
<strong>the</strong> POU levels <strong>in</strong> both rural and urban areas<br />
<strong>in</strong>creased between <strong>the</strong> NSSO 43 rd (1987-88) and<br />
57 th (2001-02) rounds, <strong>in</strong>dicat<strong>in</strong>g a rise <strong>in</strong> hunger<br />
as well as <strong>in</strong>ability to meet m<strong>in</strong>imum household<br />
calorie requirements. The POU percentage <strong>in</strong><br />
urban areas <strong>in</strong>creased from 37 per cent to 51 per<br />
cent between <strong>the</strong> two rounds 34 . Ray has fur<strong>the</strong>r<br />
calculated <strong>the</strong> POU rates am<strong>on</strong>g <strong>the</strong> bottom and<br />
top deciles <strong>in</strong> rural and urban areas for 100 per<br />
cent and 80 per cent <strong>of</strong> <strong>the</strong> calorie requirement<br />
us<strong>in</strong>g two different vectors <strong>of</strong> age and gender<br />
specific calorie requirement, to counter <strong>the</strong><br />
criticism that POU estimates are extremely<br />
sensitive to <strong>the</strong> a priori specified m<strong>in</strong>imum calorie<br />
requirements. Us<strong>in</strong>g NSSO 57 th round data, he<br />
showed that <strong>the</strong> percentage <strong>of</strong> undernourished<br />
urban households at <strong>the</strong> all-<strong>India</strong> level, even <strong>in</strong><br />
<strong>the</strong> 80 per cent <strong>of</strong> m<strong>in</strong>imum calorie requirement<br />
category, was 50 per cent while that <strong>in</strong> <strong>the</strong> 100<br />
per cent category was 87.5 per cent 35 . Across <strong>the</strong><br />
<strong>State</strong>s, <strong>the</strong> prevalence <strong>of</strong> undernutriti<strong>on</strong> even at<br />
80 per cent <strong>of</strong> <strong>the</strong> calorie requirement was seen to<br />
be more than 50 per cent <strong>in</strong> 7 <strong>State</strong>s, <strong>the</strong> highest<br />
be<strong>in</strong>g <strong>in</strong> Rajasthan at 81 per cent followed by<br />
Karnataka and West Bengal at 73 per cent.<br />
Interest<strong>in</strong>gly, 15 per cent <strong>of</strong> households <strong>in</strong> <strong>the</strong><br />
top deciles <strong>in</strong> urban areas and 23 per cent <strong>in</strong> rural<br />
areas were also found to be unable to c<strong>on</strong>sume<br />
<strong>the</strong> m<strong>in</strong>imum calorie requirement. TPDS, by<br />
restrict<strong>in</strong>g access to <strong>on</strong>ly <strong>the</strong> BPL households as<br />
per <strong>the</strong> c<strong>on</strong>sumer expenditure figure derived from<br />
apply<strong>in</strong>g <strong>the</strong> methodology <strong>of</strong> <strong>the</strong> 1993 <str<strong>on</strong>g>Report</str<strong>on</strong>g><br />
<strong>of</strong> <strong>the</strong> Expert Committee set up by <strong>the</strong> Plann<strong>in</strong>g<br />
Commissi<strong>on</strong>, <strong>the</strong>refore, seems to be exclud<strong>in</strong>g<br />
large numbers <strong>of</strong> undernourished BPL as well as<br />
APL households.<br />
The performance evaluati<strong>on</strong> <strong>of</strong> TPDS by<br />
<strong>the</strong> Plann<strong>in</strong>g Commissi<strong>on</strong> also echoed <strong>the</strong>se<br />
f<strong>in</strong>d<strong>in</strong>gs, admitt<strong>in</strong>g that ‘…<strong>the</strong> transiti<strong>on</strong> from<br />
universal PDS to TPDS has nei<strong>the</strong>r benefited<br />
<strong>the</strong> poor, nor helped reduce budgetary food<br />
subsidies <strong>in</strong> <strong>the</strong> desired manner….. … leakage and<br />
diversi<strong>on</strong> (to un<strong>in</strong>tended beneficiaries) are<br />
substantial. Only about 42 per cent <strong>of</strong> <strong>the</strong><br />
subsidised foodgra<strong>in</strong>s released from <strong>the</strong> Central<br />
Pool reaches <strong>the</strong> poor, imply<strong>in</strong>g very high<br />
delivery cost <strong>of</strong> TPDS’ (Plann<strong>in</strong>g Commissi<strong>on</strong><br />
2005).<br />
4.1.2 O<strong>the</strong>r Issues<br />
Exam<strong>in</strong><strong>in</strong>g <strong>the</strong> dependence <strong>of</strong> BPL<br />
resp<strong>on</strong>dents <strong>in</strong> urban areas <strong>on</strong> PDS, <strong>the</strong> evaluati<strong>on</strong><br />
33 The <strong>India</strong>n poverty l<strong>in</strong>es for <strong>the</strong> rural and urban populati<strong>on</strong>s are based <strong>on</strong> calorie norms <strong>of</strong> 2400 and 2100 kcal per capita per day,<br />
respectively. A household is classified as calorie poor (n<strong>on</strong>-poor) if its observed calorie <strong>in</strong>take turns out to be less (more) than <strong>the</strong> required<br />
amount. The prevalence <strong>of</strong> undernutriti<strong>on</strong> (POU) is, <strong>the</strong>n, measured as <strong>the</strong> percentage <strong>of</strong> households who are unable to meet <strong>the</strong>ir daily<br />
calorie requirement (Ray 2007).<br />
34 The rural POU rate dur<strong>in</strong>g <strong>the</strong> same period <strong>in</strong>creased from 48.16 per cent <strong>in</strong> 1987-88 to 66.90 per cent <strong>in</strong> 2001-02.<br />
35 The corresp<strong>on</strong>d<strong>in</strong>g figures for <strong>the</strong> bottom decile <strong>in</strong> rural areas were 75.6 per cent and 95.6 per cent, respectively.
PUBLIC FOOD DELIVERY SYSTEMS IN URBAN INDIA 101<br />
report <strong>on</strong> TPDS (Plann<strong>in</strong>g Commissi<strong>on</strong> 2005) has<br />
found that PDS catered to <strong>the</strong> rural market demand<br />
for cereals more than to <strong>the</strong> urban demand. This<br />
dichotomy was greatly pr<strong>on</strong>ounced <strong>in</strong> Karnataka,<br />
Kerala (both with exhaustive PDS <strong>in</strong>frastructure<br />
<strong>in</strong> <strong>the</strong> rural areas) and Rajasthan, mostly due to<br />
exposure to greater (and cheaper) varieties <strong>of</strong><br />
cereals <strong>in</strong> <strong>the</strong> urban areas. Bihar was a glar<strong>in</strong>g<br />
excepti<strong>on</strong>, reflect<strong>in</strong>g <strong>on</strong> weak delivery mechanisms<br />
and availability <strong>of</strong> cheaper coarse varieties <strong>in</strong> <strong>the</strong><br />
rural areas.<br />
<strong>India</strong> Corrupti<strong>on</strong> Study 2005 and <strong>India</strong><br />
Corrupti<strong>on</strong> Study 2007 have highlighted <strong>the</strong><br />
issue <strong>of</strong> corrupti<strong>on</strong> and <strong>the</strong> bribes paid <strong>in</strong> order to<br />
ga<strong>in</strong> access to PDS. The level <strong>of</strong> corrupti<strong>on</strong> was<br />
reported to be higher <strong>in</strong> <strong>the</strong> <strong>State</strong>s with higher<br />
poverty <strong>in</strong>cidence. N<strong>on</strong>-availability <strong>of</strong> rati<strong>on</strong> at <strong>the</strong><br />
Fair Price Shops, repeated visits to get work d<strong>on</strong>e,<br />
were o<strong>the</strong>r aspects reported36 .<br />
A survey by <strong>the</strong> ORG Centre for Social<br />
Research also highlighted lacunae <strong>in</strong> <strong>the</strong><br />
functi<strong>on</strong><strong>in</strong>g <strong>of</strong> <strong>the</strong> PDS37 . Accord<strong>in</strong>g to <strong>the</strong> Survey,<br />
<strong>on</strong>ly 10.5 per cent <strong>of</strong> resp<strong>on</strong>dents <strong>in</strong> urban areas<br />
were aware <strong>of</strong> <strong>the</strong> process <strong>of</strong> selecti<strong>on</strong> <strong>of</strong><br />
beneficiaries under <strong>the</strong> Antyodya Anna Yojana<br />
scheme. Nearly 80 per cent <strong>of</strong> all resp<strong>on</strong>dents<br />
were unaware <strong>of</strong> <strong>the</strong> process by which BPL<br />
households were identified and selected. 23 per cent<br />
<strong>of</strong> resp<strong>on</strong>dents <strong>in</strong> urban areas, who had reported<br />
not lift<strong>in</strong>g foodgra<strong>in</strong>s <strong>in</strong> <strong>the</strong> last <strong>on</strong>e year, said that<br />
unacceptable or poor gra<strong>in</strong> quality was <strong>the</strong> reas<strong>on</strong>.<br />
Suryanarayana (2008) cited quality <strong>of</strong><br />
foodgra<strong>in</strong>s sold, availability and transacti<strong>on</strong><br />
costs as factors that could deter cardholders from<br />
avail<strong>in</strong>g PDS.<br />
The Ec<strong>on</strong>omic Survey 2008-09, while<br />
echo<strong>in</strong>g <strong>the</strong>se problems, however talked <strong>of</strong> smart<br />
cards and redirect<strong>in</strong>g <strong>of</strong> subsidies from PDS to<br />
direct feed<strong>in</strong>g programmes: ‘.. <strong>the</strong> Eleventh Five<br />
Year Plan has observed that PDS seems to have<br />
failed <strong>in</strong> mak<strong>in</strong>g foodgra<strong>in</strong>s available to <strong>the</strong> poor<br />
as is evident from fall<strong>in</strong>g levels <strong>of</strong> cereal<br />
c<strong>on</strong>sumpti<strong>on</strong> over <strong>the</strong> last two decades. PDS was<br />
redesigned as TPDS where higher rates <strong>of</strong> subsidies<br />
were given to <strong>the</strong> poor and <strong>the</strong> poorest am<strong>on</strong>g<br />
poor. However, some major deficiencies were also<br />
identified <strong>in</strong> TPDS. These <strong>in</strong>cluded high exclusi<strong>on</strong><br />
and <strong>in</strong>clusi<strong>on</strong> errors, n<strong>on</strong>-viability <strong>of</strong> fair price<br />
shops, leakages and failure <strong>in</strong> price stabilisati<strong>on</strong>.<br />
In this situati<strong>on</strong>, it may be useful to <strong>in</strong>troduce food<br />
stamps/coup<strong>on</strong>s which may be valid outside <strong>the</strong><br />
PDS outlets <strong>on</strong>ce <strong>the</strong> markets get better <strong>in</strong>tegrated.<br />
<strong>Food</strong> coup<strong>on</strong>s will allow <strong>the</strong> c<strong>on</strong>sumers a wider<br />
choice. However, <strong>the</strong>ir value needs to be <strong>in</strong>dexed<br />
to <strong>the</strong> food <strong>in</strong>flati<strong>on</strong>. Multi-applicati<strong>on</strong> smart cards<br />
will also enhance <strong>the</strong> efficiency <strong>of</strong> adm<strong>in</strong>ister<strong>in</strong>g<br />
various schemes. In <strong>the</strong> PDS system, <strong>the</strong> smart card<br />
will reduce <strong>the</strong> <strong>in</strong>cidence <strong>of</strong> bogus rati<strong>on</strong> cards or<br />
diversi<strong>on</strong> <strong>of</strong> foodgra<strong>in</strong>s. Leakages can also be<br />
restricted by redirect<strong>in</strong>g subsidies currently under<br />
PDS to better fund<strong>in</strong>g <strong>of</strong> o<strong>the</strong>r schemes like<br />
MDMS or <strong>the</strong> ICDS’ (M<strong>in</strong>istry <strong>of</strong> F<strong>in</strong>ance 2009).<br />
<strong>Food</strong> coup<strong>on</strong>s and o<strong>the</strong>r tools <strong>of</strong> target<strong>in</strong>g<br />
have been tried out <strong>in</strong> several countries and <strong>the</strong><br />
experience has generally been far from <strong>in</strong>spir<strong>in</strong>g.<br />
The more basic po<strong>in</strong>t is that by mak<strong>in</strong>g a scheme<br />
targeted <strong>in</strong> this manner, <strong>on</strong>e is reduc<strong>in</strong>g <strong>the</strong> broad<br />
political c<strong>on</strong>stituency for <strong>the</strong> scheme, thus mak<strong>in</strong>g<br />
it easier for governments to repeal such schemes<br />
<strong>the</strong>mselves <strong>in</strong> due course, cit<strong>in</strong>g reas<strong>on</strong>s <strong>of</strong> fiscal<br />
prudence. For this and for several o<strong>the</strong>r reas<strong>on</strong>s<br />
already stated, <strong>in</strong>clud<strong>in</strong>g that <strong>of</strong> <strong>the</strong> widespread<br />
prevalence <strong>of</strong> hunger even am<strong>on</strong>g <strong>of</strong>ficially n<strong>on</strong>poor<br />
households, <strong>the</strong> policy decisi<strong>on</strong> should be <strong>in</strong><br />
favour <strong>of</strong> a universal PDS ra<strong>the</strong>r than a targeted<br />
system.<br />
36 The 2005 survey covered 14,405 resp<strong>on</strong>dents across 20 <strong>State</strong>s. The 2007 survey covered 22,728 randomly selected BPL households<br />
across <strong>the</strong> 31 <strong>State</strong>s and Uni<strong>on</strong> Territories.<br />
37 See MSSRF-WFP 2008 (RSFIRI): 86.
102 REPORT ON THE STATE OF FOOD INSECURITY IN URBAN INDIA<br />
4.2 Mid-Day Meal Scheme<br />
The Nati<strong>on</strong>al Programme <strong>of</strong> Nutriti<strong>on</strong>al<br />
Support to Primary Educati<strong>on</strong> (NPNSPE),<br />
comm<strong>on</strong>ly known as <strong>the</strong> Mid-Day Meal Scheme<br />
(MDMS), was started by <strong>the</strong> Government <strong>of</strong> <strong>India</strong><br />
<strong>in</strong> August 1995 with <strong>the</strong> aim <strong>of</strong> universalisati<strong>on</strong><br />
<strong>of</strong> primary educati<strong>on</strong> by improv<strong>in</strong>g enrolment,<br />
attendance and retenti<strong>on</strong>. In <strong>State</strong>s like Tamil<br />
Nadu, MDMS has a l<strong>on</strong>ger history and <strong>the</strong> positive<br />
experience <strong>of</strong> Tamil Nadu was a factor underly<strong>in</strong>g<br />
<strong>the</strong> central government <strong>in</strong>itiative. Ano<strong>the</strong>r objective<br />
<strong>of</strong> NPNSPE was <strong>the</strong> rais<strong>in</strong>g <strong>of</strong> <strong>the</strong> nutriti<strong>on</strong>al level<br />
<strong>of</strong> children and <strong>in</strong>culcat<strong>in</strong>g <strong>in</strong> <strong>the</strong>m appropriate<br />
hygiene and sanitati<strong>on</strong> practices. Additi<strong>on</strong>ally, as<br />
many have po<strong>in</strong>ted out, MDMS was c<strong>on</strong>ceived to<br />
help break caste prejudices by ensur<strong>in</strong>g <strong>the</strong> shar<strong>in</strong>g<br />
<strong>of</strong> comm<strong>on</strong> meals by children <strong>of</strong> different castes<br />
and, <strong>in</strong> a similar ve<strong>in</strong>, help foster gender equity,<br />
though <strong>of</strong> course n<strong>on</strong>e <strong>of</strong> <strong>the</strong>se outcomes can be<br />
taken for granted! The scheme seeks to achieve<br />
its objectives by improv<strong>in</strong>g <strong>the</strong> nutriti<strong>on</strong>al status<br />
<strong>of</strong> children <strong>in</strong> classes I - VIII <strong>in</strong> government,<br />
local body, government body and governmentaided<br />
schools; children study<strong>in</strong>g <strong>in</strong> <strong>the</strong> centres<br />
under <strong>the</strong> Educati<strong>on</strong> Guarantee Scheme (EGS);<br />
and <strong>in</strong> Alternative and Innovative Educati<strong>on</strong><br />
(AIE) centres. The scheme <strong>in</strong>itially provided for<br />
distributi<strong>on</strong> <strong>of</strong> fixed quantities <strong>of</strong> dry foodgra<strong>in</strong>s<br />
to school children. This was replaced by cooked<br />
meals with effect from September 2004 under<br />
orders passed by <strong>the</strong> Supreme Court.<br />
MDMS provides a mid-day meal <strong>of</strong> 450<br />
calories and 12 grams <strong>of</strong> prote<strong>in</strong> to children at <strong>the</strong><br />
primary stage. For children at <strong>the</strong> upper primary<br />
stage, <strong>the</strong> nutriti<strong>on</strong>al value has been fixed at 700<br />
calories. With effect from December 2009, <strong>the</strong><br />
quantity <strong>of</strong> pulses to be served was to be 30g,<br />
vegetables 75g and <strong>the</strong> quantity <strong>of</strong> oil and fat 7.5g<br />
(M<strong>in</strong>istry <strong>of</strong> F<strong>in</strong>ance <strong>2010</strong>). The cook<strong>in</strong>g costs<br />
38 http://educati<strong>on</strong>.nic.<strong>in</strong>/Elementary/mdm/<strong>in</strong>dex.htm accessed <strong>on</strong> 15 March <strong>2010</strong><br />
have also been revised to provide for this changed<br />
norm. Adequate quantities <strong>of</strong> micro-nutrients –<br />
like ir<strong>on</strong>, folic acid and vitam<strong>in</strong> A – have also<br />
been recommended. Dur<strong>in</strong>g 2009-10, 11.77 crore<br />
children (8.41 crore at primary stage, i.e., Classes<br />
I-V and 3.36 crore at upper primary stage i.e.,<br />
Classes VI-VIII) were expected to benefit under<br />
<strong>the</strong> scheme 38 . An outlay <strong>of</strong> Rs.9440 crore has<br />
been provided for this <strong>in</strong> <strong>the</strong> Budget for <strong>2010</strong>-11,<br />
an <strong>in</strong>crease <strong>of</strong> 18 per cent over <strong>the</strong> allocati<strong>on</strong> <strong>of</strong><br />
Rs.8000 crore <strong>in</strong> each <strong>of</strong> <strong>the</strong> previous two years, an<br />
<strong>in</strong>crease that seems modest, given <strong>the</strong> current rates<br />
<strong>of</strong> food <strong>in</strong>flati<strong>on</strong>.<br />
As with <strong>the</strong> use <strong>of</strong> PDS by various MPCE<br />
classes and social groups, <strong>the</strong> 61 st round <strong>of</strong> <strong>the</strong><br />
NSSO for reference year 2004-05 provided<br />
some useful material <strong>on</strong> access to MDMS by<br />
expenditure classes and social groups. Table 4.8<br />
shows <strong>the</strong> percentage <strong>of</strong> urban households across<br />
social categories report<strong>in</strong>g at least <strong>on</strong>e pers<strong>on</strong><br />
benefit<strong>in</strong>g from MDMS. It must be kept <strong>in</strong> m<strong>in</strong>d<br />
that <strong>the</strong> figures reported here are as percentages to<br />
all households and not just <strong>the</strong> eligible households,<br />
i.e., those with <strong>on</strong>e or more children attend<strong>in</strong>g<br />
primary/elementary school. The latter is clearly<br />
a subset <strong>of</strong> all sample households. Never<strong>the</strong>less,<br />
<strong>the</strong>se numbers give us a fair idea <strong>of</strong> <strong>the</strong> reach <strong>of</strong><br />
<strong>the</strong> scheme <strong>in</strong> urban areas.<br />
At <strong>the</strong> all-<strong>India</strong> level, <strong>in</strong> urban areas,<br />
9 per cent <strong>of</strong> ST households, 12 per cent <strong>of</strong> SC<br />
households and 11 per cent <strong>of</strong> OBC households<br />
were found to have at least <strong>on</strong>e member benefit<strong>in</strong>g<br />
from MDMS. Tamil Nadu, <strong>of</strong>ten cited as <strong>the</strong><br />
model state for <strong>the</strong> functi<strong>on</strong><strong>in</strong>g <strong>of</strong> MDMS, had<br />
<strong>the</strong> highest percentage <strong>of</strong> households <strong>in</strong> <strong>the</strong><br />
vulnerable category (22 per cent ST and 24 per cent<br />
SC) us<strong>in</strong>g <strong>the</strong> scheme. In Karnataka, 22 per cent<br />
<strong>of</strong> SC households and 15 per cent OBC households<br />
benefited from MDMS. The corresp<strong>on</strong>d<strong>in</strong>g figures
PUBLIC FOOD DELIVERY SYSTEMS IN URBAN INDIA 103<br />
<strong>in</strong> Kerala were 23 per cent and 14 per cent,<br />
respectively. In Andhra Pradesh, 16 per cent ST<br />
households, 11 per cent SC households and 10<br />
per cent OBC households <strong>in</strong> urban areas reported<br />
access<strong>in</strong>g MDMS. In general, it is seen that <strong>the</strong><br />
access has been higher <strong>in</strong> <strong>the</strong> four sou<strong>the</strong>rn <strong>State</strong>s.<br />
Sl.<br />
No.<br />
The <strong>State</strong>s record<strong>in</strong>g just 2-4 per cent <strong>of</strong> urban<br />
households benefit<strong>in</strong>g from MDMS are <strong>the</strong> Punjab<br />
(0.3), Haryana, Rajasthan, Uttar Pradesh, Assam<br />
and Bihar. The performances <strong>of</strong> Bihar, Uttar<br />
Pradesh and Rajasthan were found to be equally<br />
poor <strong>in</strong> rural areas.<br />
The MPCE class-wise figures <strong>in</strong>dicate that<br />
<strong>on</strong>e-fifth <strong>of</strong> all households <strong>in</strong> <strong>the</strong> bottom 30 per cent<br />
<strong>of</strong> expenditure classes have at least <strong>on</strong>e member<br />
benefit<strong>in</strong>g from MDMS. As expected, Tamil Nadu<br />
performed much better than <strong>the</strong> o<strong>the</strong>r <strong>State</strong>s,<br />
with nearly two-fifths <strong>of</strong> households benefit<strong>in</strong>g<br />
from MDMS am<strong>on</strong>g <strong>the</strong> bottom 30 per cent <strong>of</strong><br />
c<strong>on</strong>sumpti<strong>on</strong> expenditure classes (Table 4.9).<br />
As aga<strong>in</strong>st 33.4 per cent rural households <strong>in</strong><br />
<strong>the</strong> bottom 30 per cent category hav<strong>in</strong>g recourse<br />
to MDMS at <strong>the</strong> all-<strong>India</strong> level <strong>in</strong> rural areas, <strong>the</strong><br />
Table 4.8<br />
Importance <strong>of</strong> MDMS for <strong>Urban</strong> Households across Different Social Groups, 2004-05<br />
<strong>State</strong>s<br />
Percentage <strong>of</strong> urban households across different social groups with at<br />
least <strong>on</strong>e member benefit<strong>in</strong>g from MDMS<br />
ST SC OBC O<strong>the</strong>rs All<br />
1 Andhra Pradesh 16.2 11.1 9.7 5.8 8.6<br />
2 Assam 3.7 1.3 4.9 1.0 2.0<br />
3 Bihar 1.8 9.0 2.2 0.9 2.7<br />
4 Gujarat 11.0 7.8 16.9 4.7 8.7<br />
5 Haryana 0.0 7.1 4.8 0.8 2.8<br />
6 Karnataka 6.9 22.3 15.2 6.0 11.3<br />
7 Kerala 1.1 23.3 14.4 6.5 12.5<br />
8 Madhya Pradesh 12.8 12.2 13.3 5.8 10.3<br />
9 Maharashtra 10.3 11.0 11.3 7.9 9.3<br />
10 Orissa 5.4 19.1 11.7 4.7 9.0<br />
11 Punjab 0.0 0.5 1.1 0.0 0.3<br />
12 Rajasthan 0.8 6.1 5.0 1.7 3.8<br />
13 Tamil Nadu 22.1 24.2 15.4 3.8 15.6<br />
14 Uttar Pradesh 1.6 11.0 6.4 1.4 4.1<br />
15 West Bengal 8.5 13.8 8.5 8.2 9.3<br />
<strong>India</strong> 9.0 11.8 10.7 4.8 8.0<br />
Source: NSSO 2007c<br />
figure was 19.52 per cent <strong>in</strong> urban areas. This may<br />
be a reflecti<strong>on</strong> <strong>of</strong> an urban demographic transiti<strong>on</strong>,<br />
with relatively fewer urban families hav<strong>in</strong>g<br />
children <strong>in</strong> school. Gujarat (30.94 per cent) and<br />
Kerala (30.24 per cent) recorded high utilisati<strong>on</strong><br />
<strong>of</strong> MDMS <strong>in</strong> <strong>the</strong> bottom 30 per cent category <strong>in</strong><br />
urban areas.<br />
Across occupati<strong>on</strong>al groups, 18 per cent <strong>of</strong><br />
casual labour households and 9 per cent <strong>of</strong> selfemployed<br />
households reported at least <strong>on</strong>e member<br />
benefit<strong>in</strong>g from MDMS (NSSO 2007c).
104 REPORT ON THE STATE OF FOOD INSECURITY IN URBAN INDIA<br />
Sl.<br />
No.<br />
Table 4.9<br />
Importance <strong>of</strong> MDMS for <strong>Urban</strong> Households across Different C<strong>on</strong>sumer Expenditure<br />
Classes, 2004-05<br />
<strong>State</strong>s<br />
4.2.1 Performance Audit <strong>of</strong> MDMS by<br />
<strong>the</strong> Comptroller and Auditor General<br />
The performance audit reports <strong>of</strong> MDMS<br />
<strong>in</strong> <strong>the</strong> different <strong>State</strong>s and at <strong>the</strong> Central level by<br />
<strong>the</strong> <strong>of</strong>fice <strong>of</strong> <strong>the</strong> Comptroller and Auditor General<br />
<strong>of</strong> <strong>India</strong> (CAG) have become available 39 . While<br />
recent CAG <str<strong>on</strong>g>Report</str<strong>on</strong>g>s talk <strong>of</strong> cooked meals not<br />
be<strong>in</strong>g given to children <strong>in</strong> some <strong>State</strong>s, <strong>the</strong> Orissa<br />
government has reportedly given <strong>the</strong> resp<strong>on</strong>sibility<br />
<strong>of</strong> cook<strong>in</strong>g <strong>the</strong> meals to SHGs and <strong>the</strong> results have<br />
been welcomed, accord<strong>in</strong>g to Press reports 40 .<br />
Percentage <strong>of</strong> urban households with at least <strong>on</strong>e member<br />
benefit<strong>in</strong>g from MDMS<br />
Bottom 30%<br />
<strong>of</strong> <strong>the</strong> MPCE<br />
Classes<br />
Middle 40 %<br />
<strong>of</strong> <strong>the</strong> MPCE<br />
Classes<br />
Top 30% <strong>of</strong> <strong>the</strong><br />
MPCE Classes<br />
All Classes<br />
1 Andhra Pradesh 22.00 6.32 0.00 8.6<br />
2 Assam 5.60 2.09 0.19 2.0<br />
3 Bihar 5.92 2.08 0.00 2.2<br />
4 Gujarat 30.94 9.89 0.71 8.7<br />
5 Haryana 10.42 2.61 0.13 2.8<br />
6 Karnataka 25.61 13.99 0.06 11.3<br />
7 Kerala 30.24 14.47 4.92 12.5<br />
8 Madhya Pradesh 21.73 6.07 0.24 11.4<br />
9 Maharashtra 24.66 9.83 1.99 9.3<br />
10 Orissa 16.55 3.96 2.24 9.0<br />
11 Punjab 2.47 0.09 0.00 0.3<br />
12 Rajasthan 7.10 3.82 0.61 3.8<br />
13 Tamil Nadu 38.60 16.68 1.33 15.6<br />
14 Uttar Pradesh 12.31 1.50 0.08 3.1<br />
15 West Bengal 24.70 8.15 1.95 9.3<br />
<strong>India</strong> 19.52 7.80 1.07 8.0<br />
Source: NSSO 2007c<br />
39 www.cag.gov.<strong>in</strong> for performance audit reports perta<strong>in</strong><strong>in</strong>g to various <strong>State</strong>s.<br />
While <strong>the</strong> test checks by <strong>the</strong> <strong>of</strong>fice <strong>of</strong> <strong>the</strong><br />
CAG found improvement <strong>in</strong> enrolment and<br />
retenti<strong>on</strong> <strong>of</strong> children <strong>in</strong> most cases, <strong>the</strong> deficiency<br />
<strong>of</strong> proper cook<strong>in</strong>g <strong>in</strong>frastructure emerged as an<br />
issue <strong>in</strong> all <strong>the</strong> <strong>State</strong>s. Lack <strong>of</strong> <strong>in</strong>ternal c<strong>on</strong>trols<br />
and regular m<strong>on</strong>itor<strong>in</strong>g and evaluati<strong>on</strong> were cited<br />
as o<strong>the</strong>r drawbacks. Feed<strong>in</strong>g teachers and cooks<br />
<strong>in</strong>stead <strong>of</strong> students, engagement <strong>of</strong> c<strong>on</strong>tractors for<br />
cook<strong>in</strong>g, <strong>in</strong>adequate cook<strong>in</strong>g and serv<strong>in</strong>g utensils<br />
were some <strong>of</strong> <strong>the</strong> irregularities cited <strong>in</strong> <strong>the</strong> audits<br />
<strong>in</strong> <strong>the</strong> <strong>State</strong>s.<br />
40 http://www.downtoearth.org.<strong>in</strong>/full6.asp?foldername=20080630&filename=news&sec_id=50&sid=45
PUBLIC FOOD DELIVERY SYSTEMS IN URBAN INDIA 105<br />
An important issue <strong>in</strong> some <strong>of</strong> <strong>the</strong> <strong>State</strong> level<br />
audits was <strong>the</strong> operati<strong>on</strong> <strong>of</strong> centralised kitchens<br />
by NGOs to supply food to schools <strong>in</strong> urban<br />
areas. Follow<strong>in</strong>g guidel<strong>in</strong>es issued <strong>in</strong> December<br />
2004, it had been permitted to set up centralised<br />
kitchens, where feasible, to cater to a cluster <strong>of</strong><br />
schools <strong>in</strong> urban areas. In such a situati<strong>on</strong>, hot<br />
cooked meals would have to be transported under<br />
hygienic c<strong>on</strong>diti<strong>on</strong>s through a reliable transport<br />
system to various schools. Follow<strong>in</strong>g this, some<br />
<strong>State</strong>s (Andhra Pradesh, Madhya Pradesh, Uttar<br />
Pradesh, Haryana and Gujarat) had c<strong>on</strong>tracted<br />
out <strong>the</strong> resp<strong>on</strong>sibility <strong>of</strong> school feed<strong>in</strong>g <strong>in</strong> some<br />
urban pockets to NGOs. The CAG audits however<br />
found that <strong>the</strong> operati<strong>on</strong>s <strong>of</strong> <strong>the</strong> NGOs were<br />
found want<strong>in</strong>g, with <strong>in</strong>stances <strong>of</strong> <strong>in</strong>adequate<br />
quantity, excess claims, lack <strong>of</strong> implementati<strong>on</strong><br />
<strong>of</strong> supplementary programmes like de-worm<strong>in</strong>g<br />
and health check-ups be<strong>in</strong>g reported. It was<br />
observed that <strong>of</strong>ten NGOs were engaged without<br />
ascerta<strong>in</strong><strong>in</strong>g <strong>the</strong>ir <strong>in</strong>frastructure and capacity,<br />
which resulted <strong>in</strong> <strong>the</strong>ir unsatisfactory work<strong>in</strong>g and<br />
unauthorised occupati<strong>on</strong> <strong>of</strong> space/classrooms <strong>in</strong><br />
school build<strong>in</strong>gs.<br />
The Uni<strong>on</strong> Performance Audit <str<strong>on</strong>g>Report</str<strong>on</strong>g> <strong>of</strong><br />
MDMS <strong>in</strong> 2006-07 has made <strong>the</strong> follow<strong>in</strong>g general<br />
recommendati<strong>on</strong>s applicable across <strong>the</strong> <strong>State</strong>s<br />
(Comptroller and Auditor General <strong>of</strong> <strong>India</strong> 2008):<br />
•<br />
•<br />
The M<strong>in</strong>istry should set realistic and<br />
specific objectives and goals for <strong>the</strong><br />
scheme. It should prescribe outcome<br />
<strong>in</strong>dicators to measure and report <strong>on</strong><br />
improvements <strong>in</strong> educati<strong>on</strong>, health and<br />
nutriti<strong>on</strong>. It should use/analyse <strong>the</strong> data<br />
received from <strong>the</strong> <strong>State</strong>s for such an<br />
evaluati<strong>on</strong>.<br />
The M<strong>in</strong>istry should vigorously coord<strong>in</strong>ate<br />
with <strong>the</strong> <strong>State</strong> governments to ensure that<br />
<strong>the</strong> data <strong>on</strong> enrolment, attendance and<br />
retenti<strong>on</strong> flows from <strong>the</strong> school level to<br />
•<br />
•<br />
•<br />
•<br />
<strong>State</strong> level <strong>in</strong> a transparent manner, with<br />
records <strong>of</strong> compilati<strong>on</strong> ma<strong>in</strong>ta<strong>in</strong>ed at<br />
each level, i.e., school level, district level<br />
and <strong>State</strong> level. Periodical checks should<br />
be arranged to cross-check <strong>the</strong> data for<br />
accuracy. It should provide for analysis<br />
<strong>of</strong> feedback received and take remedial<br />
acti<strong>on</strong>, when required.<br />
The analysis <strong>of</strong> outcome <strong>in</strong>dicators and<br />
report<strong>in</strong>g should be brought <strong>in</strong>to an <strong>on</strong>l<strong>in</strong>e<br />
periodic MIS as far as possible, so that<br />
<strong>the</strong> evaluati<strong>on</strong> flows easily from <strong>the</strong> data<br />
available <strong>in</strong> real time.<br />
The M<strong>in</strong>istry needs to establish a system<br />
to ascerta<strong>in</strong> <strong>the</strong> improvement <strong>in</strong> nutriti<strong>on</strong>al<br />
levels <strong>of</strong> <strong>the</strong> children. The M<strong>in</strong>istry should<br />
coord<strong>in</strong>ate with <strong>the</strong> <strong>State</strong> governments<br />
and ensure ma<strong>in</strong>tenance <strong>of</strong> health cards <strong>in</strong><br />
all <strong>the</strong> schools to m<strong>on</strong>itor <strong>the</strong> health status<br />
<strong>of</strong> <strong>the</strong> children.<br />
The M<strong>in</strong>istry/<strong>State</strong>s should ensure that<br />
adequate <strong>in</strong>frastructure, viz., provisi<strong>on</strong>s<br />
<strong>of</strong> kitchen sheds, kitchen devices and<br />
facility <strong>of</strong> dr<strong>in</strong>k<strong>in</strong>g water are available<br />
<strong>in</strong> all schools. It should put <strong>in</strong> place a<br />
system to ensure that <strong>the</strong> teach<strong>in</strong>g time <strong>of</strong><br />
<strong>the</strong> teachers is not lost <strong>in</strong> c<strong>on</strong>necti<strong>on</strong> with<br />
<strong>the</strong> mid-day meal and <strong>the</strong>re is no adverse<br />
impact <strong>of</strong> <strong>the</strong> scheme <strong>on</strong> <strong>the</strong> primary<br />
objective <strong>of</strong> educati<strong>on</strong>.<br />
The M<strong>in</strong>istry/<strong>State</strong> governments need to<br />
streng<strong>the</strong>n <strong>in</strong>ternal c<strong>on</strong>trols as well as <strong>the</strong><br />
<strong>in</strong>specti<strong>on</strong> and m<strong>on</strong>itor<strong>in</strong>g mechanism<br />
at all levels. Accountability for<br />
ma<strong>in</strong>tenance <strong>of</strong> records at various levels<br />
should be prescribed and m<strong>on</strong>itored.<br />
The Uni<strong>on</strong> Audit <str<strong>on</strong>g>Report</str<strong>on</strong>g> has also<br />
recommended c<strong>on</strong>vergence and l<strong>in</strong>kage with<br />
o<strong>the</strong>r programmes for access<strong>in</strong>g funds to
106 REPORT ON THE STATE OF FOOD INSECURITY IN URBAN INDIA<br />
address <strong>in</strong>frastructural lacunae. For <strong>in</strong>stance, <strong>the</strong><br />
c<strong>on</strong>structi<strong>on</strong> <strong>of</strong> kitchen-cum-store for schools <strong>in</strong><br />
urban areas could be l<strong>in</strong>ked to <strong>the</strong> Basic Services<br />
for <strong>Urban</strong> Poor (BSUP), Integrated Hous<strong>in</strong>g and<br />
Slum Development Programme (IHSDP) for<br />
urban areas under <strong>the</strong> M<strong>in</strong>istry <strong>of</strong> Hous<strong>in</strong>g and<br />
<strong>Urban</strong> Poverty Alleviati<strong>on</strong> and to <strong>the</strong> <strong>Urban</strong> Wage<br />
Employment Programme, a comp<strong>on</strong>ent <strong>of</strong> Swarna<br />
Jayanti Shahri Rozgar Yojana (SJSRY) for urban<br />
areas outside slums. Likewise, <strong>the</strong> funds for new<br />
school c<strong>on</strong>structi<strong>on</strong> and water supply could be<br />
l<strong>in</strong>ked with <strong>the</strong> Sarva Shiksha Abhiyan under <strong>the</strong><br />
M<strong>in</strong>istry <strong>of</strong> Human Resources Development.<br />
4.3 Integrated Child Development<br />
Services<br />
The Integrated Child Development Services<br />
(ICDS) scheme launched <strong>in</strong> 1975 aims at holistic<br />
development <strong>of</strong> children up to six years <strong>of</strong> age<br />
as well as adolescent girls and pregnant and<br />
lactat<strong>in</strong>g mo<strong>the</strong>rs by provid<strong>in</strong>g a package <strong>of</strong><br />
services compris<strong>in</strong>g supplementary nutriti<strong>on</strong>,<br />
immunisati<strong>on</strong>, health check up, referral services,<br />
n<strong>on</strong>-formal pre-school educati<strong>on</strong> and health and<br />
nutriti<strong>on</strong> educati<strong>on</strong>. This is a centrally sp<strong>on</strong>sored<br />
scheme (CSS) where<strong>in</strong> <strong>the</strong> Government <strong>of</strong><br />
<strong>India</strong> (GoI) is resp<strong>on</strong>sible for <strong>the</strong> programme<br />
plann<strong>in</strong>g and <strong>in</strong>frastructure fund<strong>in</strong>g and <strong>the</strong> <strong>State</strong><br />
Government for programme implementati<strong>on</strong><br />
and supplementary nutriti<strong>on</strong>. GoI also provides<br />
assistance for implementati<strong>on</strong> <strong>of</strong> Kishori<br />
Shakti Yojana (KSY), Nutriti<strong>on</strong> Programme for<br />
Category<br />
Table 4.10<br />
Revised Feed<strong>in</strong>g Norms under ICDS, 2009<br />
Adolescent Girls (NPAG) and Pradhan Mantri<br />
Gramodaya Yojana (PMGY), all <strong>of</strong> which, are<br />
implemented through ICDS.<br />
The services under ICDS are <strong>of</strong>fered through<br />
a network <strong>of</strong> anganwadi centres. As <strong>on</strong> 31 March<br />
2009, around 1 milli<strong>on</strong> anganwadi centres were<br />
<strong>in</strong> operati<strong>on</strong> <strong>in</strong> <strong>the</strong> country (M<strong>in</strong>istry <strong>of</strong> Women<br />
and Child Development <strong>2010</strong>). They covered 37.5<br />
milli<strong>on</strong> children <strong>in</strong> <strong>the</strong> 6 m<strong>on</strong>ths to 3 years category<br />
and 34.7 milli<strong>on</strong> <strong>in</strong> <strong>the</strong> 3-6 years category under <strong>the</strong><br />
supplementary nutriti<strong>on</strong> programme. 15 milli<strong>on</strong><br />
pregnant women and lactat<strong>in</strong>g mo<strong>the</strong>rs benefited<br />
from supplementary nutriti<strong>on</strong> from <strong>the</strong> centres.<br />
34 milli<strong>on</strong> children (17.4 milli<strong>on</strong> boys and 16.6<br />
milli<strong>on</strong> girls) <strong>in</strong> <strong>the</strong> 3-6 years age group benefited<br />
from pre-school educati<strong>on</strong> at <strong>the</strong> centres.<br />
The cost per child and nutriti<strong>on</strong> allocati<strong>on</strong><br />
was revised with effect from October 2008. The<br />
calorie levels were <strong>in</strong>creased by 200 calories <strong>in</strong><br />
<strong>the</strong> case <strong>of</strong> children and 100 calories <strong>in</strong> <strong>the</strong> case <strong>of</strong><br />
pregnant and lactat<strong>in</strong>g mo<strong>the</strong>rs. The corresp<strong>on</strong>d<strong>in</strong>g<br />
prote<strong>in</strong> requirements were <strong>in</strong>creased by 4-5g <strong>in</strong> <strong>the</strong><br />
case <strong>of</strong> children and 2-5g <strong>in</strong> <strong>the</strong> case <strong>of</strong> pregnant<br />
and lactat<strong>in</strong>g mo<strong>the</strong>rs. The details are given <strong>in</strong><br />
Table 4.10.<br />
Follow<strong>in</strong>g up <strong>on</strong> this, <strong>in</strong> resp<strong>on</strong>se to a PIL<br />
filed by <strong>the</strong> People’s Uni<strong>on</strong> for Civil Liberties<br />
(PUCL), <strong>the</strong> Supreme Court has re<strong>in</strong>forced <strong>the</strong><br />
implementati<strong>on</strong> <strong>of</strong> <strong>the</strong> revised norms vide its<br />
order <strong>of</strong> 22 April 2009 and has sought compliance<br />
reports from all <strong>the</strong> <strong>State</strong>s by 15 January <strong>2010</strong>.<br />
Revised rate<br />
(per beneficiary<br />
per day)<br />
Calories<br />
(Kcal)<br />
Prote<strong>in</strong><br />
(g)<br />
Children (6-72 m<strong>on</strong>ths) Rs.4.00 500 12.15<br />
Severely underweight children (6-72 m<strong>on</strong>ths) Rs.6.00 800 20.25<br />
Pregnant women and nurs<strong>in</strong>g mo<strong>the</strong>rs<br />
Source: http://www.wcd.nic.<strong>in</strong><br />
Rs.5.00 600 18-20
PUBLIC FOOD DELIVERY SYSTEMS IN URBAN INDIA 107<br />
The 61 st Round <strong>of</strong> <strong>the</strong> NSSO provides<br />
<strong>in</strong>formati<strong>on</strong> <strong>on</strong> <strong>the</strong> reach and access to ICDS.<br />
The rural picture had been analysed <strong>in</strong> RSFIRI.<br />
A similar exercise has been undertaken here to<br />
understand <strong>the</strong> urban scenario through Tables 4.11<br />
and 4.12.<br />
Table 4.11 shows <strong>the</strong> percentage <strong>of</strong> urban<br />
households from different social categories,<br />
report<strong>in</strong>g at least <strong>on</strong>e pers<strong>on</strong> benefit<strong>in</strong>g from <strong>the</strong><br />
ICDS. Like <strong>in</strong> <strong>the</strong> case <strong>of</strong> MDMS, <strong>the</strong> figures<br />
are percentages <strong>of</strong> beneficiary households to all<br />
Sl.<br />
No.<br />
Table 4.11<br />
Importance <strong>of</strong> ICDS for <strong>Urban</strong> Households across Different Social Groups, 2004-05<br />
<strong>State</strong>s<br />
households and not just <strong>the</strong> eligible <strong>on</strong>es with<br />
children below six years <strong>of</strong> age or <strong>on</strong>e or more<br />
pregnant/lactat<strong>in</strong>g women. The latter is clearly a<br />
subset <strong>of</strong> all sample households.<br />
Am<strong>on</strong>g urban households <strong>in</strong> <strong>the</strong> ST category,<br />
Karnataka (8.5 per cent), Maharashtra (5.6 per<br />
cent), and Orissa (5 per cent) reported utiliz<strong>in</strong>g<br />
ICDS. Am<strong>on</strong>g SC households, <strong>the</strong> figures were<br />
Kerala - 12.6 per cent, Maharashtra – 4.9 per cent<br />
and Haryana – 4.5 per cent. The numbers for <strong>the</strong><br />
o<strong>the</strong>r <strong>State</strong>s were much smaller.<br />
In terms <strong>of</strong> MPCE classes, as expected,<br />
utilisati<strong>on</strong> was found to be <strong>the</strong> highest am<strong>on</strong>g <strong>the</strong><br />
bottom three deciles (Table 4.12).<br />
The all-<strong>India</strong> average was 3.2 per cent,<br />
followed by 1.9 per cent <strong>in</strong> <strong>the</strong> middle 40 per<br />
Percentage <strong>of</strong> urban households across different social groups<br />
with atleast <strong>on</strong>e member benefit<strong>in</strong>g from ICDS<br />
ST SC OBC O<strong>the</strong>rs All<br />
1 Andhra Pradesh 0.4 2.8 0.5 0.8 1.0<br />
2 Assam 3.0 1.5 0.4 0.0 0.5<br />
3 Bihar 0.2 0.1 0.0 0.0 0.0<br />
4 Gujarat 3.0 2.5 8.2 3.1 4.4<br />
5 Haryana 0.0 4.5 3.7 2.4 3.0<br />
6 Karnataka 8.5 0.1 1.8 0.5 1.1<br />
7 Kerala 0.0 12.6 5.2 4.1 5.3<br />
8 Madhya Pradesh 5.6 4.9 3.1 2.6 3.2<br />
9 Maharashtra 5.6 4.9 3.1 2.6 3.2<br />
10 Orissa 5.0 3.9 7.1 3.7 4.9<br />
11 Punjab 0.0 0.1 0.0 0.1 0.1<br />
12 Rajasthan 0.0 0.0 0.5 0.0 0.2<br />
13 Tamil Nadu 0.0 2.1 3.5 0.8 3.0<br />
14 Uttar Pradesh 0.0 0.0 0.2 0.0 0.1<br />
15 West Bengal 0.2 2.5 0.8 0.9 1.2<br />
<strong>India</strong> 3.2 2.2 2.3 1.2 1.8<br />
Source: NSSO 2007c<br />
cent category. The percentage was highest <strong>in</strong><br />
Gujarat with 10.8 per cent <strong>of</strong> urban households <strong>in</strong><br />
<strong>the</strong> bottom 30 per cent MPCE category. Kerala,<br />
Maharashtra, Orissa, Tamil Nadu and Haryana<br />
fared better than <strong>the</strong> nati<strong>on</strong>al average <strong>in</strong> <strong>the</strong> bottom<br />
30 per cent c<strong>on</strong>sumpti<strong>on</strong> expenditure classes.
108 REPORT ON THE STATE OF FOOD INSECURITY IN URBAN INDIA<br />
Across occupati<strong>on</strong>al groups, 4 per cent<br />
<strong>of</strong> casual labour households and 2 per cent <strong>of</strong><br />
Table 4.12<br />
Importance <strong>of</strong> ICDS for <strong>Urban</strong> Households across Different C<strong>on</strong>sumer Expenditure Classes, 2004-05<br />
Sl.<br />
No.<br />
<strong>State</strong>s<br />
Percentage <strong>of</strong> urban households with at least <strong>on</strong>e member<br />
benefit<strong>in</strong>g from ICDS<br />
Bottom 30%<br />
<strong>of</strong> <strong>the</strong><br />
MPCE Classes<br />
Middle 40%<br />
<strong>of</strong> <strong>the</strong><br />
MPCE Classes<br />
Top 30%<br />
<strong>of</strong> <strong>the</strong><br />
MPCE Classes<br />
All<br />
Classes<br />
1 Andhra Pradesh 2.2 0.8 0.0 1.00<br />
2 Assam 0.4 1.1 0.0 0.50<br />
3 Bihar 0.2 0.0 0.0 0.00<br />
4 Gujarat 10.8 4.5 2.4 4.40<br />
5 Haryana 5.0 3.7 1.6 3.00<br />
6 Karnataka 2.5 1.5 0.0 1.10<br />
7 Kerala 9.9 6.8 2.7 5.30<br />
8 Madhya Pradesh 3.1 2.4 0.3 1.32<br />
9 Maharashtra 9.9 3.1 0.4 3.20<br />
10 Orissa 6.9 3.2 3.5 4.90<br />
11 Punjab 0.1 0.1 0.0 0.10<br />
12 Rajasthan 0.0 0.2 0.3 0.20<br />
13 Tamil Nadu 4.6 3.4 1.8 3.00<br />
14 Uttar Pradesh 0.5 0.0 0.0 0.09<br />
15 West Bengal 2.7 1.2 0.4 1.20<br />
<strong>India</strong> 3.2 1.9 0.7 1.80<br />
Source: NSSO 2007c<br />
self-employed households reported at least<br />
<strong>on</strong>e member benefit<strong>in</strong>g from ICDS (NSSO<br />
2007c).<br />
4.3.1 Evidence from <strong>State</strong> <str<strong>on</strong>g>Report</str<strong>on</strong>g>s <strong>of</strong><br />
NFHS 3<br />
<strong>State</strong>-level reports <strong>of</strong> NFHS 3 highlight<br />
some aspects <strong>of</strong> access or coverage and delivery/<br />
avail<strong>in</strong>g <strong>of</strong> ICDS services by <strong>the</strong> target populati<strong>on</strong><br />
(Tables 4.13 and 4.14).<br />
The percentage <strong>of</strong> children <strong>in</strong> <strong>the</strong> 0-6-years<br />
age group <strong>in</strong> urban areas covered under ICDS was<br />
<strong>the</strong> highest <strong>in</strong> Tamil Nadu at 94.5 per cent, followed<br />
by Karnataka (85 per cent) and Kerala (83.6 per<br />
cent). The percentage <strong>of</strong> children receiv<strong>in</strong>g any<br />
service from ICDS was however <strong>on</strong>ly 36 per cent<br />
<strong>in</strong> Tamil Nadu and 33 per cent and 16 per cent,<br />
respectively, <strong>in</strong> Kerala and Karnataka. At <strong>the</strong> lower<br />
end <strong>in</strong> terms <strong>of</strong> percentage <strong>of</strong> children covered<br />
were <strong>the</strong> Punjab – 17 per cent, Haryana – 22 per<br />
cent and Orissa – 21 per cent. Of this, no child<br />
reported receiv<strong>in</strong>g any benefit from <strong>the</strong> service <strong>in</strong><br />
<strong>the</strong> Punjab, about 4.3 benefited <strong>in</strong> Haryana while<br />
<strong>in</strong> Orissa <strong>the</strong> percentage was 41 per cent. In Table<br />
4.13, figures for Bihar, Madhya Pradesh and Uttar<br />
Pradesh <strong>in</strong>cluded Jharkhand, Chhattisgarh and<br />
Uttarakhand. The weighted average comb<strong>in</strong><strong>in</strong>g<br />
Bihar and Jharkhand has <strong>in</strong> fact hidden <strong>the</strong> poor<br />
performance <strong>of</strong> Bihar, with <strong>on</strong>ly 14 per cent <strong>of</strong><br />
children covered and n<strong>on</strong>e benefit<strong>in</strong>g from any <strong>of</strong><br />
<strong>the</strong> ICDS services.
Sl.<br />
No.<br />
<strong>State</strong>s<br />
PUBLIC FOOD DELIVERY SYSTEMS IN URBAN INDIA 109<br />
Table 4.13<br />
Salient Features <strong>of</strong> ICDS <strong>in</strong> <strong>Urban</strong> Areas, 2005-06<br />
Percentage <strong>of</strong><br />
children age 0-71<br />
m<strong>on</strong>ths <strong>in</strong> areas<br />
covered by an AWC<br />
Exam<strong>in</strong><strong>in</strong>g <strong>the</strong> percentage <strong>of</strong> mo<strong>the</strong>rs<br />
receiv<strong>in</strong>g any service from <strong>the</strong> anganwadi centres<br />
<strong>in</strong> urban areas (Table 4.14), it is clear that Tamil<br />
Nadu presented <strong>the</strong> best scenario while <strong>the</strong> Punjab<br />
presented <strong>the</strong> worst. In Tamil Nadu, while 61<br />
per cent <strong>of</strong> mo<strong>the</strong>rs had not received any ICDS<br />
service dur<strong>in</strong>g <strong>the</strong>ir pregnancy, <strong>in</strong> <strong>the</strong> Punjab no<br />
mo<strong>the</strong>r had reported receiv<strong>in</strong>g any ICDS service.<br />
Bihar’s performance is equally deplorable with<br />
100 per cent <strong>of</strong> mo<strong>the</strong>rs report<strong>in</strong>g ‘no service’<br />
Percentage <strong>of</strong> children age 0-71 m<strong>on</strong>ths who received some<br />
service from an AWC<br />
Any Service Supplementary<br />
<strong>Food</strong><br />
Immunisati<strong>on</strong> Health<br />
Check-up<br />
1 Andhra Pradesh 74.5 22.4 20.5 10.0 8.5<br />
2 Assam 31.9 21.2 17.8 5.1 4.2<br />
3 Bihar 54.9 14.2 8.2 10.4 2.4<br />
4 Gujarat 68.2 29.0 21.6 20.3 20.1<br />
5 Haryana 21.7 4.3 2.9 2.9 2.9<br />
6 Karnataka 85.0 16.0 11.2 10.7 6.5<br />
7 Kerala 83.6 32.8 24.4 9.4 17.2<br />
8 Madhya Pradesh 41.8 45.3 39.3 26.7 21.9<br />
9 Maharashtra 47.8 23.9 21.5 13.0 16.0<br />
10 Orissa 20.7 41.3 26.9 14.4 26.9<br />
11 Punjab 17.4 0.0 0.0 0.0 0.0<br />
12 Rajasthan 27.3 4.6 2.0 3.3 1.3<br />
13 Tamil Nadu 94.5 36.1 25.2 26.6 22.7<br />
14 Uttar Pradesh 27.0 10.6 8.3 5.1 3.6<br />
15 West Bengal 61.4 18.4 16.2 6.9 7.6<br />
<strong>India</strong> NA 23.4 NA 13.9 NA<br />
Note: AWC- Anganwadi Centre<br />
AWC services for children <strong>in</strong>clude distributi<strong>on</strong> <strong>of</strong> supplementary food, growth m<strong>on</strong>itor<strong>in</strong>g, immunisati<strong>on</strong>, health<br />
check-up and pre-school educati<strong>on</strong><br />
Source: NFHS 2007<br />
from ICDS. As expla<strong>in</strong>ed earlier, c<strong>on</strong>sider<strong>in</strong>g that<br />
Table 4.14 provides <strong>the</strong> weighted average <strong>of</strong> Bihar<br />
and Jharkhand and presents it as <strong>the</strong> figure <strong>of</strong><br />
Bihar, <strong>the</strong> poor status <strong>of</strong> Bihar has got hidden here.<br />
Tamil Nadu aga<strong>in</strong> presented <strong>the</strong> most positive<br />
picture, with 39 per cent women avail<strong>in</strong>g <strong>of</strong> some<br />
service from <strong>the</strong> anganwadi centre, 27 per cent<br />
receiv<strong>in</strong>g health and nutriti<strong>on</strong> educati<strong>on</strong>, 26 per<br />
cent undergo<strong>in</strong>g health check-up and 37 per cent<br />
receiv<strong>in</strong>g supplementary food.
110 REPORT ON THE STATE OF FOOD INSECURITY IN URBAN INDIA<br />
Sl.<br />
No.<br />
Table 4.14<br />
Utilisati<strong>on</strong> <strong>of</strong> ICDS Services by Mo<strong>the</strong>rs dur<strong>in</strong>g Pregnancy <strong>in</strong> <strong>Urban</strong> Areas, 2005-06<br />
<strong>State</strong>s<br />
Percentage <strong>of</strong> mo<strong>the</strong>rs received any/no services from an AWC dur<strong>in</strong>g pregnancy<br />
No service Supplementary<br />
food<br />
The availability <strong>of</strong> o<strong>the</strong>r opti<strong>on</strong>s like private<br />
hospitals may be a reas<strong>on</strong> for fewer women go<strong>in</strong>g<br />
to <strong>the</strong> ICDS centres for health check-up, but that<br />
would not have been a natural choice for <strong>the</strong> urban<br />
poor, had a well-functi<strong>on</strong><strong>in</strong>g anganwadi centre<br />
been accessible to <strong>the</strong>m. The extent <strong>of</strong> coverage<br />
says a lot about <strong>the</strong> lack <strong>of</strong> sufficient outreach<br />
<strong>of</strong> <strong>the</strong> scheme, especially c<strong>on</strong>sider<strong>in</strong>g <strong>the</strong><br />
fact that <strong>the</strong> nutriti<strong>on</strong> <strong>in</strong>dicators (e.g., level <strong>of</strong><br />
anemia, chr<strong>on</strong>ic energy deficiency, underweight),<br />
especially with reference to both children and<br />
women <strong>in</strong> <strong>the</strong> reproductive age group as seen <strong>in</strong><br />
Chapter 3, have been far from acceptable. At <strong>the</strong><br />
all-<strong>India</strong> level, 72 per cent <strong>of</strong> <strong>the</strong> children <strong>in</strong> <strong>the</strong><br />
under-three age group <strong>in</strong> urban areas suffered from<br />
anemia, 37.4 per cent were stunted and 30 per cent<br />
underweight; 51 per cent <strong>of</strong> ever married women<br />
<strong>in</strong> <strong>the</strong> 15-49 years category <strong>in</strong> urban areas suffered<br />
from anemia and 25 per cent from chr<strong>on</strong>ic energy<br />
deficiency.<br />
Health<br />
check-up<br />
Health and nutriti<strong>on</strong><br />
educati<strong>on</strong><br />
1 Andhra Pradesh 81.8 17.7 8.2 11.3<br />
2 Assam 83.1 16.9 3.4 4.2<br />
3 Bihar 93.7 6.1 1.4 2.4<br />
4 Gujarat 83.4 14.8 7.2 8.1<br />
5 Haryana 97.1 2.9 0.0 0.0<br />
6 Karnataka 86.8 12.5 6.1 9.5<br />
7 Kerala 81.9 16.3 8.1 11.3<br />
8 Madhya Pradesh 64.8 32.2 16.1 15.0<br />
9 Maharashtra 88.2 9.9 5.6 3.7<br />
10 Orissa 79.8 8.7 19.2 10.6<br />
11 Punjab 100.0 0.0 0.0 0.0<br />
12 Rajasthan 94.1 4.6 3.3 2.6<br />
13 Tamil Nadu 61.4 37.1 26.1 27.1<br />
14 Uttar Pradesh 95.4 4.5 2.6 2.1<br />
15 West Bengal 86.7 12.9 4.5 5.7<br />
<strong>India</strong> 83.2 15.6 8.5 9.3<br />
Source: NFHS 2007<br />
The Eleventh Five Year Plan has also rightly<br />
emphasised <strong>the</strong> aspect <strong>of</strong> sanitati<strong>on</strong> and its close<br />
l<strong>in</strong>k to absorpti<strong>on</strong>:<br />
Poor sanitati<strong>on</strong> leads to high <strong>in</strong>cidence <strong>of</strong><br />
diarrhoeal disease <strong>in</strong> <strong>the</strong> early years, underm<strong>in</strong><strong>in</strong>g<br />
whatever little poor nutriti<strong>on</strong> <strong>the</strong> <strong>in</strong>fant takes <strong>in</strong>;<br />
hence, <strong>the</strong> Total Sanitati<strong>on</strong> Campaign (TSC) must<br />
force its pace, particularly <strong>in</strong> urban areas where <strong>the</strong><br />
density <strong>of</strong> populati<strong>on</strong> is high and <strong>the</strong> risk <strong>of</strong> fecal<br />
c<strong>on</strong>tam<strong>in</strong>ati<strong>on</strong> even higher than <strong>in</strong> rural areas.<br />
(Plann<strong>in</strong>g Commissi<strong>on</strong> 2007: 143).<br />
The document fur<strong>the</strong>r states that <strong>the</strong> ‘aim<br />
should be to halve <strong>the</strong> <strong>in</strong>cidence <strong>of</strong> malnutriti<strong>on</strong> <strong>in</strong><br />
children by <strong>the</strong> end <strong>of</strong> <strong>the</strong> Eleventh Plan from 46 to<br />
23 per cent and to reduce anaemia am<strong>on</strong>g pregnant<br />
women and children to under 10 per cent’ (ibid).<br />
It maybe noted <strong>in</strong> <strong>the</strong> light <strong>of</strong> <strong>the</strong> above,<br />
that <strong>the</strong> Uni<strong>on</strong> Budget for 2009-10 has proposed
PUBLIC FOOD DELIVERY SYSTEMS IN URBAN INDIA 111<br />
that all services under ICDS would be extended<br />
to every child under <strong>the</strong> age <strong>of</strong> six by March<br />
2012 – a tall order, c<strong>on</strong>sider<strong>in</strong>g that <strong>on</strong>ly about<br />
30 per cent <strong>of</strong> <strong>the</strong> children were covered under<br />
<strong>the</strong> supplementary nutriti<strong>on</strong> programme under<br />
ICDS as <strong>on</strong> 31 March 2006 (MSSRF-WFP 2008).<br />
The budgetary allocati<strong>on</strong> for ICDS <strong>in</strong> 2009-10 at<br />
Rs.6,705 crore was <strong>on</strong>ly marg<strong>in</strong>ally higher than<br />
<strong>the</strong> Rs.6,300 allocated <strong>in</strong> 2008-09, just a 6.4 per<br />
cent <strong>in</strong>crease compared to <strong>the</strong> 19 per cent <strong>in</strong>crease<br />
<strong>in</strong> each <strong>of</strong> <strong>the</strong> previous two years The allocati<strong>on</strong> <strong>in</strong><br />
<strong>the</strong> <strong>2010</strong>-11 Budget at Rs.8,700 crore represents a<br />
29.8 per cent <strong>in</strong>crease. This <strong>in</strong>cludes expenditure<br />
<strong>on</strong> expansi<strong>on</strong> <strong>of</strong> <strong>the</strong> ICDS platform for effective<br />
implementati<strong>on</strong> <strong>of</strong> <strong>the</strong> Rajiv Gandhi Scheme for<br />
Adolescent Girls 41 . Therefore, given <strong>the</strong> ground<br />
to be covered, <strong>the</strong> <strong>in</strong>creased allocati<strong>on</strong> is ra<strong>the</strong>r<br />
<strong>in</strong>adequate.<br />
41 The Kishori Shakti Yojana (KSY) and <strong>the</strong> Nutriti<strong>on</strong> Programme for Adolescent Girls (NPAG) have been subsumed under this new<br />
scheme.
5.1 Brief Review<br />
CHAPTER 5<br />
C<strong>on</strong>clusi<strong>on</strong>s and Policy<br />
Recommendati<strong>on</strong>s<br />
This <str<strong>on</strong>g>Report</str<strong>on</strong>g> began by exam<strong>in</strong><strong>in</strong>g some<br />
general aspects <strong>of</strong> <strong>the</strong> situati<strong>on</strong> and <strong>the</strong> challenge<br />
<strong>of</strong> urban food security <strong>in</strong> <strong>the</strong> c<strong>on</strong>temporary c<strong>on</strong>text.<br />
In particular, <strong>the</strong> c<strong>on</strong>cerns <strong>in</strong> respect <strong>of</strong> food and<br />
nutriti<strong>on</strong> security were explored – <strong>in</strong> urban areas<br />
both worldwide and, more specifically, <strong>in</strong> <strong>India</strong> –<br />
dur<strong>in</strong>g <strong>the</strong> period <strong>of</strong> globalisati<strong>on</strong> start<strong>in</strong>g from <strong>the</strong><br />
1980s. The situati<strong>on</strong> <strong>of</strong> <strong>India</strong> and its major <strong>State</strong>s<br />
were studied with regard to urban food security<br />
by look<strong>in</strong>g at <strong>the</strong> three aspects <strong>of</strong> availability,<br />
access and absorpti<strong>on</strong>. S<strong>in</strong>ce data <strong>on</strong> urban food<br />
availability was difficult to obta<strong>in</strong>, <strong>the</strong> focus was <strong>on</strong><br />
<strong>the</strong> access <strong>in</strong>dicators <strong>in</strong> terms <strong>of</strong> employment and<br />
calorie <strong>in</strong>take, and absorpti<strong>on</strong> <strong>in</strong>dicators <strong>in</strong> terms<br />
<strong>of</strong> basic amenities. The situati<strong>on</strong> <strong>in</strong> slums was<br />
also briefly dealt with. Follow<strong>in</strong>g this discussi<strong>on</strong>,<br />
<strong>the</strong> c<strong>on</strong>structi<strong>on</strong> <strong>of</strong> an <strong>in</strong>dex <strong>of</strong> food and nutriti<strong>on</strong><br />
<strong>in</strong>security for <strong>the</strong> urban areas <strong>of</strong> <strong>the</strong> major <strong>State</strong>s <strong>of</strong><br />
<strong>India</strong> was carried out. The emphasis was <strong>on</strong> chr<strong>on</strong>ic<br />
food and nutriti<strong>on</strong> <strong>in</strong>security, and <strong>the</strong> problems <strong>of</strong><br />
transitory and silent hunger were not dealt with.<br />
Six variants <strong>of</strong> <strong>the</strong> <strong>in</strong>dex were computed, <strong>of</strong><br />
which <strong>on</strong>e was identified as most appropriate. It<br />
was also shown that <strong>the</strong> rank<strong>in</strong>gs across <strong>the</strong> <strong>State</strong>s<br />
did not change dramatically across <strong>the</strong> different<br />
variants c<strong>on</strong>sidered.<br />
The outcome measures that have been utilised<br />
<strong>in</strong> <strong>on</strong>e or more variants <strong>of</strong> <strong>the</strong> composite <strong>in</strong>dex<br />
<strong>of</strong> urban food security <strong>in</strong>cluded <strong>the</strong> percentages,<br />
respectively, <strong>of</strong><br />
•<br />
•<br />
•<br />
•<br />
•<br />
ever married women aged 15-49 years<br />
who are anaemic.<br />
ever married women (15-49 yrs) with<br />
chr<strong>on</strong>ic energy deficiency.<br />
children <strong>in</strong> <strong>the</strong> age group 6-35 m<strong>on</strong>ths<br />
who are anaemic.<br />
children <strong>in</strong> <strong>the</strong> age group 6-35 m<strong>on</strong>ths<br />
who are stunted.<br />
children <strong>in</strong> <strong>the</strong> age group 6-35 m<strong>on</strong>ths<br />
underweight.<br />
The five <strong>in</strong>put measures c<strong>on</strong>sidered were <strong>the</strong><br />
•<br />
•<br />
•<br />
•<br />
•<br />
percentage <strong>of</strong> urban populati<strong>on</strong><br />
c<strong>on</strong>sum<strong>in</strong>g less than 1890 Kcal/cu/diem<br />
percentage <strong>of</strong> urban households not<br />
hav<strong>in</strong>g access to safe dr<strong>in</strong>k<strong>in</strong>g water<br />
percentage <strong>of</strong> urban households not<br />
hav<strong>in</strong>g access to toilets<br />
number <strong>of</strong> male workers per 1000<br />
workers not ‘regularly’ employed<br />
number <strong>of</strong> female workers per 1000<br />
workers not ‘regularly’ employed
114 REPORT ON THE STATE OF FOOD INSECURITY IN URBAN INDIA<br />
A comparis<strong>on</strong> <strong>of</strong> <strong>the</strong> <strong>in</strong>dex values for both<br />
periods (1998-2000 and 2004-06) suggested a<br />
ra<strong>the</strong>r modest improvement <strong>of</strong> <strong>the</strong> urban food<br />
security situati<strong>on</strong> across <strong>the</strong> country as measured<br />
by <strong>of</strong>ficial data, with <strong>the</strong> qualifier that <strong>the</strong> data <strong>on</strong><br />
access to safe dr<strong>in</strong>k<strong>in</strong>g water and to toilets may<br />
have, <strong>in</strong> many cases, overstated <strong>the</strong> actual access <strong>on</strong><br />
<strong>the</strong> ground <strong>in</strong> view <strong>of</strong> <strong>the</strong> reality <strong>of</strong> n<strong>on</strong>-/<strong>in</strong>adequate<br />
functi<strong>on</strong><strong>in</strong>g/provisi<strong>on</strong> 42 . An exam<strong>in</strong>ati<strong>on</strong> <strong>of</strong> <strong>the</strong><br />
outcome <strong>in</strong>dicators al<strong>on</strong>e suggests worsen<strong>in</strong>g<br />
<strong>in</strong> most <strong>State</strong>s <strong>in</strong> respect <strong>of</strong> all <strong>of</strong> <strong>the</strong>m, with <strong>the</strong><br />
excepti<strong>on</strong> <strong>of</strong> <strong>the</strong> percentage <strong>of</strong> urban children<br />
underweight. The percentage <strong>of</strong> anaemia am<strong>on</strong>g<br />
women and am<strong>on</strong>g children, <strong>the</strong> percentage <strong>of</strong><br />
women with CED, and <strong>the</strong> percentage <strong>of</strong> children<br />
stunted or wast<strong>in</strong>g – all <strong>the</strong>se <strong>in</strong>dicators worsened<br />
for <strong>India</strong> as a whole and for a number <strong>of</strong> <strong>State</strong>s<br />
between 1998-2000 and 2004-06. Measured by an<br />
<strong>in</strong>dex based <strong>on</strong> <strong>the</strong>se <strong>in</strong>dicators, urban food security<br />
has improved for Bihar, Kerala, Maharashtra,<br />
Orissa, Rajasthan, Tamil Nadu, Uttar Pradesh and<br />
West Bengal. Of <strong>the</strong>se, <strong>the</strong> improvement has been<br />
marg<strong>in</strong>al <strong>in</strong> <strong>the</strong> case <strong>of</strong> Maharashtra and Tamil<br />
Nadu. On <strong>the</strong> o<strong>the</strong>r hand, several <strong>State</strong>s showed<br />
c<strong>on</strong>siderable deteriorati<strong>on</strong> – Andhra Pradesh,<br />
Assam, Gujarat, Haryana, Karnataka and Madhya<br />
Pradesh. The Punjab showed a marg<strong>in</strong>al worsen<strong>in</strong>g.<br />
This suggests that <strong>the</strong> food security situati<strong>on</strong><br />
may have deteriorated ra<strong>the</strong>r than improved for<br />
a sizeable segment <strong>of</strong> <strong>the</strong> urban populati<strong>on</strong> <strong>in</strong><br />
<strong>the</strong> country between 1998-2000 and 2004-06 43 .<br />
When <strong>on</strong>e takes <strong>in</strong>to account <strong>the</strong> fact that <strong>the</strong>se<br />
are urban average <strong>in</strong>dicator values, and that urban<br />
<strong>in</strong>equality has worsened <strong>in</strong> <strong>the</strong> period s<strong>in</strong>ce 1991,<br />
<strong>the</strong> implicati<strong>on</strong>s for <strong>the</strong> food security status <strong>of</strong> <strong>the</strong><br />
urban poor or slum dwellers are worry<strong>in</strong>g, to say<br />
<strong>the</strong> least.<br />
The analysis brought out significant changes<br />
<strong>in</strong> <strong>the</strong> relative rank<strong>in</strong>g <strong>of</strong> various <strong>State</strong>s between<br />
1998-2000 and 2004-2006. While urban Punjab<br />
rema<strong>in</strong>ed <strong>the</strong> least food <strong>in</strong>secure, several o<strong>the</strong>r<br />
<strong>State</strong>s were observed to have become relatively<br />
less food <strong>in</strong>secure between 1998-2000 and 2004-<br />
06. In particular, Bihar, Uttar Pradesh, Orissa,<br />
Madhya Pradesh and Rajasthan, which figured<br />
at <strong>the</strong> bottom <strong>of</strong> <strong>the</strong> list <strong>in</strong> 1998-2000, have all<br />
shown significant improvement <strong>in</strong> <strong>the</strong>ir urban<br />
food security status. However, four <strong>of</strong> <strong>the</strong>se five<br />
<strong>State</strong>s c<strong>on</strong>t<strong>in</strong>ued to be at <strong>the</strong> bottom end <strong>in</strong> 2004-<br />
06 as well, despite <strong>the</strong>ir improvement between <strong>the</strong><br />
two periods <strong>in</strong> absolute terms. The <strong>on</strong>ly excepti<strong>on</strong><br />
has been Uttar Pradesh, which showed a dramatic<br />
improvement – worth explor<strong>in</strong>g <strong>in</strong> detail. Rajasthan<br />
has been <strong>the</strong> most sluggish performer <strong>in</strong> this group<br />
<strong>in</strong> terms <strong>of</strong> <strong>the</strong> degree <strong>of</strong> improvement between<br />
<strong>the</strong> two periods, though it c<strong>on</strong>t<strong>in</strong>ued to be ahead<br />
<strong>of</strong> Bihar, Madhya Pradesh and Orissa, except <strong>in</strong><br />
<strong>on</strong>e variant where it ended up slightly worse <strong>of</strong>f<br />
than Orissa. The Punjab, Kerala, Gujarat, West<br />
Bengal and Tamil Nadu all showed improvement.<br />
Of <strong>the</strong> rema<strong>in</strong><strong>in</strong>g five <strong>State</strong>s (Andhra Pradesh,<br />
Assam, Haryana, Karnataka and Maharashtra),<br />
Andhra Pradesh and Haryana did more poorly <strong>in</strong><br />
2004-06 than <strong>in</strong> 1998-2000, <strong>in</strong> all <strong>the</strong> six variants<br />
<strong>of</strong> <strong>the</strong> composite <strong>in</strong>dex c<strong>on</strong>sidered. Karnataka was<br />
<strong>in</strong> <strong>the</strong> same situati<strong>on</strong> except for <strong>on</strong>e variant <strong>of</strong> <strong>the</strong><br />
<strong>in</strong>dex. Assam improved between 1998-2000 and<br />
2004-06 <strong>in</strong> terms <strong>of</strong> four <strong>of</strong> <strong>the</strong> six variants but<br />
worsened <strong>in</strong> terms <strong>of</strong> <strong>the</strong> o<strong>the</strong>r two. Maharashtra<br />
improved under three variants and deteriorated<br />
under <strong>the</strong> o<strong>the</strong>r three. Thus, <strong>the</strong> overall marg<strong>in</strong>al<br />
improvement <strong>in</strong> urban food security <strong>in</strong> <strong>India</strong> as<br />
42 One may also note <strong>the</strong> po<strong>in</strong>t that <strong>the</strong> regard<strong>in</strong>g <strong>of</strong> an <strong>in</strong>crease <strong>in</strong> <strong>the</strong> share <strong>of</strong> ‘regular employment’ as an <strong>in</strong>dicator <strong>of</strong> relative security <strong>of</strong><br />
earn<strong>in</strong>gs and hence <strong>of</strong> food security, while not entirely <strong>in</strong>correct, may n<strong>on</strong>e<strong>the</strong>less not be categorically valid if earn<strong>in</strong>gs have decl<strong>in</strong>ed <strong>in</strong><br />
relati<strong>on</strong> to prices over <strong>the</strong> two periods.<br />
43 There is little change <strong>in</strong> <strong>the</strong> patterns if percentage <strong>of</strong> children stunted is replaced by percentage underweight, except that, while <strong>the</strong> <strong>in</strong>dex<br />
for <strong>India</strong> as a whole showed improvement, <strong>the</strong> Punjab did much worse. One w<strong>on</strong>ders whe<strong>the</strong>r <strong>the</strong> apparent decl<strong>in</strong>e <strong>in</strong> <strong>the</strong> percentage <strong>of</strong><br />
children underweight may <strong>in</strong> fact reflect <strong>the</strong> <strong>in</strong>creas<strong>in</strong>g <strong>in</strong>cidence <strong>of</strong> overweight children, ano<strong>the</strong>r manifestati<strong>on</strong> <strong>of</strong> poor nutriti<strong>on</strong>, but <strong>of</strong><br />
<strong>the</strong> opposite k<strong>in</strong>d.
measured by <strong>the</strong> composite <strong>in</strong>dex <strong>in</strong> all its variants<br />
was accompanied by significant improvement<br />
<strong>in</strong> <strong>the</strong> poorer <strong>State</strong>s, and, <strong>in</strong> <strong>the</strong> case <strong>of</strong> <strong>the</strong> more<br />
developed <strong>State</strong>s, by improvement <strong>in</strong> some,<br />
worsen<strong>in</strong>g <strong>in</strong> o<strong>the</strong>rs. The fact that <strong>the</strong> picture looks<br />
much less rosy when an assessment based purely<br />
<strong>on</strong> outcome measures is made suggests that <strong>the</strong>re<br />
is no room for complacency <strong>on</strong> <strong>the</strong> issue <strong>of</strong> urban<br />
food security. If anyth<strong>in</strong>g, it is disappo<strong>in</strong>t<strong>in</strong>g that<br />
urban ec<strong>on</strong>omic growth has made no dent <strong>on</strong> urban<br />
food <strong>in</strong>security.<br />
Detailed analysis <strong>of</strong> <strong>the</strong> performance <strong>of</strong> each<br />
<strong>State</strong> as well as reas<strong>on</strong>s for deteriorati<strong>on</strong> <strong>in</strong> rank<strong>in</strong>g<br />
<strong>on</strong> <strong>the</strong> urban food security scale would require<br />
more <strong>State</strong>-specific, disaggregated research. It is<br />
<strong>in</strong>terest<strong>in</strong>g to note, however, that three <strong>State</strong>s that<br />
have seen a spate <strong>of</strong> farmer suicides <strong>in</strong> <strong>the</strong> decade<br />
from <strong>the</strong> year 2000 – Maharashtra, Andhra Pradesh<br />
and Karnataka – f<strong>in</strong>d <strong>the</strong>mselves <strong>in</strong> <strong>the</strong> category<br />
where urban food <strong>in</strong>security has worsened between<br />
1998-2000 and 2004-06. Karnataka and Andhra<br />
Pradesh have generally been highlighted as urban<br />
growth exemplars and <strong>the</strong>ir poor performance<br />
over <strong>the</strong> period under discussi<strong>on</strong> is good reas<strong>on</strong><br />
for critical reflecti<strong>on</strong> <strong>on</strong> <strong>the</strong> underly<strong>in</strong>g model <strong>of</strong><br />
urban growth. Haryana’s poor performance calls<br />
for fur<strong>the</strong>r analysis. Likewise, and <strong>in</strong> <strong>the</strong> opposite<br />
directi<strong>on</strong>, Uttar Pradesh merits a closer analysis <strong>of</strong><br />
its seem<strong>in</strong>gly impressive improvement. F<strong>in</strong>ally,<br />
while <strong>the</strong> improvement <strong>in</strong> <strong>the</strong> poorer <strong>State</strong>s may<br />
be regarded as a cause for satisfacti<strong>on</strong>, it must be<br />
emphasised that <strong>the</strong>y are still <strong>the</strong> most food <strong>in</strong>secure<br />
<strong>State</strong>s, with <strong>the</strong> excepti<strong>on</strong> <strong>of</strong> Uttar Pradesh, even as<br />
measured by <strong>the</strong> composite <strong>in</strong>dex with its reliance<br />
<strong>on</strong> sec<strong>on</strong>dary data <strong>of</strong> uncerta<strong>in</strong> quality <strong>in</strong> respect<br />
<strong>of</strong> <strong>in</strong>take <strong>in</strong>dicators relat<strong>in</strong>g to absorpti<strong>on</strong>.<br />
By this <str<strong>on</strong>g>Report</str<strong>on</strong>g>’s measure <strong>of</strong> food <strong>in</strong>security,<br />
<strong>the</strong> period <strong>of</strong> ec<strong>on</strong>omic reforms and high GDP<br />
growth has not seen a clear improvement <strong>in</strong> urban<br />
food security across all <strong>the</strong> <strong>State</strong>s. While <strong>the</strong> poorer<br />
<strong>State</strong>s have d<strong>on</strong>e better than before, <strong>the</strong>se <strong>State</strong>s<br />
CONCLUSIONS AND POLICY RECOMMENDATIONS 115<br />
account for <strong>on</strong>ly a small part <strong>of</strong> <strong>the</strong> country’s<br />
urban populati<strong>on</strong>. On <strong>the</strong> o<strong>the</strong>r hand, <strong>State</strong>s like<br />
Maharashtra, Andhra Pradesh, Karnataka and<br />
Haryana, which are relatively more urbanised,<br />
have d<strong>on</strong>e poorly. It is <strong>in</strong>terest<strong>in</strong>g to recall that, <strong>in</strong><br />
Mahrashtra, Andhra Pradesh and Karnataka, rural<br />
food <strong>in</strong>security had also risen between 1998-2000<br />
and 2004-06. Equally strik<strong>in</strong>g, Gujarat’s apparent<br />
improvement vanished when an outcomes-based<br />
<strong>in</strong>dex is used to compare performance <strong>in</strong> 1998-<br />
2000 with that <strong>in</strong> 2004-06. C<strong>on</strong>sider<strong>in</strong>g that<br />
Gujarat and Karnataka figured am<strong>on</strong>g <strong>the</strong> <strong>State</strong>s<br />
with <strong>the</strong> fastest rates <strong>of</strong> growth <strong>of</strong> GDP between<br />
1993-94 and 2004-05, this is decisive pro<strong>of</strong>, if<br />
pro<strong>of</strong> were needed, <strong>of</strong> <strong>the</strong> propositi<strong>on</strong> that growth<br />
by itself will not take care <strong>of</strong> malnutriti<strong>on</strong> or food<br />
<strong>in</strong>security.<br />
This should not be altoge<strong>the</strong>r surpris<strong>in</strong>g.<br />
Many analysts have po<strong>in</strong>ted out that <strong>the</strong> period<br />
<strong>of</strong> reforms has been marked by deflati<strong>on</strong>ary<br />
macroec<strong>on</strong>omic policies that have hurt <strong>the</strong><br />
purchas<strong>in</strong>g power <strong>of</strong> <strong>the</strong> bulk <strong>of</strong> <strong>the</strong> work<strong>in</strong>g<br />
populati<strong>on</strong>, <strong>in</strong> both urban and rural areas. Attenti<strong>on</strong><br />
has been drawn to <strong>the</strong> overwhelm<strong>in</strong>g crisis <strong>in</strong><br />
agriculture, marked not <strong>on</strong>ly by <strong>the</strong> tragic and<br />
visible phenomen<strong>on</strong> <strong>of</strong> farmers’ suicides <strong>in</strong> several<br />
<strong>State</strong>s, but by <strong>the</strong> near stagnati<strong>on</strong> <strong>in</strong> foodgra<strong>in</strong><br />
output for almost a decade between <strong>the</strong> late 1990s<br />
and <strong>the</strong> first six years <strong>of</strong> <strong>the</strong> sec<strong>on</strong>d millenium.<br />
A number <strong>of</strong> factors have c<strong>on</strong>tributed to <strong>the</strong> crisis<br />
<strong>of</strong> <strong>the</strong> rural and agrarian ec<strong>on</strong>omy, <strong>in</strong>clud<strong>in</strong>g <strong>the</strong><br />
cutbacks <strong>in</strong> rural development expenditures <strong>of</strong> <strong>the</strong><br />
government, <strong>the</strong> sharp <strong>in</strong>crease <strong>in</strong> <strong>in</strong>put costs for<br />
farmers because <strong>of</strong> <strong>the</strong> reducti<strong>on</strong> <strong>in</strong> <strong>in</strong>put subsidies<br />
as part <strong>of</strong> <strong>the</strong> fiscal squeeze, <strong>the</strong> fall <strong>in</strong> output prices<br />
<strong>on</strong> account <strong>of</strong> removal <strong>of</strong> quantitative restricti<strong>on</strong>s<br />
<strong>on</strong> agricultural imports (which have, <strong>in</strong>cidentally,<br />
grown manifold over <strong>the</strong> reform period), <strong>the</strong> credit<br />
squeeze as a c<strong>on</strong>sequence <strong>of</strong> f<strong>in</strong>ancial liberalisati<strong>on</strong><br />
result<strong>in</strong>g both <strong>in</strong> higher real <strong>in</strong>terest rates and <strong>in</strong><br />
lower rates <strong>of</strong> growth <strong>of</strong> <strong>in</strong>stituti<strong>on</strong>al credit for
116 REPORT ON THE STATE OF FOOD INSECURITY IN URBAN INDIA<br />
agriculture and allied activities, and <strong>the</strong> reducti<strong>on</strong><br />
<strong>in</strong> government <strong>in</strong>vestments and o<strong>the</strong>r expenditure<br />
<strong>on</strong> agricultural research and development and<br />
extensi<strong>on</strong>. Growth <strong>of</strong> employment <strong>in</strong> urban <strong>India</strong><br />
was lower <strong>in</strong> <strong>the</strong> period between 1993-94 and<br />
1999-2000, compared to 1988-1993/94, go<strong>in</strong>g<br />
by <strong>the</strong> data from <strong>the</strong> 50 th and 55 th rounds <strong>of</strong> <strong>the</strong><br />
NSSO. The <strong>in</strong>crease <strong>in</strong> <strong>the</strong> rate <strong>of</strong> growth <strong>of</strong> rural<br />
employment between 1999-2000 and 2004-05 as<br />
seen from <strong>the</strong> 61 st round <strong>of</strong> NSSO has still not<br />
been sufficient to reach <strong>the</strong> rural employment<br />
growth rates <strong>of</strong> <strong>the</strong> period 1983-1993/94. Fur<strong>the</strong>r,<br />
much <strong>of</strong> <strong>the</strong> growth <strong>in</strong> employment <strong>in</strong> <strong>the</strong> period<br />
1999-2000 to 2004-05 <strong>in</strong> both rural and urban<br />
<strong>India</strong> has been <strong>in</strong> self-employment and <strong>in</strong> <strong>in</strong>formal<br />
sector activities, rais<strong>in</strong>g serious questi<strong>on</strong>s about<br />
<strong>the</strong> quality and terms <strong>of</strong> employment and <strong>the</strong><br />
impact <strong>on</strong> food security <strong>of</strong> such employment.<br />
This has been brought out <strong>in</strong> detail <strong>in</strong> Chapter 2<br />
<strong>of</strong> this <str<strong>on</strong>g>Report</str<strong>on</strong>g>, illustrat<strong>in</strong>g <strong>the</strong> fact that, <strong>in</strong> terms<br />
<strong>of</strong> employment and earn<strong>in</strong>gs, c<strong>on</strong>sumpti<strong>on</strong> levels<br />
and calorie <strong>in</strong>takes, and provisi<strong>on</strong> <strong>of</strong> amenities,<br />
<strong>the</strong> period under discussi<strong>on</strong> has seen little progress<br />
and possibly some deteriorati<strong>on</strong> <strong>in</strong> urban <strong>India</strong>,<br />
and especially <strong>in</strong> <strong>the</strong> smaller towns. It may not be<br />
far <strong>of</strong>f <strong>the</strong> mark to suggest that <strong>the</strong> crisis <strong>of</strong> <strong>the</strong><br />
rural ec<strong>on</strong>omy would have had some impact <strong>on</strong><br />
urban areas as well. Besides, <strong>the</strong> failure <strong>of</strong> <strong>the</strong><br />
government to expand provisi<strong>on</strong> <strong>of</strong> amenities<br />
adequately, especially <strong>in</strong> <strong>the</strong> case <strong>of</strong> small and<br />
medium towns, would also have had a negative<br />
impact <strong>on</strong> <strong>the</strong> absorpti<strong>on</strong> aspect <strong>of</strong> urban food<br />
security.<br />
After analys<strong>in</strong>g <strong>the</strong> trends <strong>in</strong> <strong>the</strong> status <strong>of</strong> food<br />
and nutriti<strong>on</strong> <strong>in</strong>security <strong>in</strong> <strong>the</strong> major <strong>State</strong>s over<br />
<strong>the</strong> period 1998-2000 to 2004-2006, <strong>the</strong> discussi<strong>on</strong><br />
turned to <strong>the</strong> flagship food security programme <strong>of</strong><br />
<strong>the</strong> country – <strong>the</strong> public distributi<strong>on</strong> system – as it<br />
has evolved over <strong>the</strong> decades, focus<strong>in</strong>g especially<br />
<strong>on</strong> <strong>the</strong> period <strong>of</strong> ec<strong>on</strong>omic reforms under way<br />
s<strong>in</strong>ce 1991. The salient po<strong>in</strong>ts that emerged were:<br />
First, it was found – a po<strong>in</strong>t also noted <strong>in</strong> <strong>the</strong> earlier<br />
<str<strong>on</strong>g>Report</str<strong>on</strong>g> <strong>on</strong> <strong>the</strong> <strong>State</strong> <strong>of</strong> <strong>Food</strong> <strong>Insecurity</strong> <strong>in</strong> Rural<br />
<strong>India</strong> (RSFIRI) – that PDS had served <strong>the</strong> country<br />
well as it expanded from a few urban centres <strong>in</strong><br />
<strong>the</strong> early 1950s to more or less <strong>the</strong> whole country<br />
by <strong>the</strong> early 1980s. There were no doubt several<br />
operati<strong>on</strong>al problems <strong>in</strong>clud<strong>in</strong>g <strong>in</strong>efficiencies and<br />
leakages, but few would deny that PDS had played<br />
a crucial role <strong>in</strong> ensur<strong>in</strong>g access to foodgra<strong>in</strong>s for a<br />
significant proporti<strong>on</strong> <strong>of</strong> <strong>the</strong> populati<strong>on</strong> that would<br />
o<strong>the</strong>rwise have g<strong>on</strong>e hungry. This role <strong>of</strong> PDS<br />
was closely l<strong>in</strong>ked to <strong>the</strong> strategy for agricultural<br />
development evolved <strong>in</strong> <strong>the</strong> mid 1960s and to <strong>the</strong><br />
lead<strong>in</strong>g role <strong>of</strong> <strong>the</strong> government <strong>in</strong> <strong>India</strong>’s growth<br />
and development. Sec<strong>on</strong>d, as <strong>the</strong> country embarked<br />
<strong>on</strong> a structural adjustment programme <strong>in</strong> 1991, <strong>the</strong><br />
policy thrust <strong>on</strong> reducti<strong>on</strong> <strong>of</strong> budgetary deficits<br />
primarily through expenditure reducti<strong>on</strong> meant<br />
curtail<strong>in</strong>g <strong>of</strong> subsidies and a sharp rise <strong>in</strong> <strong>the</strong> issue<br />
prices <strong>of</strong> foodgra<strong>in</strong>s through PDS. Subsequently,<br />
<strong>the</strong> policy framework, which saw a reducti<strong>on</strong> <strong>in</strong><br />
food subsidy as a n<strong>on</strong>-negotiable policy imperative,<br />
led to <strong>the</strong> <strong>in</strong>troducti<strong>on</strong> <strong>of</strong> <strong>the</strong> targeted PDS <strong>in</strong><br />
1997. Exam<strong>in</strong><strong>in</strong>g <strong>the</strong> c<strong>on</strong>sequences <strong>of</strong> TPDS for<br />
both food security and <strong>the</strong> viability <strong>of</strong> PDS itself<br />
<strong>on</strong> <strong>the</strong> basis <strong>of</strong> available data and research studies,<br />
<strong>the</strong> c<strong>on</strong>clusi<strong>on</strong> <strong>in</strong> RSFIRI was that PDS could<br />
be improved and made more effective through<br />
certa<strong>in</strong> policy <strong>in</strong>terventi<strong>on</strong>s and reform. It had<br />
also been ma<strong>in</strong>ta<strong>in</strong>ed that if PDS is to address <strong>the</strong><br />
issue <strong>of</strong> food security at <strong>the</strong> household level, <strong>the</strong><br />
rati<strong>on</strong> must be <strong>on</strong> a per capita basis and not <strong>on</strong> a<br />
per household basis. Third, <strong>the</strong> need for effective<br />
dissem<strong>in</strong>ati<strong>on</strong> <strong>of</strong> all <strong>in</strong>formati<strong>on</strong> <strong>in</strong>clud<strong>in</strong>g various<br />
entitlements perta<strong>in</strong><strong>in</strong>g to <strong>the</strong> PDS to <strong>the</strong> users<br />
had been emphasised. Fourth, it had been argued<br />
that elected local bodies must be actively <strong>in</strong>volved<br />
<strong>in</strong> m<strong>on</strong>itor<strong>in</strong>g PDS and that <strong>the</strong> marg<strong>in</strong> to <strong>the</strong><br />
owner <strong>of</strong> <strong>the</strong> fair price shop has to be revised<br />
appropriately to ensure <strong>the</strong> viability <strong>of</strong> <strong>the</strong> rati<strong>on</strong><br />
shop. Given that, under normal circumstances, <strong>the</strong><br />
food subsidy has been around or less than 1 per
cent <strong>of</strong> GDP, and given <strong>the</strong> importance <strong>of</strong> food and<br />
nutriti<strong>on</strong> security from both <strong>the</strong> rights perspective<br />
and a human development viewpo<strong>in</strong>t, it needs to<br />
be reiterated that, as <strong>the</strong> c<strong>on</strong>clusi<strong>on</strong> <strong>in</strong> RSFIRI<br />
po<strong>in</strong>ted out, <strong>the</strong> case for universal PDS with a<br />
uniform, affordable price – which would also<br />
restore <strong>the</strong> market stabilis<strong>in</strong>g functi<strong>on</strong> <strong>of</strong> PDS – is<br />
<strong>in</strong>deed compell<strong>in</strong>g.<br />
Follow<strong>in</strong>g <strong>the</strong> discussi<strong>on</strong> <strong>of</strong> PDS, this <str<strong>on</strong>g>Report</str<strong>on</strong>g><br />
went <strong>on</strong> to briefly exam<strong>in</strong>e two o<strong>the</strong>r important<br />
<strong>in</strong>terventi<strong>on</strong>s <strong>of</strong> <strong>the</strong> <strong>State</strong> <strong>in</strong> <strong>the</strong> arena <strong>of</strong> food and<br />
nutriti<strong>on</strong> security, namely, <strong>the</strong> <strong>in</strong>tegrated child<br />
development services (ICDS) scheme and <strong>the</strong><br />
mid-day meal scheme (MDMS). Thanks both to<br />
judicial <strong>in</strong>terventi<strong>on</strong> <strong>in</strong> <strong>the</strong> form <strong>of</strong> a series <strong>of</strong> pathbreak<strong>in</strong>g<br />
<strong>in</strong>terim orders by <strong>the</strong> Supreme Court <strong>of</strong><br />
<strong>India</strong>, follow<strong>in</strong>g <strong>the</strong> susta<strong>in</strong>ed work put <strong>in</strong> by <strong>the</strong><br />
right to food movement and a number <strong>of</strong> activist<br />
organisati<strong>on</strong>s and <strong>in</strong>dividuals, and to <strong>the</strong> outcome<br />
<strong>of</strong> <strong>the</strong> parliamentary electi<strong>on</strong>s <strong>of</strong> 2004 which led to<br />
<strong>the</strong> formulati<strong>on</strong> <strong>of</strong> a Nati<strong>on</strong>al Comm<strong>on</strong> M<strong>in</strong>imum<br />
Programme (NCMP) by <strong>the</strong> Government <strong>of</strong><br />
<strong>India</strong> <strong>on</strong> <strong>the</strong> basis <strong>of</strong> an understand<strong>in</strong>g arrived<br />
at between <strong>the</strong> rul<strong>in</strong>g coaliti<strong>on</strong> and <strong>the</strong> Left<br />
Parties support<strong>in</strong>g it from outside, <strong>the</strong> MDMS<br />
and <strong>the</strong> ICDS programmes have moved forward<br />
<strong>in</strong> important ways. The largest ga<strong>in</strong>s <strong>in</strong> terms <strong>of</strong><br />
food security have come from MDMS. Though<br />
<strong>the</strong> Government <strong>of</strong> <strong>India</strong> announced <strong>the</strong> launch<br />
<strong>of</strong> a Nati<strong>on</strong>al Programme <strong>of</strong> Nutriti<strong>on</strong>al Support<br />
to Primary Educati<strong>on</strong> (NPNSPE) <strong>in</strong> 1995, it was<br />
<strong>on</strong>ly subsequent to <strong>the</strong> <strong>in</strong>terventi<strong>on</strong> <strong>of</strong> <strong>the</strong> Supreme<br />
Court <strong>in</strong> 2001 that th<strong>in</strong>gs moved forward. S<strong>in</strong>ce<br />
<strong>the</strong>n, MDMS has become nearly universal, with<br />
hot cooked meals be<strong>in</strong>g served to milli<strong>on</strong>s <strong>of</strong><br />
primary school children across <strong>the</strong> country. The<br />
guidel<strong>in</strong>es <strong>of</strong> <strong>the</strong> Scheme have also been revised<br />
twice – <strong>in</strong> 2004 and 2006 – <strong>in</strong> ways that streng<strong>the</strong>n<br />
<strong>the</strong> programme and its impact <strong>on</strong> <strong>the</strong> food security<br />
<strong>of</strong> children <strong>in</strong> government and governmentaided<br />
primary schools. Two work<strong>in</strong>g groups <strong>of</strong><br />
<strong>the</strong> Plann<strong>in</strong>g Commissi<strong>on</strong> have proposed fur<strong>the</strong>r<br />
CONCLUSIONS AND POLICY RECOMMENDATIONS 117<br />
streng<strong>the</strong>n<strong>in</strong>g <strong>of</strong> MDMS, through suitable revisi<strong>on</strong><br />
<strong>of</strong> f<strong>in</strong>ancial norms and extensi<strong>on</strong>, to cover children<br />
up to Class VIII. This <str<strong>on</strong>g>Report</str<strong>on</strong>g> has g<strong>on</strong>e <strong>in</strong>to <strong>the</strong><br />
functi<strong>on</strong><strong>in</strong>g <strong>of</strong> MDMS <strong>in</strong> Chapter 4, c<strong>on</strong>clud<strong>in</strong>g that<br />
<strong>the</strong> scheme has made a progressive impact, but that<br />
m<strong>on</strong>itor<strong>in</strong>g mechanisms need to be streng<strong>the</strong>ned<br />
and <strong>the</strong>ir feedback acted up<strong>on</strong> promptly.<br />
The picture <strong>in</strong> respect <strong>of</strong> ICDS is ra<strong>the</strong>r<br />
mixed. While Court orders with regard to ICDS<br />
have been str<strong>on</strong>gly <strong>in</strong> favour <strong>of</strong> its universalisati<strong>on</strong><br />
to cover every habitati<strong>on</strong> and hamlet, <strong>the</strong> resp<strong>on</strong>se<br />
<strong>of</strong> <strong>the</strong> Government <strong>of</strong> <strong>India</strong> has been ra<strong>the</strong>r<br />
lukewarm. Though <strong>the</strong>re has been a substantial<br />
<strong>in</strong>crease <strong>in</strong> <strong>the</strong> number <strong>of</strong> ICDS centres, f<strong>in</strong>ancial<br />
allocati<strong>on</strong>s to ICDS, however, have fallen far short<br />
<strong>of</strong> <strong>the</strong> requirements for even runn<strong>in</strong>g <strong>the</strong> exist<strong>in</strong>g<br />
centres properly, let al<strong>on</strong>e meet <strong>the</strong> requirements<br />
<strong>of</strong> universalisati<strong>on</strong>. The problems <strong>of</strong> quality –<br />
address<strong>in</strong>g some <strong>of</strong> which require substantial<br />
modificati<strong>on</strong>s <strong>in</strong> <strong>the</strong> design <strong>of</strong> <strong>the</strong> scheme itself –<br />
and <strong>of</strong> social exclusi<strong>on</strong> rema<strong>in</strong> a major challenge,<br />
as does universalisati<strong>on</strong>. Unfortunately, <strong>in</strong>adequate<br />
allocati<strong>on</strong>s <strong>in</strong> recent budgets for ICDS warrant<br />
<strong>the</strong> comment that this seems to be <strong>in</strong>c<strong>on</strong>sistent<br />
with <strong>the</strong> government’s stated <strong>in</strong>tenti<strong>on</strong> to enact<br />
legislati<strong>on</strong> ensur<strong>in</strong>g food security for all. ICDS<br />
and PDS are two areas where a policy framework<br />
with <strong>in</strong>sistence <strong>on</strong> deficit reducti<strong>on</strong> almost solely<br />
through expenditure reducti<strong>on</strong> would not help<br />
<strong>in</strong> enhanc<strong>in</strong>g food and nutriti<strong>on</strong> security. This is<br />
especially relevant <strong>in</strong> a c<strong>on</strong>text where large tax<br />
c<strong>on</strong>cessi<strong>on</strong>s have been extended to <strong>the</strong> corporate<br />
sector as part <strong>of</strong> a fiscal stimulus to deal with <strong>the</strong><br />
impact <strong>of</strong> <strong>the</strong> global recessi<strong>on</strong>.<br />
Even though universalis<strong>in</strong>g PDS will<br />
<strong>in</strong>volve a higher quantum <strong>of</strong> food subsidy, given<br />
<strong>the</strong> harden<strong>in</strong>g <strong>of</strong> wheat and rice prices <strong>in</strong> <strong>the</strong><br />
world market and <strong>the</strong> higher procurement prices<br />
that would have to be provided to <strong>India</strong>n farmers,<br />
its beneficial c<strong>on</strong>sequences <strong>in</strong> address<strong>in</strong>g our<br />
ra<strong>the</strong>r poor record <strong>in</strong> terms <strong>of</strong> food and nutriti<strong>on</strong>
118 REPORT ON THE STATE OF FOOD INSECURITY IN URBAN INDIA<br />
security far outweigh <strong>the</strong>se costs. Such<br />
universalisati<strong>on</strong> should, <strong>of</strong> course, go hand <strong>in</strong> hand<br />
with measures to improve <strong>the</strong> functi<strong>on</strong><strong>in</strong>g <strong>of</strong> PDS.<br />
The exercise cited <strong>in</strong> Box 2 shows that <strong>the</strong> fiscal<br />
burden <strong>of</strong> universal PDS to provide 35 kg per<br />
m<strong>on</strong>th to all households at two rupees a kg may<br />
not be prohibitive.<br />
Universalis<strong>in</strong>g PDS & <strong>Food</strong> Security Bill<br />
5.2 Policy Recommendati<strong>on</strong>s<br />
1. Detailed recommendati<strong>on</strong>s have been made<br />
<strong>in</strong> <strong>the</strong> <str<strong>on</strong>g>Report</str<strong>on</strong>g> <strong>on</strong> <strong>the</strong> <strong>State</strong> <strong>of</strong> <strong>Food</strong> <strong>Insecurity</strong><br />
<strong>in</strong> Rural <strong>India</strong> (RSFIRI) (MSSRF-WFP<br />
2008) c<strong>on</strong>cern<strong>in</strong>g policies to promote food<br />
and nutriti<strong>on</strong> security for all. Many <strong>of</strong> those<br />
Box 2 Universalis<strong>in</strong>g PDS: How much does it cost anyway?<br />
Praveen Jha & Nilachala Acharya<br />
In this c<strong>on</strong>text, <strong>the</strong> proposal to universalise <strong>the</strong> PDS <strong>in</strong> <strong>the</strong> country calls for cost estimati<strong>on</strong>s<br />
go<strong>in</strong>g bey<strong>on</strong>d <strong>the</strong> exist<strong>in</strong>g practice <strong>of</strong> food subsidy <strong>in</strong> <strong>the</strong> budgets. The budgetary provisi<strong>on</strong>s towards<br />
food subsidy dur<strong>in</strong>g <strong>the</strong> fiscal year 2009-10 were less than <strong>on</strong>e per cent <strong>of</strong> <strong>the</strong> country’s GDP. This<br />
is clearly less than <strong>the</strong> amount needed to ensure food for all.<br />
Proposal<br />
To ensure food for all, an additi<strong>on</strong>al Rs.94,419 crore may be required to supplement <strong>the</strong> present<br />
provisi<strong>on</strong>s <strong>of</strong> food subsidy <strong>in</strong> <strong>the</strong> country. This cost estimati<strong>on</strong> <strong>of</strong> <strong>the</strong> proposed universalisati<strong>on</strong> <strong>of</strong><br />
PDS is based <strong>on</strong> <strong>the</strong> follow<strong>in</strong>g assumpti<strong>on</strong>s:<br />
• Total number <strong>of</strong> households <strong>in</strong> <strong>the</strong> country at present is 23.96 crore (approx 24 crore)<br />
based <strong>on</strong> <strong>the</strong> assumpti<strong>on</strong> that <strong>the</strong> size <strong>of</strong> household is 4.8 (as reported <strong>in</strong> NFHS-3) and <strong>the</strong><br />
projected populati<strong>on</strong> <strong>of</strong> <strong>the</strong> country at present is 115 crore.<br />
• Extend<strong>in</strong>g <strong>the</strong> provisi<strong>on</strong> <strong>of</strong> PDS to all <strong>the</strong> households <strong>in</strong> <strong>the</strong> country would demand<br />
subsidised foodgra<strong>in</strong>s at 35 kg per m<strong>on</strong>th per household at <strong>the</strong> central issue price (CIP) <strong>of</strong><br />
Rs.2 per kg.<br />
• The m<strong>in</strong>imum support price (MSP) as well as ec<strong>on</strong>omic costs <strong>of</strong> wheat and rice will not<br />
<strong>in</strong>crease from what it is at present, i.e., Rs.1,789.8 for per qu<strong>in</strong>tal <strong>of</strong> rice and Rs.1,392.7<br />
for per qu<strong>in</strong>tal <strong>of</strong> wheat.<br />
• The distributi<strong>on</strong> <strong>of</strong> rice and wheat will be <strong>in</strong> <strong>the</strong> ratio <strong>of</strong> 2:1.<br />
Based <strong>on</strong> <strong>the</strong> above assumpti<strong>on</strong>s, <strong>the</strong> total amount <strong>of</strong> foodgra<strong>in</strong>s needed for distributi<strong>on</strong><br />
through PDS would be around 1008 lakh t<strong>on</strong>nes. Out <strong>of</strong> this, <strong>the</strong> amount <strong>of</strong> rice and wheat needed<br />
for distributi<strong>on</strong> would be around 672 lakh t<strong>on</strong>nes and 336 lakh t<strong>on</strong>nes respectively. As a whole, <strong>the</strong><br />
total amount as food subsidy per annum would be Rs.1,46,909 crore. At present, <strong>the</strong> provisi<strong>on</strong> <strong>of</strong><br />
food subsidy accounts for Rs.52,490 crore as per <strong>the</strong> budget estimate <strong>of</strong> 2009-10. Therefore <strong>in</strong> <strong>the</strong><br />
com<strong>in</strong>g budgets <strong>the</strong> government will have to make provisi<strong>on</strong>s for an additi<strong>on</strong>al amount <strong>of</strong> Rs.94,419<br />
crore.<br />
C<strong>on</strong>td…
CONCLUSIONS AND POLICY RECOMMENDATIONS 119<br />
Required Amount <strong>of</strong> <strong>Food</strong> Gra<strong>in</strong>s and <strong>Food</strong> Subsidy (Per Annum):<br />
A Total amount <strong>of</strong> foodgra<strong>in</strong>s (rice/wheat) to be distributed (per annum)<br />
at 35 kg per m<strong>on</strong>th per household<br />
B Proposed CIP for foodgra<strong>in</strong>s per t<strong>on</strong>ne (Rs.2 per kg × 1000 kg) Rs.2000<br />
1008 lakh t<strong>on</strong>nes<br />
i Total amount <strong>of</strong> rice need to be distributed (per annum) 672 lakh t<strong>on</strong>nes<br />
ii Total amount <strong>of</strong> wheat need to be distributed (per annum) 336 lakh t<strong>on</strong>nes<br />
C Total amount which would be recovered through CIP<br />
(Rs.2000 × 1008 lakh t<strong>on</strong>nes)<br />
Rs.20160 crore<br />
D Ec<strong>on</strong>omic costs per t<strong>on</strong>ne <strong>of</strong> rice (Rs.1789.8 × 10) W Rs.17898<br />
a Total ec<strong>on</strong>omic costs for <strong>the</strong> distributi<strong>on</strong> <strong>of</strong> proposed amount <strong>of</strong> rice Rs.120275 crore<br />
E Ec<strong>on</strong>omic costs per t<strong>on</strong>ne <strong>of</strong> wheat (Rs.1392.7 × 10) Rs.13927<br />
b Total ec<strong>on</strong>omic costs for <strong>the</strong> distributi<strong>on</strong> <strong>of</strong> proposed amount <strong>of</strong> wheat Rs.46795 crore<br />
F Total ec<strong>on</strong>omic cost for <strong>the</strong> distributi<strong>on</strong> <strong>of</strong> food gra<strong>in</strong><br />
(rice/wheat) (F=a+b)<br />
Rs.167069 crore<br />
G Amount <strong>of</strong> food subsidy required per annum (F-C) Rs.146909 crore<br />
H Present budgetary provisi<strong>on</strong> as food subsidy Rs.52490 crore<br />
I <strong>Food</strong> subsidy required for <strong>the</strong> com<strong>in</strong>g budgets over and<br />
above <strong>the</strong> exist<strong>in</strong>g provisi<strong>on</strong> (I=G-H)<br />
Rs.94419 crore<br />
Source: <strong>India</strong> Current Affairs, 20 November 2009<br />
http://<strong>in</strong>diacurrentaffairs.org/universalis<strong>in</strong>g-pds-how-much-does-it-cost-anyway-praveen-jha-nilachala-acharya/<br />
recommendati<strong>on</strong>s are not specific to rural<br />
<strong>India</strong>, and are applicable to urban areas as well.<br />
Annexure 1 presents <strong>the</strong> recommendati<strong>on</strong>s<br />
set forth <strong>in</strong> RSFIRI. In <strong>the</strong> present <str<strong>on</strong>g>Report</str<strong>on</strong>g>,<br />
<strong>the</strong>ir relevance to urban food security as<br />
well is str<strong>on</strong>gly reiterated. This is especially<br />
true for all proposals perta<strong>in</strong><strong>in</strong>g to <strong>in</strong>creas<strong>in</strong>g<br />
food availability. The <strong>on</strong>ly additi<strong>on</strong>al<br />
recommendati<strong>on</strong> <strong>in</strong> <strong>the</strong> c<strong>on</strong>text <strong>of</strong> urban <strong>India</strong><br />
is that <strong>the</strong> potentialities <strong>of</strong> urban agriculture<br />
should be seriously explored.<br />
2. As already noted, access and absorpti<strong>on</strong> are <strong>the</strong><br />
ma<strong>in</strong> issues <strong>in</strong> urban food security. In respect<br />
<strong>of</strong> access, <strong>the</strong> key is <strong>the</strong> quality and quantity<br />
<strong>of</strong> employment. <strong>Urban</strong> asset distributi<strong>on</strong> is,<br />
<strong>of</strong> course, quite skewed, with large <strong>in</strong>dustrial<br />
and service sector establishments be<strong>in</strong>g an<br />
important feature <strong>of</strong> <strong>the</strong> urban landscape. The<br />
central issue is <strong>the</strong>refore <strong>of</strong> enabl<strong>in</strong>g expansi<strong>on</strong><br />
<strong>of</strong> productive and remunerative employment.<br />
This will <strong>in</strong>volve special assistance to <strong>the</strong><br />
numerous small and t<strong>in</strong>y enterprises <strong>in</strong> <strong>the</strong><br />
urban ec<strong>on</strong>omy. The recommendati<strong>on</strong>s<br />
<strong>of</strong> NCEUS <strong>in</strong> this regard – from credit to<br />
market<strong>in</strong>g support to <strong>in</strong>frastructure provisi<strong>on</strong><br />
– are em<strong>in</strong>ently reas<strong>on</strong>able.
120 REPORT ON THE STATE OF FOOD INSECURITY IN URBAN INDIA<br />
3. The NCEUS recommendati<strong>on</strong>s <strong>on</strong> social<br />
security, provisi<strong>on</strong> <strong>of</strong> remunerative<br />
employment, skill development and support<br />
<strong>in</strong> various ways to small and t<strong>in</strong>y enterprises<br />
should be implemented quickly. It is<br />
<strong>in</strong>deed a matter <strong>of</strong> c<strong>on</strong>cern that many <strong>of</strong> <strong>the</strong><br />
recommendati<strong>on</strong>s <strong>of</strong> NCEUS <strong>in</strong> this regard are<br />
yet to be acted up<strong>on</strong>. While support to t<strong>in</strong>y and<br />
small enterprises is necessary to help enhance<br />
<strong>the</strong> <strong>in</strong>comes <strong>of</strong> <strong>the</strong> self-employed and <strong>the</strong>reby<br />
<strong>the</strong>ir access to food, it is equally important<br />
to enhance both <strong>the</strong> quantity and quality <strong>of</strong><br />
wage-paid employment. As NCEUS po<strong>in</strong>ts<br />
out, much <strong>of</strong> <strong>the</strong> rhetoric demand<strong>in</strong>g “labour<br />
flexibility” is <strong>in</strong> <strong>the</strong> nature <strong>of</strong> a red herr<strong>in</strong>g,<br />
and <strong>the</strong> real need is to ensure that <strong>the</strong> workers<br />
<strong>in</strong> <strong>the</strong> unorganised sector and those <strong>in</strong> <strong>in</strong>formal<br />
employment <strong>in</strong> <strong>the</strong> formal sector are provided<br />
decent wages and work<strong>in</strong>g c<strong>on</strong>diti<strong>on</strong>s as well<br />
as a modicum <strong>of</strong> social security.<br />
4. Skill development, both for <strong>the</strong> self-employed<br />
and those seek<strong>in</strong>g, or already, <strong>in</strong> wage<br />
employment, is an important <strong>in</strong>put to improve<br />
<strong>the</strong> quality <strong>of</strong> employment as well as enhance<br />
<strong>the</strong> probability <strong>of</strong> f<strong>in</strong>d<strong>in</strong>g employment.<br />
Aga<strong>in</strong>, <strong>the</strong> NCEUS recommendati<strong>on</strong>s <strong>in</strong> this<br />
regard need to be supported. Any effort <strong>in</strong><br />
this directi<strong>on</strong> has necessarily to be <strong>on</strong> a very<br />
large scale and appropriately decentralised for<br />
effective implementati<strong>on</strong>.<br />
5. Most importantly, al<strong>on</strong>g <strong>the</strong> l<strong>in</strong>es <strong>of</strong> <strong>the</strong><br />
Nati<strong>on</strong>al Rural Employment Guarantee Act,<br />
an <strong>Urban</strong> Employment Guarantee Act should<br />
be urgently enacted. This can be <strong>in</strong>tegrated <strong>in</strong><br />
a synergistic manner with <strong>the</strong> need to improve<br />
urban amenities, especially <strong>in</strong> <strong>the</strong> small and<br />
medium towns. The experience obta<strong>in</strong>ed<br />
from <strong>the</strong> implementati<strong>on</strong> <strong>of</strong> NREGA so far<br />
can be utilised <strong>in</strong> <strong>the</strong> appropriate design <strong>of</strong><br />
an urban employment guarantee scheme. It is<br />
noteworthy that Tripura has already formulated<br />
a scheme <strong>in</strong> this regard and similar <strong>in</strong>itiatives<br />
have s<strong>in</strong>ce been taken by <strong>the</strong> Governments <strong>of</strong><br />
Kerala and West Bengal <strong>in</strong> <strong>the</strong>ir budgets for<br />
<strong>2010</strong>-11.<br />
6. Absorpti<strong>on</strong> is <strong>the</strong> o<strong>the</strong>r key issue <strong>in</strong> urban<br />
food security. In essence, improv<strong>in</strong>g absorpti<strong>on</strong><br />
requires easy and guaranteed access to safe<br />
dr<strong>in</strong>k<strong>in</strong>g water <strong>in</strong> adequate quantities and as<br />
and when needed; toilet facilities, ideally<br />
<strong>in</strong>side <strong>on</strong>e’s own premises, and if not, at a<br />
locati<strong>on</strong> sufficiently close to residence, with<br />
adequate water and appropriate arrangements<br />
for ma<strong>in</strong>tenance and upkeep; hygienic<br />
sanitati<strong>on</strong> and dra<strong>in</strong>age facilities for all<br />
urban areas <strong>in</strong>clud<strong>in</strong>g slums; and nutriti<strong>on</strong><br />
educati<strong>on</strong>, cover<strong>in</strong>g both undernutriti<strong>on</strong> and<br />
‘overnutriti<strong>on</strong>’. Adequate <strong>in</strong>vestments have to<br />
be made <strong>in</strong> this regard. Special attenti<strong>on</strong> has<br />
to be paid to small and medium towns which<br />
happen to be most poorly provided for <strong>in</strong> this<br />
respect so far. While <strong>the</strong> fund<strong>in</strong>g has to come<br />
from higher levels <strong>of</strong> government, design and<br />
implementati<strong>on</strong> have to be decentralised and<br />
vested with elected local bodies.<br />
7. “Overnutriti<strong>on</strong>” is an emerg<strong>in</strong>g problem<br />
<strong>in</strong> urban <strong>India</strong>. However, it cannot be a<br />
policy priority given <strong>the</strong> huge challenge <strong>of</strong><br />
undernutriti<strong>on</strong> which must be addressed<br />
with <strong>the</strong> greatest urgency. N<strong>on</strong>e<strong>the</strong>less, a<br />
beg<strong>in</strong>n<strong>in</strong>g can be made to address overnutriti<strong>on</strong><br />
through appropriate nutriti<strong>on</strong> educati<strong>on</strong><br />
<strong>in</strong>itiatives.<br />
8. <strong>Urban</strong> health facilities are important to<br />
m<strong>in</strong>imis<strong>in</strong>g urban morbidity and <strong>the</strong>reby<br />
improv<strong>in</strong>g <strong>the</strong> absorpti<strong>on</strong> dimensi<strong>on</strong> <strong>of</strong><br />
food security. Currently, municipalities<br />
with populati<strong>on</strong> levels below 100,000 are<br />
very poorly served by <strong>the</strong> public health care<br />
system. The town panchayats come under <strong>the</strong>
service area <strong>of</strong> primary health centres and <strong>the</strong><br />
health subcentres under <strong>the</strong>m. Municipalities<br />
(<strong>in</strong>clud<strong>in</strong>g corporati<strong>on</strong>s) with populati<strong>on</strong><br />
exceed<strong>in</strong>g 100,000 are covered under nati<strong>on</strong>al<br />
programmes like <strong>the</strong> <strong>India</strong> Populati<strong>on</strong> Project<br />
and its successors. So, <strong>the</strong>re is need for a special<br />
focus <strong>on</strong> <strong>the</strong> smaller towns and municipalities<br />
<strong>in</strong> <strong>the</strong> Nati<strong>on</strong>al <strong>Urban</strong> Health Missi<strong>on</strong>.<br />
9. There are some general po<strong>in</strong>ts to be kept <strong>in</strong><br />
m<strong>in</strong>d. JNNURM and o<strong>the</strong>r urban development/<br />
urban poverty alleviati<strong>on</strong> programmes tend to<br />
emphasise <strong>the</strong> urban unit as a whole, which<br />
de facto means privileg<strong>in</strong>g <strong>the</strong> more affluent<br />
secti<strong>on</strong>s <strong>of</strong> <strong>the</strong> urban populati<strong>on</strong>. It is important<br />
to focus urban <strong>in</strong>terventi<strong>on</strong>s <strong>in</strong> JNNURM and<br />
o<strong>the</strong>r programmes <strong>on</strong> <strong>the</strong> needs <strong>of</strong> small and<br />
medium towns and <strong>on</strong> <strong>the</strong> needs <strong>of</strong> urban<br />
slums <strong>in</strong> all cities, tak<strong>in</strong>g care to address <strong>the</strong><br />
needs <strong>of</strong> <strong>the</strong> poor with regard to shelter, water,<br />
sanitati<strong>on</strong>, dra<strong>in</strong>age and nutriti<strong>on</strong> educati<strong>on</strong>. It<br />
is also important to ensure that PDS, ICDS and<br />
MDMS reach <strong>the</strong> poor effectively. There are<br />
serious pitfalls <strong>in</strong> this regard that arise from an<br />
obsessi<strong>on</strong> with <strong>the</strong> model <strong>of</strong> so-called ‘public<br />
private participati<strong>on</strong>’ or PPP. Clearly, PPP<br />
with a pr<strong>of</strong>it-driven private party will not by<br />
itself ensure <strong>in</strong>clusi<strong>on</strong> <strong>of</strong> <strong>the</strong> urban poor or<br />
slum dwellers as beneficiaries <strong>of</strong> such<br />
<strong>in</strong>itiatives. It is a matter <strong>of</strong> political will<br />
that adequate resources be found through<br />
<strong>the</strong> regular fiscal mechanisms to undertake<br />
<strong>the</strong> necessary <strong>in</strong>frastructure <strong>in</strong>vestments <strong>in</strong><br />
urban areas that address <strong>the</strong> basic needs <strong>of</strong><br />
safe dr<strong>in</strong>k<strong>in</strong>g water, sanitati<strong>on</strong> and hygiene,<br />
ra<strong>the</strong>r than <strong>of</strong>fload it to <strong>the</strong> PPP mode, cit<strong>in</strong>g<br />
resource c<strong>on</strong>stra<strong>in</strong>ts. As <strong>the</strong> highest Court<br />
<strong>of</strong> <strong>the</strong> land has po<strong>in</strong>ted out, Article 21 <strong>of</strong> <strong>the</strong><br />
<strong>India</strong>n C<strong>on</strong>stituti<strong>on</strong> guarantees <strong>the</strong> right to life,<br />
and <strong>the</strong> right to life <strong>in</strong>cludes <strong>the</strong> right to food.<br />
This cannot be made negotiable <strong>on</strong> grounds <strong>of</strong><br />
resource c<strong>on</strong>stra<strong>in</strong>ts.<br />
CONCLUSIONS AND POLICY RECOMMENDATIONS 121<br />
10. The elected urban local bodies need to be<br />
<strong>in</strong>vested with both power and resp<strong>on</strong>sibility<br />
for design<strong>in</strong>g and implement<strong>in</strong>g all food<br />
and nutriti<strong>on</strong> programmes, and provided <strong>the</strong><br />
necessary f<strong>in</strong>ancial support by <strong>the</strong> higher<br />
levels <strong>of</strong> government, especially <strong>the</strong> Central<br />
government. To ensure effective devoluti<strong>on</strong>,<br />
<strong>the</strong> capabilities <strong>of</strong> local bodies need to be<br />
streng<strong>the</strong>ned c<strong>on</strong>siderably through appropriate<br />
programmes <strong>of</strong> capacity build<strong>in</strong>g.<br />
11. A Nutriti<strong>on</strong> Literacy Movement should<br />
be launched and home gardens promoted,<br />
wherever this is feasible, based <strong>on</strong> <strong>the</strong> pr<strong>in</strong>ciple<br />
<strong>of</strong> f<strong>in</strong>d<strong>in</strong>g a horticultural remedy for every<br />
nutriti<strong>on</strong>al malady (with particular reference<br />
to micr<strong>on</strong>utrient deficiencies). Government<br />
should provide technical guidance and<br />
necessary support by way <strong>of</strong> seeds and<br />
plant<strong>in</strong>g material. Mor<strong>in</strong>ga can be planted <strong>in</strong><br />
every home garden <strong>in</strong> urban areas.<br />
12. Based <strong>on</strong> <strong>the</strong> recent experience with food<br />
<strong>in</strong>flati<strong>on</strong>, it will be desirable to promote<br />
c<strong>on</strong>sumer cooperatives <strong>in</strong> urban areas to<br />
m<strong>in</strong>imise <strong>the</strong> very wide gap between wholesale<br />
and retail prices. C<strong>on</strong>sumer cooperatives can<br />
be a supplement to fair price shops.<br />
13. The m<strong>in</strong>imum support price announced for<br />
a number <strong>of</strong> crops is be<strong>in</strong>g implemented <strong>on</strong>ly<br />
<strong>in</strong> <strong>the</strong> case <strong>of</strong> wheat and rice. It is necessary to<br />
broaden <strong>the</strong> food basket by <strong>in</strong>clud<strong>in</strong>g nutritious<br />
millets, legumes and tubers. Provid<strong>in</strong>g <strong>the</strong>se<br />
crops appropriate remunerative prices will help<br />
expand <strong>the</strong>ir producti<strong>on</strong>. PDS can cover o<strong>the</strong>r<br />
nutritious foods, <strong>in</strong> additi<strong>on</strong> to basic staples.<br />
14. There is need to streng<strong>the</strong>n envir<strong>on</strong>mental<br />
hygiene, sanitati<strong>on</strong> and toilets. Elected<br />
urban local bodies could be encouraged to<br />
<strong>in</strong>volve local communities <strong>in</strong> promot<strong>in</strong>g<br />
hygiene and sanitati<strong>on</strong>, with <strong>the</strong> voluntary<br />
support <strong>of</strong> <strong>the</strong> numerous community
122 REPORT ON THE STATE OF FOOD INSECURITY IN URBAN INDIA<br />
organisati<strong>on</strong>s work<strong>in</strong>g <strong>on</strong> <strong>the</strong>se issues.<br />
Educati<strong>on</strong>, social mobilisati<strong>on</strong> and regulati<strong>on</strong><br />
will all be needed.<br />
15. The need to l<strong>in</strong>k nutriti<strong>on</strong> with disease<br />
management is particularly important <strong>in</strong> cases<br />
like tuberculosis, HIV/AIDS, leprosy, etc.,<br />
where a drug-based approach al<strong>on</strong>e will not<br />
help to cure <strong>the</strong> patient. A food-cum-drug<br />
based method will be important.<br />
16. F<strong>in</strong>ally, urban food security is not a matter<br />
<strong>of</strong> urban policy al<strong>on</strong>e. It is bound up with<br />
<strong>the</strong> urban ec<strong>on</strong>omic structure characterised<br />
by a high degree <strong>of</strong> <strong>in</strong>equality and also with<br />
<strong>the</strong> impact <strong>of</strong> macroec<strong>on</strong>omic policies that<br />
imp<strong>in</strong>ge <strong>on</strong> urban areas, especially through<br />
large populati<strong>on</strong> movements caused by ei<strong>the</strong>r<br />
rural or urban ec<strong>on</strong>omic changes. For <strong>in</strong>stance,<br />
a major issue <strong>in</strong> urban food security is that <strong>of</strong><br />
<strong>the</strong> basic entitlements <strong>of</strong> migrants. This has<br />
rema<strong>in</strong>ed almost completely unaddressed<br />
<strong>in</strong> policy. This <str<strong>on</strong>g>Report</str<strong>on</strong>g> has also not explored<br />
this aspect <strong>on</strong> account <strong>of</strong> various c<strong>on</strong>stra<strong>in</strong>ts.<br />
But <strong>the</strong> issue <strong>of</strong> migrants and <strong>the</strong>ir food security<br />
is <strong>on</strong>ly <strong>on</strong>e example <strong>of</strong> macroec<strong>on</strong>omic<br />
and social policies imp<strong>in</strong>g<strong>in</strong>g <strong>on</strong> urban<br />
food security. The more general po<strong>in</strong>t to be<br />
emphasised is that urban food security is as<br />
much a matter <strong>of</strong> <strong>the</strong> fiscal policy framework<br />
as it is <strong>of</strong> programme implementati<strong>on</strong> <strong>on</strong> <strong>the</strong><br />
ground. While outcomes are <strong>in</strong>deed important,<br />
a prec<strong>on</strong>diti<strong>on</strong> for achiev<strong>in</strong>g targeted outcomes<br />
is adequate outlays. This is crucially dependent<br />
<strong>on</strong> <strong>the</strong> macroec<strong>on</strong>omic policy framework.<br />
Ec<strong>on</strong>omic reforms, <strong>the</strong>refore, need to be<br />
re-formed if <strong>in</strong>clusive urban development that<br />
addresses <strong>the</strong> needs <strong>of</strong> urban food security for<br />
all is to occur.
ANNEXURE 1<br />
Recommendati<strong>on</strong>s: Towards <strong>Food</strong> and<br />
Nutriti<strong>on</strong> Security for All<br />
(Extracted from MSSRF-WFP. 2008. <str<strong>on</strong>g>Report</str<strong>on</strong>g> <strong>on</strong> <strong>the</strong> <strong>State</strong> <strong>of</strong> <strong>Food</strong> <strong>Insecurity</strong> <strong>in</strong> Rural <strong>India</strong>. 141– 45.)<br />
1. Availability<br />
<strong>of</strong> foodgra<strong>in</strong>s <strong>in</strong> adequate<br />
quantities needs to be ensured, now and<br />
<strong>in</strong> <strong>the</strong> future. Keep<strong>in</strong>g <strong>in</strong> m<strong>in</strong>d <strong>the</strong> need<br />
to ensure livelihoods <strong>in</strong> rural areas, <strong>the</strong><br />
strategy for <strong>in</strong>creas<strong>in</strong>g availability must<br />
place emphasis <strong>on</strong> <strong>in</strong>creas<strong>in</strong>g small farmer<br />
producti<strong>on</strong> and productivity. For this purpose,<br />
public <strong>in</strong>vestment <strong>in</strong> irrigati<strong>on</strong> and rural<br />
<strong>in</strong>frastructure needs to be stepped up and<br />
o<strong>the</strong>r forms <strong>of</strong> <strong>State</strong> support, <strong>in</strong>clud<strong>in</strong>g credit<br />
and post-harvest storage facilities such as<br />
rural warehouses, provided. Such public<br />
<strong>in</strong>vestment should also strive to address <strong>the</strong><br />
issue <strong>of</strong> regi<strong>on</strong>al <strong>in</strong>equalities. With respect<br />
to irrigati<strong>on</strong>, <strong>the</strong>re should be a special focus<br />
<strong>on</strong> revitalisati<strong>on</strong> <strong>of</strong> exist<strong>in</strong>g local water<br />
storage systems and water bodies and <strong>on</strong><br />
decentralised community c<strong>on</strong>trolled systems<br />
<strong>of</strong> water use. NREGS and similar schemes<br />
could be utilised for this purpose. All <strong>the</strong>se<br />
steps will help address availability and access<br />
simultaneously.<br />
2.<br />
With a view to ensur<strong>in</strong>g assured and<br />
remunerative price for produce, <strong>the</strong> government<br />
must expand <strong>the</strong> m<strong>in</strong>imum support price<br />
(MSP) system, based <strong>on</strong> <strong>the</strong> cost <strong>of</strong> producti<strong>on</strong>,<br />
<strong>in</strong>clud<strong>in</strong>g a reas<strong>on</strong>able rate <strong>of</strong> return <strong>on</strong><br />
<strong>in</strong>vestment and ensur<strong>in</strong>g prompt and openended<br />
purchase for all major crops <strong>in</strong>clud<strong>in</strong>g<br />
foodgra<strong>in</strong>s o<strong>the</strong>r than paddy and wheat.<br />
This will serve as an <strong>in</strong>centive to <strong>in</strong>crease<br />
availability and improve access by enhanc<strong>in</strong>g<br />
3.<br />
4.<br />
5.<br />
<strong>the</strong> purchas<strong>in</strong>g power <strong>of</strong> farmers.<br />
Ec<strong>on</strong>omic policies should be reoriented<br />
to provide adequate support for <strong>India</strong>’s<br />
agriculture and its vast rural populati<strong>on</strong>. In<br />
particular, policies must provide adequate<br />
rural <strong>in</strong>frastructure, <strong>in</strong>clud<strong>in</strong>g power, and<br />
promote employment, besides ensur<strong>in</strong>g credit<br />
facilities and remunerative prices for produce<br />
for our farmers. The unf<strong>in</strong>ished agenda <strong>of</strong> land<br />
reforms must be completed and distributi<strong>on</strong><br />
<strong>of</strong> ceil<strong>in</strong>g surplus land must be d<strong>on</strong>e <strong>on</strong> a<br />
priority basis. Appropriate attenti<strong>on</strong> should<br />
be paid to c<strong>on</strong>servati<strong>on</strong> <strong>of</strong> comm<strong>on</strong> property<br />
and biodiversity resources and rehabilitati<strong>on</strong><br />
<strong>of</strong> wastelands. These steps will address<br />
availability, access and susta<strong>in</strong>ability<br />
c<strong>on</strong>cerns.<br />
There should be substantial <strong>in</strong>crease <strong>in</strong> public<br />
<strong>in</strong>vestment <strong>in</strong> agriculture-related <strong>in</strong>frastructure<br />
such as irrigati<strong>on</strong> and dra<strong>in</strong>age, land<br />
development, water c<strong>on</strong>servati<strong>on</strong>, development<br />
<strong>of</strong> road c<strong>on</strong>nectivity, etc. Such <strong>in</strong>vestments are<br />
especially needed <strong>in</strong> <strong>the</strong> poorer and low ra<strong>in</strong>fall<br />
areas <strong>of</strong> <strong>the</strong> country.<br />
The analysis <strong>of</strong> <strong>the</strong> Public Distributi<strong>on</strong> System<br />
and its functi<strong>on</strong><strong>in</strong>g has built a well-argued case<br />
for replacement <strong>of</strong> TPDS by a universal PDS<br />
with uniform prices affordable to <strong>the</strong> poor.<br />
The centralisati<strong>on</strong> that took place under TPDS<br />
should be reversed and <strong>State</strong> governments<br />
should, <strong>in</strong> <strong>the</strong> first <strong>in</strong>stance, have <strong>the</strong> right to
124 REPORT ON THE STATE OF FOOD INSECURITY IN URBAN INDIA<br />
6.<br />
7.<br />
8.<br />
determ<strong>in</strong>e <strong>the</strong> required allocati<strong>on</strong> under PDS<br />
for <strong>the</strong>ir <strong>State</strong>.<br />
Fur<strong>the</strong>r, <strong>the</strong> allocati<strong>on</strong> per household <strong>in</strong> PDS<br />
should be based <strong>on</strong> <strong>the</strong> number <strong>of</strong> c<strong>on</strong>sumpti<strong>on</strong><br />
units <strong>in</strong> <strong>the</strong> household. Besides rice and wheat,<br />
o<strong>the</strong>r relevant and nutritious foodgra<strong>in</strong>s and<br />
pulses may be distributed through PDS at<br />
subsidized rates, <strong>in</strong> order to enhance nutriti<strong>on</strong>al<br />
outcomes. Fur<strong>the</strong>r, <strong>in</strong> order to improve viability<br />
<strong>of</strong> Fair Price Shops (FPS), and simultaneously<br />
enhance <strong>the</strong> purchas<strong>in</strong>g power <strong>of</strong> <strong>the</strong> <strong>in</strong>comes<br />
<strong>of</strong> <strong>the</strong> poor, commodities like edible oil, cloth<br />
and o<strong>the</strong>r daily use items may be sold <strong>in</strong> such<br />
shops. Rati<strong>on</strong> shops should be streng<strong>the</strong>ned<br />
and made viable through <strong>the</strong> provisi<strong>on</strong> <strong>of</strong><br />
appropriate marg<strong>in</strong>s or subsidies. To ensure<br />
effective utilisati<strong>on</strong> <strong>of</strong> PDS, <strong>the</strong> public must<br />
be free to draw <strong>the</strong>ir allocati<strong>on</strong>s <strong>on</strong> a weekly<br />
basis. Migrants should be able to access PDS<br />
allocati<strong>on</strong>s <strong>in</strong> <strong>the</strong> area where <strong>the</strong>y work.<br />
Panchayati Raj Instituti<strong>on</strong>s (PRIs) may also<br />
be actively <strong>in</strong>volved <strong>in</strong> <strong>the</strong> m<strong>on</strong>itor<strong>in</strong>g <strong>of</strong><br />
PDS. PRIs should be empowered, tra<strong>in</strong>ed<br />
and facilitated <strong>in</strong> m<strong>on</strong>itor<strong>in</strong>g hunger and<br />
malnutriti<strong>on</strong> as well as schemes implemented<br />
to reduce hunger/malnutriti<strong>on</strong> such as PDS,<br />
MDMS, ICDS and FFWP. This will help<br />
streng<strong>the</strong>n <strong>the</strong> delivery mechanisms.<br />
While a universal PDS, appropriate<br />
supplementary programmes and o<strong>the</strong>r safety<br />
nets funded by <strong>the</strong> government are critical<br />
to ensur<strong>in</strong>g food security, <strong>the</strong>re is also an<br />
important role for community-based food<br />
security systems, such as community gra<strong>in</strong><br />
banks. Community food security systems<br />
appear especially relevant <strong>in</strong> socially cohesive<br />
communities characterised by limited<br />
<strong>in</strong>equality and <strong>in</strong> locati<strong>on</strong>s which f<strong>in</strong>d it<br />
difficult to access o<strong>the</strong>r delivery mechanisms<br />
such as PDS. Community food security<br />
systems may also be encouraged <strong>in</strong> order that<br />
<strong>the</strong> producti<strong>on</strong> <strong>of</strong> nutritious millets and o<strong>the</strong>r<br />
local foodgra<strong>in</strong>s receive much needed support.<br />
To ensure susta<strong>in</strong>ability, such <strong>in</strong>itiatives must<br />
work closely with elected local bodies.<br />
9.<br />
The overall approach <strong>of</strong> <strong>the</strong> food delivery<br />
system should be lifecycle based and <strong>in</strong>volve<br />
appropriate supplementati<strong>on</strong> programmes<br />
to ensure that all stages <strong>of</strong> <strong>the</strong> lifecycle are<br />
addressed. Horiz<strong>on</strong>tal <strong>in</strong>tegrati<strong>on</strong> <strong>of</strong> vertically<br />
structured programmes is urgently called for.<br />
10. While food and nutriti<strong>on</strong> <strong>in</strong>security need to<br />
be addressed at all stages <strong>of</strong> <strong>the</strong> lifecycle,<br />
certa<strong>in</strong> groups such as pregnant and lactat<strong>in</strong>g<br />
mo<strong>the</strong>rs, adolescents and children under three<br />
years <strong>of</strong> age need to be given special attenti<strong>on</strong><br />
because <strong>of</strong> <strong>the</strong>ir physiological needs. MDMS<br />
and ICDS are crucial programmes <strong>in</strong> this<br />
regard and <strong>the</strong>ir effective implementati<strong>on</strong> can<br />
c<strong>on</strong>tribute to better health and food security <strong>of</strong><br />
<strong>the</strong> populati<strong>on</strong>.<br />
11. <strong>Food</strong> and nutriti<strong>on</strong> security needs to be<br />
addressed through <strong>in</strong>tegrated complementary<br />
strategies, namely, dietary diversificati<strong>on</strong>,<br />
supplementati<strong>on</strong>, food fortificati<strong>on</strong> and<br />
community and public health measures.<br />
12. Substantial <strong>in</strong>vestments need to be made <strong>in</strong><br />
health and educati<strong>on</strong>, particularly for <strong>the</strong><br />
rural populati<strong>on</strong>. Improvement <strong>in</strong> basic<br />
<strong>in</strong>frastructure like ensur<strong>in</strong>g access to safe<br />
dr<strong>in</strong>k<strong>in</strong>g water, toilets and healthcare facilities<br />
will have a positive impact <strong>on</strong> <strong>the</strong> health and<br />
nutriti<strong>on</strong> <strong>of</strong> <strong>the</strong> populati<strong>on</strong> as highlighted by<br />
<strong>the</strong> <strong>State</strong>s with better facilities. Educati<strong>on</strong> will<br />
lead to greater awareness and understand<strong>in</strong>g<br />
<strong>on</strong> practices to be adopted as underscored by<br />
<strong>the</strong> experience <strong>of</strong> <strong>State</strong>s like Kerala.<br />
13. Changes <strong>in</strong> macroec<strong>on</strong>omic policies to enhance<br />
aggregate demand will enhance <strong>the</strong> prospects<br />
<strong>of</strong> <strong>the</strong> growth <strong>of</strong> rural employment. Quality<br />
employment has to be promoted. This requires<br />
improv<strong>in</strong>g <strong>the</strong> skill levels <strong>of</strong> <strong>the</strong> labour force<br />
<strong>on</strong> a large-scale through massive tra<strong>in</strong><strong>in</strong>g<br />
and capacity build<strong>in</strong>g programmes, both by<br />
government and <strong>the</strong> private sector. In this<br />
c<strong>on</strong>text, <strong>the</strong> expansi<strong>on</strong> <strong>of</strong> NREGA to <strong>the</strong> whole<br />
country is a step <strong>in</strong> <strong>the</strong> right directi<strong>on</strong>. The<br />
Nati<strong>on</strong>al Commissi<strong>on</strong> <strong>on</strong> Farmers has <strong>in</strong> fact<br />
called for mov<strong>in</strong>g forward from this towards a<br />
<strong>Food</strong> Guarantee Act.
Agarwal, Arti Bhanot and Kirti Sangar. 2005.<br />
“Ne<strong>on</strong>atal Care and Transport am<strong>on</strong>g <strong>the</strong><br />
<strong>Urban</strong> Poor: Challenges and Opti<strong>on</strong>s”. Journal<br />
<strong>of</strong> Ne<strong>on</strong>atology 19 (4): 347-52.<br />
Aldrich, Brian C. and R. S. Sandhu. 1998. “Third<br />
World Hous<strong>in</strong>g: The Future Is Now”. Habitat<br />
Internati<strong>on</strong>al 22 (3): 209-13.<br />
Awasthi, D<strong>in</strong>esh, S. P. Kashyap and Jignasu<br />
Yagnik. 2009. “Chang<strong>in</strong>g Sectoral Pr<strong>of</strong>ile<br />
<strong>of</strong> <strong>the</strong> <strong>Urban</strong> Ec<strong>on</strong>omy and Implicati<strong>on</strong>s for<br />
<strong>Urban</strong> Poverty”. In MoHUPA (ed). <strong>India</strong>:<br />
<strong>Urban</strong> Poverty <str<strong>on</strong>g>Report</str<strong>on</strong>g> 2009. New Delhi:<br />
UNDP and Oxford University Press. 94-113.<br />
Census <strong>of</strong> <strong>India</strong>. Primary Census Abstract 1991.<br />
New Delhi: Government <strong>of</strong> <strong>India</strong>.<br />
_____. Primary Census Abstract 2001. New Delhi:<br />
Government <strong>of</strong> <strong>India</strong>.<br />
Chand, Rattan. 2007. “Inequality <strong>in</strong> C<strong>on</strong>sumpti<strong>on</strong><br />
Expenditure <strong>in</strong> <strong>India</strong>n <strong>State</strong>s, 1973-2005”.<br />
Paper presented at <strong>the</strong> Nati<strong>on</strong>al Sem<strong>in</strong>ar <strong>on</strong><br />
NSS 61 st Round Results, organised by M<strong>in</strong>istry<br />
<strong>of</strong> Statistics and Programme Implementati<strong>on</strong>,<br />
Government <strong>of</strong> <strong>India</strong>, October 29-30, New<br />
Delhi.<br />
Chandramouli, C. 2003. “Slums <strong>in</strong> Chennai: A<br />
Pr<strong>of</strong>ile”. In Mart<strong>in</strong> J. Bunch, V. Madha Suresh<br />
and T. Vasantha Kumaran (eds). In Proceed<strong>in</strong>gs<br />
<strong>of</strong> <strong>the</strong> Third Internati<strong>on</strong>al C<strong>on</strong>ference <strong>on</strong><br />
Envir<strong>on</strong>ment and Health. Chennai, 15-<br />
17 December. Chennai: Department <strong>of</strong><br />
References<br />
Geography, University <strong>of</strong> Madras and Faculty<br />
<strong>of</strong> Envir<strong>on</strong>mental Studies, York University.<br />
82-88.<br />
Chandrasekhar, C. P. and Jayati Ghosh. 2001. “Rural<br />
Employment <strong>in</strong> 1990s”. Macroscan. August.<br />
www.macroscan.org<br />
Chandrasekhar, S. 2005. “Growth <strong>of</strong> Slums,<br />
Availability <strong>of</strong> Infrastructure and<br />
Demographics Outcomes <strong>in</strong> Slums: Evidence<br />
from <strong>India</strong>”. Paper presented at <strong>the</strong> sessi<strong>on</strong> <strong>on</strong><br />
<strong>Urban</strong>izati<strong>on</strong> <strong>in</strong> Develop<strong>in</strong>g Countries at <strong>the</strong><br />
annual meet<strong>in</strong>g <strong>of</strong> <strong>the</strong> Populati<strong>on</strong> Associati<strong>on</strong><br />
<strong>of</strong> America. Philadelphia.<br />
Cohen, Barney. 2004. “<strong>Urban</strong> Growth <strong>in</strong><br />
Develop<strong>in</strong>g Countries: A Review <strong>of</strong> Current<br />
Trends and A Cauti<strong>on</strong> Regard<strong>in</strong>g Exist<strong>in</strong>g<br />
Forecasts”. World Development 32 (1): 23-51.<br />
Comptroller and Auditor General <strong>of</strong> <strong>India</strong>: Various<br />
years. Performance Audit <str<strong>on</strong>g>Report</str<strong>on</strong>g>s, Uni<strong>on</strong><br />
and <strong>State</strong>s. New Delhi: Government <strong>of</strong> <strong>India</strong>.<br />
www.cag.gov.<strong>in</strong><br />
Damodaran, Harish. 2007. “Is Poverty Increas<strong>in</strong>gly<br />
Becom<strong>in</strong>g an <strong>Urban</strong> Phenomen<strong>on</strong>?” The H<strong>in</strong>du<br />
Bus<strong>in</strong>ess L<strong>in</strong>e, 23 March.<br />
http://www.bl<strong>on</strong>net.com/2007/03/22/<br />
stories/20070322066<strong>2010</strong>0.htm<br />
Datta, Pranati. 2006. <strong>Urban</strong>isati<strong>on</strong> <strong>in</strong> <strong>India</strong>.<br />
http://epc2006.pr<strong>in</strong>cet<strong>on</strong>.edu/download.<br />
aspx?submissi<strong>on</strong>Id=60134
126 REPORT ON THE STATE OF FOOD INSECURITY IN URBAN INDIA<br />
Deat<strong>on</strong>, Angus and Jean Dreze. 2008. “Nutriti<strong>on</strong><br />
<strong>in</strong> <strong>India</strong>: Facts and Interpretati<strong>on</strong>”<br />
Work<strong>in</strong>g Paper 1071. Research Program <strong>in</strong><br />
Development Studies, Woodrow Wils<strong>on</strong><br />
School <strong>of</strong> Public and Internati<strong>on</strong>al Affairs,<br />
Pr<strong>in</strong>cet<strong>on</strong> University.<br />
http://rpds.pr<strong>in</strong>cet<strong>on</strong>.edu/rpds/papers/pdfs/<br />
deat<strong>on</strong>_dreze_<strong>in</strong>dia_nutriti<strong>on</strong>.pdf<br />
Delisle, Hélène. 1990. “Patterns <strong>of</strong> <strong>Urban</strong> <strong>Food</strong><br />
C<strong>on</strong>sumpti<strong>on</strong> <strong>in</strong> Develop<strong>in</strong>g Countries:<br />
Perspective from <strong>the</strong> 1980s”.<br />
ftp://ftp.fao.org/es/esn/nutriti<strong>on</strong>/urban/<br />
delisle_paper.pdf.<br />
Ec<strong>on</strong>omic and Social Commissi<strong>on</strong> for Asia and <strong>the</strong><br />
Pacific (ESCAP). 2007. “<strong>Urban</strong> Poverty and<br />
<strong>the</strong> Work<strong>in</strong>g Poor: Fac<strong>in</strong>g <strong>the</strong> Challenges <strong>of</strong><br />
<strong>Urban</strong>izati<strong>on</strong> and <strong>Urban</strong> Poverty <strong>in</strong> Asia and<br />
<strong>the</strong> Pacific”.<br />
http://www.unescap.org/pdd/CPR/CPR2007/<br />
English/CPR4_4E.pdf.<br />
Floud, R. 1992. “Anthropometric Measures <strong>of</strong><br />
Nutriti<strong>on</strong>al Status <strong>in</strong> Industrialized Societies:<br />
Europe and North America s<strong>in</strong>ce 1750”. In<br />
S.R. Osmani (ed). Nutriti<strong>on</strong> and Poverty. New<br />
Delhi: Oxford University Press.<br />
Fogel, R. W. 1997. “New F<strong>in</strong>d<strong>in</strong>gs <strong>on</strong> Secular<br />
Trends <strong>in</strong> Nutriti<strong>on</strong> and Mortality:<br />
Some Implicati<strong>on</strong>s for Populati<strong>on</strong> Theory”. In<br />
M. Rosenzweig and O. Stark (eds). Handbook<br />
<strong>of</strong> Populati<strong>on</strong> and Family Ec<strong>on</strong>omics. Vol 1A.<br />
Amsterdam: Elsevier Science. 433-81.<br />
<strong>Food</strong> and Agriculture Organizati<strong>on</strong> (FAO). 2000.<br />
The <strong>State</strong> <strong>of</strong> <strong>Food</strong> <strong>Insecurity</strong> <strong>in</strong> <strong>the</strong> World<br />
2000. Rome.<br />
http://www.fao.org/docrep/x8200e/x8200e00.<br />
htm<br />
_____. 2004. “Safety Nets and <strong>the</strong> Right to <strong>Food</strong>.”<br />
Informati<strong>on</strong> Paper. Intergovernmental Work<strong>in</strong>g<br />
Group – Right To <strong>Food</strong> Group Informati<strong>on</strong><br />
3. Rome.<br />
http://www.fao.org/docrep/<br />
meet<strong>in</strong>g/007/j1444e.htm<br />
_____. 2006. Diet, Nutriti<strong>on</strong> and <strong>the</strong> Preventi<strong>on</strong><br />
<strong>of</strong> Chr<strong>on</strong>ic Diseases. <str<strong>on</strong>g>Report</str<strong>on</strong>g> <strong>of</strong> a Jo<strong>in</strong>t WHO/<br />
FAO Expert C<strong>on</strong>sultati<strong>on</strong>. WHO Technical<br />
<str<strong>on</strong>g>Report</str<strong>on</strong>g> Series 916. Rome.<br />
http://www.fao.org/docrep/005/AC911E/<br />
ac911e00.htm#C<strong>on</strong>tents<br />
_____. 2009. The <strong>State</strong> <strong>of</strong> <strong>Food</strong> <strong>Insecurity</strong> <strong>in</strong> <strong>the</strong><br />
World: Ec<strong>on</strong>omic Crises - Impacts and Less<strong>on</strong>s<br />
Learned. Rome.<br />
http://www.fao.org/docrep/012/i0876e/<br />
i0876e00.htm<br />
<strong>Food</strong> Research and Acti<strong>on</strong> Centre (FRAC).<br />
1995. A Survey <strong>of</strong> Childhood Hunger <strong>in</strong> <strong>the</strong><br />
United <strong>State</strong>s. Community Childhood Hunger<br />
Identificati<strong>on</strong> Project. Wash<strong>in</strong>gt<strong>on</strong>, DC:<br />
FRAC.<br />
Garrett, James L. and Marie T. Ruel. 2003. "Stunted<br />
Child - Overweight Mo<strong>the</strong>r Pairs”. FCND<br />
Discussi<strong>on</strong> Papers 148. Wash<strong>in</strong>gt<strong>on</strong>, DC:<br />
Internati<strong>on</strong>al <strong>Food</strong> Policy Research Institute<br />
(IFPRI).<br />
Ghosh, Jayati. 2003. “The Calorie C<strong>on</strong>sumpti<strong>on</strong><br />
Puzzle”. Macroscan. February.<br />
www.macroscan.com\<br />
Karn, S., S. Shikura and H. Harada. 2003. “Liv<strong>in</strong>g<br />
Envir<strong>on</strong>ment and Health <strong>of</strong> <strong>Urban</strong> Poor: A<br />
Study <strong>in</strong> Mumbai”. Ec<strong>on</strong>omic and Political<br />
Weekly 38 (26): 3575-86.<br />
Kundu, Amitabh. 2009. “Access to Basic<br />
Amenities and <strong>Urban</strong> Security: An Interstate<br />
Analysis with a Focus <strong>on</strong> <strong>the</strong> Social<br />
Susta<strong>in</strong>ability <strong>of</strong> Cities”. In MoHUPA (ed).<br />
<strong>India</strong>: <strong>Urban</strong> Poverty <str<strong>on</strong>g>Report</str<strong>on</strong>g> 2009. New Delhi:<br />
UNDP and Oxford University Press.161-76.
Mathur, M. P., Rajesh Chandra, Satpal S<strong>in</strong>gh<br />
and Basudha Chattopadhyay. 2007. “Norms<br />
and Standards <strong>of</strong> Municipal Basic Services<br />
<strong>in</strong> <strong>India</strong>”. Work<strong>in</strong>g Paper 2007-01. New<br />
Delhi: Nati<strong>on</strong>al Institute <strong>of</strong> <strong>Urban</strong> Affairs.<br />
http://www.niua.org/work<strong>in</strong>g_papers_2007.<br />
asp<br />
Meenakshisundaram, S. S. 2004. “Provisi<strong>on</strong> <strong>of</strong><br />
Safe Dr<strong>in</strong>k<strong>in</strong>g Water to Help Achieve Nutriti<strong>on</strong><br />
Targets”. In Swam<strong>in</strong>athan and Medrano (eds).<br />
Towards Hunger Free <strong>India</strong>: From Visi<strong>on</strong> to<br />
Acti<strong>on</strong>. New Delhi: EastWest Books Pvt. Ltd.<br />
Mendez, Michelle A. and Barry M. Popk<strong>in</strong>. 2004.<br />
“Globalizati<strong>on</strong>, <strong>Urban</strong>izati<strong>on</strong> and Nutriti<strong>on</strong>al<br />
Change <strong>in</strong> <strong>the</strong> Develop<strong>in</strong>g World”. electr<strong>on</strong>ic<br />
Journal <strong>of</strong> Agricultural and Development<br />
Ec<strong>on</strong>omics 1(2).<br />
M<strong>in</strong>istry <strong>of</strong> F<strong>in</strong>ance. 2007. Ec<strong>on</strong>omic Survey,<br />
2006-07. New Delhi: Government <strong>of</strong> <strong>India</strong>.<br />
_____. 2009. Ec<strong>on</strong>omic Survey 2008-09. New<br />
Delhi: Government <strong>of</strong> <strong>India</strong>.<br />
http://<strong>in</strong>diabudget.nic.<strong>in</strong>/es2008-09/esma<strong>in</strong>.<br />
htm<br />
_____. 2009. Uni<strong>on</strong> Budget 2009-10. New Delhi:<br />
Government <strong>of</strong> <strong>India</strong>.<br />
http://<strong>in</strong>diabudget.nic.<strong>in</strong>/ub2009-10/ubma<strong>in</strong>.<br />
htm<br />
_____. <strong>2010</strong>. Ec<strong>on</strong>omic Survey 2009-10. New<br />
Delhi: Government <strong>of</strong> <strong>India</strong>.<br />
http://<strong>in</strong>diabudget.nic.<strong>in</strong>/ub2009-10/ubma<strong>in</strong>.<br />
htm<br />
M<strong>in</strong>istry <strong>of</strong> Hous<strong>in</strong>g and <strong>Urban</strong> Poverty<br />
Alleviati<strong>on</strong> (MoHUPA). 2009. Nati<strong>on</strong>al<br />
<strong>Urban</strong> Hous<strong>in</strong>g and Habitat Policy 2007.<br />
New Delhi: Government <strong>of</strong> <strong>India</strong>.<br />
http://mhupa.gov.<strong>in</strong>/policies/duepa/<br />
Hous<strong>in</strong>gPolicy2007.pdf<br />
REFERENCES 127<br />
______. 2009b. <strong>India</strong>: <strong>Urban</strong> Poverty <str<strong>on</strong>g>Report</str<strong>on</strong>g><br />
2009. New Delhi: UNDP and Oxford<br />
University Press.<br />
M<strong>in</strong>istry <strong>of</strong> <strong>Urban</strong> Development. Nati<strong>on</strong>al <strong>Urban</strong><br />
Sanitati<strong>on</strong> Policy. Government <strong>of</strong> <strong>India</strong>.<br />
http://<strong>in</strong>diasanitati<strong>on</strong>portan.org/sites/default/<br />
files/nusb.pdf<br />
M<strong>in</strong>istry <strong>of</strong> Women and Child Development. <strong>2010</strong>.<br />
<strong>State</strong>-wise Number <strong>of</strong> Children (6 m<strong>on</strong>ths to 6<br />
years) who Received Supplementary Nutriti<strong>on</strong><br />
and Number <strong>of</strong> Children (3-6 years) who<br />
Attended Pre-school Educati<strong>on</strong> under ICDS<br />
Scheme. New Delhi: Government <strong>of</strong> <strong>India</strong>.<br />
http://wcd.nic.<strong>in</strong>/<br />
Mittal, Anuradha. 2009. “The 2008 <strong>Food</strong> Price<br />
Crisis: Reth<strong>in</strong>k<strong>in</strong>g <strong>Food</strong> Security Policies”.<br />
G-24 Discussi<strong>on</strong> Paper Series, No. 56.<br />
Geneva: United Nati<strong>on</strong>s C<strong>on</strong>ference <strong>on</strong> Trade<br />
and Development.<br />
http://www.unctad.org/en/docs/<br />
gdsmdpg2420093_en.pdf.<br />
MSSRF-WFP. 2002. <strong>Food</strong> <strong>Insecurity</strong> Atlas <strong>of</strong><br />
<strong>Urban</strong> <strong>India</strong>. Chennai: M. S. Swam<strong>in</strong>athan<br />
Research Foundati<strong>on</strong>.<br />
_____. 2008. <str<strong>on</strong>g>Report</str<strong>on</strong>g> <strong>on</strong> <strong>the</strong> <strong>State</strong> <strong>of</strong> <strong>Food</strong> <strong>Insecurity</strong><br />
<strong>in</strong> Rural <strong>India</strong>. Chennai: M. S. Swam<strong>in</strong>athan<br />
Research Foundati<strong>on</strong>.<br />
Narayana, Muttur Ranganathan. 2008.<br />
“Performance <strong>of</strong> <strong>Urban</strong> <strong>India</strong> dur<strong>in</strong>g<br />
Globalizati<strong>on</strong> Period: An Ec<strong>on</strong>omic Analysis”.<br />
CIRJE-F-543, Discussi<strong>on</strong> Papers. Tokyo:<br />
University <strong>of</strong> Tokyo.<br />
http://www.e.u-tokyo.ac.jp/cirje/research/<br />
dp/2008/2008cf543.pdf<br />
Nati<strong>on</strong>al Commissi<strong>on</strong> for Enterprises <strong>in</strong> <strong>the</strong><br />
Unorganised Sector (NCEUS). 2007. <str<strong>on</strong>g>Report</str<strong>on</strong>g><br />
<strong>on</strong> C<strong>on</strong>diti<strong>on</strong>s <strong>of</strong> Work and Promoti<strong>on</strong> <strong>of</strong>
128 REPORT ON THE STATE OF FOOD INSECURITY IN URBAN INDIA<br />
Livelihoods <strong>in</strong> <strong>the</strong> Unorganised Sector.<br />
New Delhi: Government <strong>of</strong> <strong>India</strong>. www.nceus.<br />
gov.<strong>in</strong><br />
_____. 2009. The Challenge <strong>of</strong> Employment <strong>in</strong><br />
<strong>India</strong>: An Informal Ec<strong>on</strong>omy Perspective.<br />
New Delhi: Government <strong>of</strong> <strong>India</strong>.<br />
www.nceus.gov.<strong>in</strong><br />
Nati<strong>on</strong>al Family Health Survey (NFHS). 2000.<br />
NFHS 2, 2005-06. Mumbai: <strong>India</strong>n Institute<br />
<strong>of</strong> Populati<strong>on</strong> Sciences.<br />
_____. 2007. NFHS 3, 2005-06. Mumbai: <strong>India</strong>n<br />
Institute <strong>of</strong> Populati<strong>on</strong> Sciences.<br />
Nati<strong>on</strong>al Sample Survey Organisati<strong>on</strong> (NSSO).<br />
1996a. 50 th Round. <str<strong>on</strong>g>Report</str<strong>on</strong>g> No. 402. Level and<br />
Pattern <strong>of</strong> C<strong>on</strong>sumer Expenditure. New Delhi:<br />
Government <strong>of</strong> <strong>India</strong>.<br />
_____. 1996b. 50 th Round. <str<strong>on</strong>g>Report</str<strong>on</strong>g> No. 405.<br />
Nutriti<strong>on</strong>al Intake <strong>in</strong> <strong>India</strong>. New Delhi:<br />
Government <strong>of</strong> <strong>India</strong>..<br />
_____. 1997a. 50 th Round. <str<strong>on</strong>g>Report</str<strong>on</strong>g> No. 404.<br />
C<strong>on</strong>sumpti<strong>on</strong> <strong>of</strong> Some Important Commodities<br />
<strong>in</strong> <strong>India</strong>. New Delhi: Government <strong>of</strong> <strong>India</strong>.<br />
_____. 1997b. 50 th Round. <str<strong>on</strong>g>Report</str<strong>on</strong>g> No. 409.<br />
Employment and Unemployment <strong>in</strong> <strong>India</strong>.<br />
New Delhi: Government <strong>of</strong> <strong>India</strong>.<br />
_____. 1997c. 50 th Round. <str<strong>on</strong>g>Report</str<strong>on</strong>g> No. 410/1.<br />
Dwell<strong>in</strong>gs <strong>in</strong> <strong>India</strong>. New Delhi: Government<br />
<strong>of</strong> <strong>India</strong>.<br />
_____. 2001a. 55 th Round. <str<strong>on</strong>g>Report</str<strong>on</strong>g> No. 458.<br />
Employment and Unemployment Situati<strong>on</strong> <strong>in</strong><br />
<strong>India</strong> (Part – I). New Delhi: Government <strong>of</strong><br />
<strong>India</strong>.<br />
_____. 2001b. 55 th Round. <str<strong>on</strong>g>Report</str<strong>on</strong>g> No. 462.<br />
Employment and Unemployment Situati<strong>on</strong><br />
<strong>in</strong> Cities and Towns <strong>in</strong> <strong>India</strong>. New Delhi:<br />
Government <strong>of</strong> <strong>India</strong>.<br />
_____. 2001c. 55 th Round. <str<strong>on</strong>g>Report</str<strong>on</strong>g> No. 471.<br />
Nutriti<strong>on</strong>al Intake <strong>in</strong> <strong>India</strong>. New Delhi:<br />
Government <strong>of</strong> <strong>India</strong>.<br />
_____. 2003. 58 th Round. <str<strong>on</strong>g>Report</str<strong>on</strong>g> No. 486.<br />
C<strong>on</strong>diti<strong>on</strong>s <strong>of</strong> <strong>Urban</strong> Slums. New Delhi:<br />
Government <strong>of</strong> <strong>India</strong>.<br />
_____. 2004. 58 th Round. <str<strong>on</strong>g>Report</str<strong>on</strong>g> No. 488. Hous<strong>in</strong>g<br />
C<strong>on</strong>diti<strong>on</strong> <strong>in</strong> <strong>India</strong>. New Delhi: Government<br />
<strong>of</strong> <strong>India</strong>.<br />
_____. 2006. 61 st Round. <str<strong>on</strong>g>Report</str<strong>on</strong>g> No. 515.<br />
Employment and Unemployment Situati<strong>on</strong> <strong>in</strong><br />
<strong>India</strong>, (Part – I). New Delhi: Government <strong>of</strong><br />
<strong>India</strong>.<br />
_____. 2007a. 61 st Round <str<strong>on</strong>g>Report</str<strong>on</strong>g> No. 520.<br />
Employment and Unemployment Situati<strong>on</strong><br />
<strong>in</strong> Cities and Towns <strong>in</strong> <strong>India</strong>. New Delhi:<br />
Government <strong>of</strong> <strong>India</strong>.<br />
_____. 2007b. 61 st Round. <str<strong>on</strong>g>Report</str<strong>on</strong>g> No. 509.<br />
Household C<strong>on</strong>sumpti<strong>on</strong> <strong>of</strong> Various Goods and<br />
Services <strong>in</strong> <strong>India</strong>. New Delhi: Government <strong>of</strong><br />
<strong>India</strong>.<br />
_____. 2007c. 61 st Round. <str<strong>on</strong>g>Report</str<strong>on</strong>g> No. 513.<br />
Nutriti<strong>on</strong>al Intake <strong>in</strong> <strong>India</strong>. New Delhi:<br />
Government <strong>of</strong> <strong>India</strong>.<br />
_____. 2007d. 61 st Round. <str<strong>on</strong>g>Report</str<strong>on</strong>g> No. 510.<br />
Public Distributi<strong>on</strong> System and O<strong>the</strong>r Sources<br />
<strong>of</strong> Household C<strong>on</strong>sumpti<strong>on</strong>. New Delhi:<br />
Government <strong>of</strong> <strong>India</strong>.<br />
Patnaik, Utsa. 2007. “Neo-liberalism and Rural<br />
Poverty <strong>in</strong> <strong>India</strong>”. Ec<strong>on</strong>omic and Political<br />
Weekly 42 (30).<br />
_____. 2008. “Global and Local Inflati<strong>on</strong> <strong>in</strong> <strong>the</strong><br />
C<strong>on</strong>text <strong>of</strong> Ris<strong>in</strong>g <strong>Urban</strong> Poverty”. People<br />
Democracy. June 2008.<br />
_____. 2009. Changes <strong>in</strong> <strong>Urban</strong> Poverty <strong>in</strong> <strong>the</strong><br />
Light <strong>of</strong> Rural Poverty: Trends under Ec<strong>on</strong>omic
Reforms, 1993-94 to 2004-05. Unpublished<br />
document.<br />
Plann<strong>in</strong>g Commissi<strong>on</strong> <strong>of</strong> <strong>India</strong> 1993. <str<strong>on</strong>g>Report</str<strong>on</strong>g> <strong>of</strong><br />
<strong>the</strong> Expert Group <strong>on</strong> Estimati<strong>on</strong> <strong>of</strong> Proporti<strong>on</strong><br />
and Number <strong>of</strong> Poor. New Delhi: Government<br />
<strong>of</strong> <strong>India</strong>.<br />
_____. 2005. Performance Evaluati<strong>on</strong> <strong>of</strong> Targeted<br />
Public Distributi<strong>on</strong> System. New Delhi:<br />
Government <strong>of</strong> <strong>India</strong>.<br />
_____. 2007. <str<strong>on</strong>g>Report</str<strong>on</strong>g> <strong>of</strong> <strong>the</strong> Steer<strong>in</strong>g Committee<br />
<strong>on</strong> <strong>Urban</strong> Development for Eleventh Five Year<br />
Plan (2007-2012). New Delhi: Government <strong>of</strong><br />
<strong>India</strong>.<br />
_____. 2008. Nutriti<strong>on</strong> and Social Safety Net.<br />
Eleventh Five Year Plan, Vol. II. New Delhi:<br />
Government <strong>of</strong> <strong>India</strong>.<br />
Radhakrishna, R. 2006. “<strong>Food</strong> C<strong>on</strong>sumpti<strong>on</strong><br />
and Nutriti<strong>on</strong>al Status <strong>in</strong> <strong>India</strong>: Emerg<strong>in</strong>g<br />
Trends and Perspectives”. Work<strong>in</strong>g Paper<br />
2006-008. Mumbai: Indira Gandhi Institute <strong>of</strong><br />
Development Research.<br />
Ramachandran, Maithili., K. S. Kavi Kumar and<br />
Br<strong>in</strong>da Viswanathan. 2006. “Vulnerability to<br />
Chr<strong>on</strong>ic Energy Deficiency: An Empirical<br />
Analysis <strong>of</strong> Women <strong>in</strong> Uttar Pradesh, <strong>India</strong>”.<br />
Work<strong>in</strong>g Paper 12. Chennai: Madras School <strong>of</strong><br />
Ec<strong>on</strong>omics.<br />
Ray, Ranjan. 2007. “Changes <strong>in</strong> <strong>Food</strong><br />
C<strong>on</strong>sumpti<strong>on</strong> and <strong>the</strong> Implicati<strong>on</strong>s for <strong>Food</strong><br />
Security and Undernourishment: <strong>India</strong> <strong>in</strong> <strong>the</strong><br />
1990s”. Development and Change 38 (2).<br />
Rogers, B. and J. Coates. 2002. <strong>Food</strong>-based Safety<br />
Nets and Related Programs. Social Safety Net<br />
Primer Series. Wash<strong>in</strong>gt<strong>on</strong>, DC: The World<br />
Bank.<br />
http://siteresources.worldbank.org/<br />
socialprotecti<strong>on</strong>/Resources/SP-Discussi<strong>on</strong>papers/Safety-Nets-DP/0225.pdf.<br />
REFERENCES 129<br />
Ruel, Marie T. and James L. Garrett. 2004.<br />
“Features <strong>of</strong> <strong>Urban</strong> <strong>Food</strong> and Nutriti<strong>on</strong><br />
Security and C<strong>on</strong>siderati<strong>on</strong>s for Successful<br />
<strong>Urban</strong> Programm<strong>in</strong>g”. electr<strong>on</strong>ic Journal <strong>of</strong><br />
Agricultural and Development Ec<strong>on</strong>omics<br />
1 (2): 242-71<br />
Rustagi, Preet., Sandip Sarkar and P<strong>in</strong>aki Joddar.<br />
2009. “The Gender Dimensi<strong>on</strong>s <strong>of</strong> <strong>Urban</strong><br />
Poverty”. In MoHUPA (ed). <strong>India</strong>: <strong>Urban</strong><br />
Poverty <str<strong>on</strong>g>Report</str<strong>on</strong>g> 2009. New Delhi: UNDP and<br />
Oxford University Press. 28-49.<br />
SACOSAN. 2008. “Susta<strong>in</strong><strong>in</strong>g <strong>the</strong> Sanitati<strong>on</strong><br />
Revoluti<strong>on</strong>”. <strong>India</strong> Country Paper. Sec<strong>on</strong>d<br />
South Asian C<strong>on</strong>ference <strong>on</strong> Sanitati<strong>on</strong>. New<br />
Delhi.<br />
Sagar, Alpana and Imrana Qadeer. 2004.<br />
“Community Health and Sanitati<strong>on</strong>: A Visi<strong>on</strong><br />
for Hunger Free <strong>India</strong>”. In Swam<strong>in</strong>athan and<br />
Medrano (eds). Towards Hunger Free <strong>India</strong>:<br />
From Visi<strong>on</strong> to Acti<strong>on</strong>. New Delhi: EastWest<br />
Books Pvt. Ltd.<br />
Sen, Abhijit and Himanshu. 2007. “Some Aspects<br />
<strong>of</strong> Poverty <strong>in</strong> <strong>India</strong>”. Paper presented at <strong>the</strong><br />
Internati<strong>on</strong>al C<strong>on</strong>ference <strong>on</strong> Revisit<strong>in</strong>g <strong>the</strong><br />
Poverty Issue: Measurement, Identificati<strong>on</strong><br />
and Eradicati<strong>on</strong>. Patna, 20-22 July.<br />
Sengupta, S. and P. D. Joshi. 1978. “C<strong>on</strong>sumpti<strong>on</strong><br />
<strong>of</strong> Cereals and Energy C<strong>on</strong>tent <strong>of</strong> <strong>Food</strong><br />
C<strong>on</strong>sumpti<strong>on</strong>”. Sarvekshana 2 (1): 1-13.<br />
Shaw, Annapurna. 2007. “Basic Amenities <strong>in</strong><br />
<strong>Urban</strong> <strong>India</strong>: Analysis at <strong>State</strong> and Town<br />
Level”. Work<strong>in</strong>g Paper Series 616. Kolkata:<br />
<strong>India</strong>n Institute <strong>of</strong> Management.<br />
Sivakumar, B. 2009. “Dissem<strong>in</strong>ati<strong>on</strong> <strong>of</strong> <strong>the</strong> New<br />
RDA for <strong>India</strong>ns”. Paper presented at <strong>the</strong> 41 st<br />
Nati<strong>on</strong>al C<strong>on</strong>ference <strong>of</strong> Nutriti<strong>on</strong> Society <strong>of</strong><br />
<strong>India</strong>. Hyderabad, 19 November.
130 REPORT ON THE STATE OF FOOD INSECURITY IN URBAN INDIA<br />
Sivaramakrishnan, K. C. and B. N. S<strong>in</strong>gh.<br />
2005. <strong>Urban</strong>isati<strong>on</strong>. New Delhi: Plann<strong>in</strong>g<br />
Commissi<strong>on</strong> <strong>of</strong> <strong>India</strong>.<br />
http://plann<strong>in</strong>gcommissi<strong>on</strong>.gov.<strong>in</strong>/reports/<br />
sereport/ser/visi<strong>on</strong>2025/urban.doc<br />
Sridhar, C. R. 2006. “Slum Demoliti<strong>on</strong> and <strong>Urban</strong><br />
Cleans<strong>in</strong>g”. New Age.<br />
http://www.solidnet.org/cgi-b<strong>in</strong>/<br />
lpr?parties/0370=<strong>in</strong>dia,_communist_party_<br />
<strong>of</strong>_<strong>in</strong>dia/875<strong>in</strong>diacp17jul06.doc<br />
Suryanarayana, M. H. 2008. “Agflati<strong>on</strong> and <strong>the</strong><br />
PDS: Some Issues”. Work<strong>in</strong>g Paper 2008-<br />
009, Mumbai: Indira Gandhi Institute <strong>of</strong><br />
Development Research.<br />
Swam<strong>in</strong>athan, Madhura. 1997. “Dangers <strong>of</strong><br />
Narrow Target<strong>in</strong>g”. Fr<strong>on</strong>tl<strong>in</strong>e 14 (21).<br />
______. 2008. “Public Distributi<strong>on</strong> and Social<br />
Exclusi<strong>on</strong>”. The H<strong>in</strong>du, 5 July.<br />
http://www.h<strong>in</strong>du.com/2008/05/07/stories/<br />
2008050754981000.htm<br />
Transparency Internati<strong>on</strong>al <strong>India</strong> and Centre for<br />
Media Studies. 2005. <strong>India</strong> Corrupti<strong>on</strong> Study<br />
2005: To Improve Governance.<br />
http://www.cms<strong>in</strong>dia.org/cms/events/<br />
corrupti<strong>on</strong>.pdf and<br />
http://www.livem<strong>in</strong>t.com/2007/04/01225600/<br />
1E485215-9AA8-4D86-8E5F-<br />
A0A4E599FDEDArtVPF.pdf<br />
_____. 2008. <strong>India</strong> Corrupti<strong>on</strong> Study 2007: With<br />
Focus <strong>on</strong> BPL Households.<br />
http://www.cms<strong>in</strong>dia.org/highlights.pdf<br />
UNDP. 2009. Fact Sheet. In MoHUPA (ed).<br />
<strong>India</strong>: <strong>Urban</strong> Poverty <str<strong>on</strong>g>Report</str<strong>on</strong>g> 2009. New<br />
Delhi: UNDP and Oxford University Press.<br />
http://data.undp.org.<strong>in</strong>/poverty_reducti<strong>on</strong>/<br />
Factsheet_IUPR_09a.pdf<br />
UN-HABITAT. 2003. “The Challenge <strong>of</strong> Slums”.<br />
In Global <str<strong>on</strong>g>Report</str<strong>on</strong>g> <strong>on</strong> Human Settlements<br />
2003. United Nati<strong>on</strong>s Human Settlements<br />
Programme. L<strong>on</strong>d<strong>on</strong> and Sterl<strong>in</strong>g, VA:<br />
Earthscan Publicati<strong>on</strong>s.<br />
_____. 2008. “<strong>State</strong> <strong>of</strong> <strong>the</strong> World’s Cities<br />
2008/2009”. In Harm<strong>on</strong>ious Cities. L<strong>on</strong>d<strong>on</strong>:<br />
Earthscan Publicati<strong>on</strong>s.<br />
UNWFP. 2002. “<strong>Urban</strong> <strong>Food</strong> <strong>Insecurity</strong>: Strategies<br />
for WFP <strong>Food</strong> Assistance to <strong>Urban</strong> Areas”.<br />
Policy Issues Agenda Item 5. Document<br />
presented at Executive Board Annual Sessi<strong>on</strong>.<br />
Rome, 20-23 May.<br />
http://www.fao.org/rightt<strong>of</strong>ood/kc/<br />
downloads/vl/docs/AH450.pdf
Participants at <strong>the</strong> C<strong>on</strong>sultati<strong>on</strong> <strong>on</strong> <strong>the</strong><br />
<str<strong>on</strong>g>Report</str<strong>on</strong>g> <strong>on</strong> <strong>the</strong> <strong>State</strong> <strong>of</strong> <strong>Food</strong> <strong>Insecurity</strong> <strong>in</strong> <strong>Urban</strong> <strong>India</strong><br />
New Delhi, 25 February <strong>2010</strong><br />
Name Organisati<strong>on</strong><br />
Dr. C. Chandramouli Registrar General & Census Commissi<strong>on</strong>er, <strong>India</strong><br />
New Delhi<br />
Dr. N. C. Saxena Supreme Court Commissi<strong>on</strong>er for <strong>Food</strong> Security<br />
New Delhi<br />
Dr. Renu Khosla Director, Centre for <strong>Urban</strong> and Regi<strong>on</strong>al Excellence<br />
New Delhi<br />
Mr. Biraj Patnaik Right to <strong>Food</strong> Campaign Secretariat<br />
Office <strong>of</strong> <strong>the</strong> Commissi<strong>on</strong>ers <strong>of</strong> <strong>the</strong> Supreme Court<br />
New Delhi<br />
Mr. Mukesh Khullar Jo<strong>in</strong>t Secretary (DM &IC)<br />
Department <strong>of</strong> Agriculture and Cooperati<strong>on</strong><br />
M<strong>in</strong>istry <strong>of</strong> Agriculture, Government <strong>of</strong> <strong>India</strong><br />
New Delhi<br />
Dr. Shashi P. Gupta Former Technical Adviser, <strong>Food</strong> & Nutriti<strong>on</strong> Board, and C<strong>on</strong>sultant, The<br />
Vistaar Project Intra Health Internati<strong>on</strong>al Inc.<br />
New Delhi<br />
Dr. F. Ram Director<br />
Internati<strong>on</strong>al Institute for Populati<strong>on</strong> Sciences<br />
Mumbai<br />
Dr. D. Roy Choudhury Deputy Registrar General<br />
Office <strong>of</strong> <strong>the</strong> Registrar General <strong>of</strong> <strong>India</strong><br />
Government <strong>of</strong> <strong>India</strong><br />
New Delhi<br />
Dr. Kajali Pa<strong>in</strong>tal Nutriti<strong>on</strong> Specialist - IYCN at UNICEF<br />
New Delhi<br />
Dr. Mohamed Ayoya Nutriti<strong>on</strong> Specialist<br />
UNICEF <strong>India</strong> Country Office<br />
New Delhi<br />
Dr. Indu Agnihotri Deputy Director<br />
Centre for Women’s Development Studies<br />
New Delhi<br />
Dr. Debol<strong>in</strong>a Kundu Associate Pr<strong>of</strong>essor<br />
Nati<strong>on</strong>al Institute <strong>of</strong> <strong>Urban</strong> Affairs<br />
New Delhi<br />
Dr. Nidhi Chaudhary TNP – Nutriti<strong>on</strong> for Health Development<br />
WHO <strong>India</strong><br />
New Delhi
132 REPORT ON THE STATE OF FOOD INSECURITY IN URBAN INDIA<br />
Mr. P. Biswas Department <strong>of</strong> <strong>Food</strong> and Public Distributi<strong>on</strong> Government <strong>of</strong> <strong>India</strong><br />
New Delhi<br />
Mr. S. Pattabhiraman Development Management Pr<strong>of</strong>essi<strong>on</strong>al - Project Manager at European<br />
Uni<strong>on</strong>, <strong>India</strong><br />
New Delhi<br />
Mr. S. C. Seddey Director General and Chief Executive Officer<br />
Nati<strong>on</strong>al Sample Survey Organisati<strong>on</strong><br />
New Delhi<br />
Mr. Sajjad Hassan Office <strong>of</strong> <strong>the</strong> Commissi<strong>on</strong>ers <strong>of</strong> <strong>the</strong> Supreme Court<br />
New Delhi<br />
Ms. Mihoko Tamamura Country Director<br />
United Nati<strong>on</strong>s World <strong>Food</strong> Programme<br />
New Delhi<br />
Mr. Mat<strong>the</strong>w Mcilvenna Deputy Country Director<br />
United Nati<strong>on</strong>s World <strong>Food</strong> Programme<br />
New Delhi<br />
Ms. Pradnya Paithankar Programme Officer (M&E-VAM)<br />
United Nati<strong>on</strong>s World <strong>Food</strong> Programme<br />
New Delhi<br />
Dr. K. S. Murali Programme Officer (Climate Change)<br />
United Nati<strong>on</strong>s World <strong>Food</strong> Programme<br />
New Delhi<br />
Dr. Shariqua Yunus Programme Officer (Nutriti<strong>on</strong> & Health)<br />
United Nati<strong>on</strong>s World <strong>Food</strong> Programme<br />
New Delhi<br />
Mr. Balparitosh Dash VAM Officer<br />
United Nati<strong>on</strong>s World <strong>Food</strong> Programme<br />
New Delhi<br />
Mr. Philip Ratnam <str<strong>on</strong>g>Report</str<strong>on</strong>g>s Officer<br />
United Nati<strong>on</strong>s World <strong>Food</strong> Programme<br />
New Delhi<br />
Pr<strong>of</strong>essor M. S. Swam<strong>in</strong>athan Chairman<br />
M. S. Swam<strong>in</strong>athan Research Foundati<strong>on</strong><br />
Chennai<br />
Dr. Ajay Parida Executive Director<br />
M. S. Swam<strong>in</strong>athan Research Foundati<strong>on</strong><br />
Chennai<br />
Pr<strong>of</strong>essor V. B. Athreya Adviser, <strong>Food</strong> Security<br />
M. S. Swam<strong>in</strong>athan Research Foundati<strong>on</strong><br />
Chennai<br />
Dr. R. Rukmani Director <strong>in</strong>-charge, <strong>Food</strong> Security<br />
M. S. Swam<strong>in</strong>athan Research Foundati<strong>on</strong><br />
Chennai
Acknowledgements<br />
The <str<strong>on</strong>g>Report</str<strong>on</strong>g> <strong>on</strong> <strong>the</strong> <strong>State</strong> <strong>of</strong> <strong>Food</strong> <strong>Insecurity</strong> <strong>in</strong> <strong>Urban</strong> <strong>India</strong> would not have been possible without<br />
<strong>the</strong> support we at MSSRF received from <strong>the</strong> World <strong>Food</strong> Programme <strong>India</strong>, and we are grateful for this<br />
opportunity to have studied <strong>the</strong> food security situati<strong>on</strong> across urban <strong>India</strong>. We s<strong>in</strong>cerely thank Ms. Mihoko<br />
Tamamura, Country Director, WFP <strong>India</strong> Country Office, and her colleagues <strong>in</strong> WFP — <strong>in</strong> particular,<br />
Ms. Pradnya Paithankar, Programme Officer, M&E/VAM, and Dr. K. S. Murali, Programme Officer,<br />
Climate Change. A c<strong>on</strong>sultati<strong>on</strong> was organised <strong>on</strong> 25 February <strong>2010</strong> <strong>in</strong> New Delhi to discuss <strong>the</strong> first<br />
draft <strong>of</strong> this <str<strong>on</strong>g>Report</str<strong>on</strong>g>, and <strong>the</strong> critical <strong>in</strong>puts we received from <strong>the</strong> participants were much welcomed.<br />
At <strong>the</strong> M. S. Swam<strong>in</strong>athan Research Foundati<strong>on</strong>, <strong>the</strong> preparati<strong>on</strong> <strong>of</strong> this report was steered by<br />
Pr<strong>of</strong>essor Venkatesh Athreya <strong>in</strong> associati<strong>on</strong> with a team <strong>of</strong> researchers compris<strong>in</strong>g R. V. Bhavani,<br />
R. Rukmani, G. Anuradha, R. Gop<strong>in</strong>ath and A. Sakthi Velan. Without Pr<strong>of</strong>essor Athreya’s c<strong>on</strong>tributi<strong>on</strong>,<br />
this <str<strong>on</strong>g>Report</str<strong>on</strong>g> would not have been possible and I am <strong>in</strong>debted to him as well as to each and every member<br />
<strong>of</strong> <strong>the</strong> research team who worked hard to complete <strong>the</strong> work <strong>on</strong> time. Our thanks to Ms. Divya Sekar <strong>of</strong><br />
Madras School <strong>of</strong> Ec<strong>on</strong>omics for her c<strong>on</strong>tributi<strong>on</strong> <strong>in</strong> data analysis.<br />
The support and guidance <strong>of</strong> our Chairman, Pr<strong>of</strong>essor M. S. Swam<strong>in</strong>athan, has been a major source<br />
<strong>of</strong> strength <strong>in</strong> our endeavour. We are grateful to Dr. Ajay Parida, Executive Director, MSSRF for his<br />
c<strong>on</strong>stant and valuable support. Special thanks to Dr. V. Arivudai Nambi, <strong>of</strong> <strong>the</strong> Biodiversity Programme<br />
Area, MSSRF, for his write-up <strong>on</strong> Koozh <strong>in</strong> Chennai and to Mr. K. Jayakumar, GIS secti<strong>on</strong> <strong>of</strong> MSSRF,<br />
for his assistance <strong>in</strong> <strong>the</strong> preparati<strong>on</strong> <strong>of</strong> <strong>the</strong> maps. We greatly appreciate <strong>the</strong> assistance <strong>of</strong> our colleagues<br />
at <strong>the</strong> Foundati<strong>on</strong>, particularly from <strong>the</strong> library and <strong>the</strong> accounts and adm<strong>in</strong>istrati<strong>on</strong> departments.<br />
Our special thanks to <strong>the</strong> Director, Map Publicati<strong>on</strong>s, Survey <strong>of</strong> <strong>India</strong>, for <strong>the</strong> endorsement <strong>of</strong> <strong>the</strong><br />
maps <strong>in</strong>cluded <strong>in</strong> this <str<strong>on</strong>g>Report</str<strong>on</strong>g>.<br />
Our s<strong>in</strong>cere thanks also go to Ms. Gita Gopalkrishnan for edit<strong>in</strong>g <strong>the</strong> report, to Mr. Nathan G for<br />
<strong>the</strong> photographs and to M/s. Nagaraj and Company Private Limited, Chennai for provid<strong>in</strong>g <strong>the</strong> cover<br />
design and quality pr<strong>in</strong>t<strong>in</strong>g <strong>of</strong> this publicati<strong>on</strong> <strong>on</strong> time.<br />
R. Rukmani<br />
Director <strong>in</strong>-charge<br />
<strong>Food</strong> Security<br />
MSSRF, Chennai
M S Swam<strong>in</strong>athan Research Foundati<strong>on</strong><br />
Third Cross Street<br />
Taramani Instituti<strong>on</strong>al Area<br />
Chennai – 600113<br />
Tel : +91 44 22541698 / 2698<br />
www.mssrf.org<br />
World <strong>Food</strong> Programme<br />
2, Poorvi Marg, Vasant Vihar<br />
New Delhi – 110057<br />
Tel: +91 11 4655 4000<br />
www.wfp.org