Download PDF - Voith Turbo
Download PDF - Voith Turbo
Download PDF - Voith Turbo

Create successful ePaper yourself
Turn your PDF publications into a flip-book with our unique Google optimized e-Paper software.
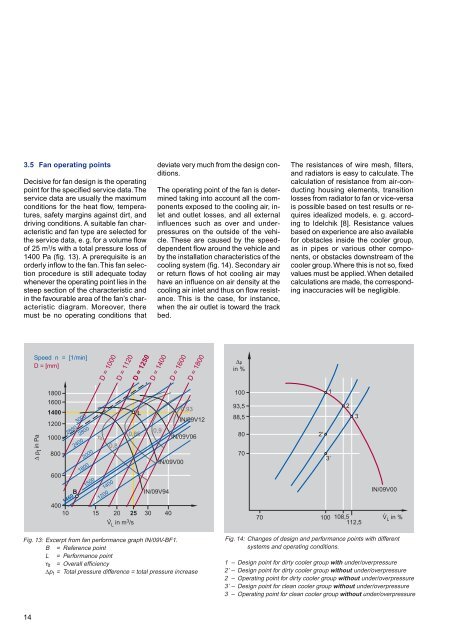
3.5 Fan operating points<br />
Decisive for fan design is the operating<br />
point for the specified service data. The<br />
service data are usually the maximum<br />
conditions for the heat flow, temperatures,<br />
safety margins against dirt, and<br />
driving conditions. A suitable fan characteristic<br />
and fan type are selected for<br />
the service data, e. g. for a volume flow<br />
of 25 m 3 /s with a total pressure loss of<br />
1400 Pa (fig. 13). A prerequisite is an<br />
orderly inflow to the fan. This fan selection<br />
procedure is still adequate today<br />
whenever the operating point lies in the<br />
steep section of the characteristic and<br />
in the favourable area of the fan’s characteristic<br />
diagram. Moreover, there<br />
must be no operating conditions that<br />
14<br />
Speed n = [1/min]<br />
D = [mm]<br />
∆ p t in Pa<br />
1800<br />
1600<br />
1400<br />
1200<br />
1000<br />
800<br />
600<br />
1460<br />
3000<br />
2850<br />
2800<br />
2400<br />
B<br />
2000<br />
1800<br />
1500<br />
ηt<br />
D = 1000<br />
0,8<br />
1400<br />
1200<br />
D = 1120<br />
400<br />
10 15 20 25 30 40<br />
V L in m 3 /s<br />
D = 1250<br />
Fig. 13: Excerpt from fan performance graph IN/09V-BF1.<br />
B = Reference point<br />
L = Performance point<br />
ηt = Overall efficiency<br />
∆pt = Total pressure difference = total pressure increase<br />
L<br />
0,85<br />
deviate very much from the design conditions.<br />
The operating point of the fan is determined<br />
taking into account all the components<br />
exposed to the cooling air, inlet<br />
and outlet losses, and all external<br />
influences such as over and underpressures<br />
on the outside of the vehicle.<br />
These are caused by the speeddependent<br />
flow around the vehicle and<br />
by the installation characteristics of the<br />
cooling system (fig. 14). Secondary air<br />
or return flows of hot cooling air may<br />
have an influence on air density at the<br />
cooling air inlet and thus on flow resistance.<br />
This is the case, for instance,<br />
when the air outlet is toward the track<br />
bed.<br />
D = 1400<br />
0,9<br />
IN/09V94<br />
D = 1600<br />
IN/09V00<br />
0,93<br />
IN/09V06<br />
D = 1800<br />
IN/09V12<br />
∆p<br />
in %<br />
100<br />
93,5<br />
88,5<br />
80<br />
70<br />
70<br />
The resistances of wire mesh, filters,<br />
and radiators is easy to calculate. The<br />
calculation of resistance from air-conducting<br />
housing elements, transition<br />
losses from radiator to fan or vice-versa<br />
is possible based on test results or requires<br />
idealized models, e. g. according<br />
to Idelchik [8]. Resistance values<br />
based on experience are also available<br />
for obstacles inside the cooler group,<br />
as in pipes or various other components,<br />
or obstacles downstream of the<br />
cooler group. Where this is not so, fixed<br />
values must be applied. When detailed<br />
calculations are made, the corresponding<br />
inaccuracies will be negligible.<br />
2’<br />
1<br />
3’<br />
100<br />
2<br />
3<br />
108,5 112,5<br />
IN/09V00<br />
V L in %<br />
Fig. 14: Changes of design and performance points with different<br />
systems and operating conditions.<br />
1 – Design point for dirty cooler group with under/overpressure<br />
2’ – Design point for dirty cooler group without under/overpressure<br />
2 – Operating point for dirty cooler group without under/overpressure<br />
3’ – Design point for clean cooler group without under/overpressure<br />
3 – Operating point for clean cooler group without under/overpressure