Euston-Brown, D., Rathogwa, N & Richardson ... - DWA Home Page
Euston-Brown, D., Rathogwa, N & Richardson ... - DWA Home Page
Euston-Brown, D., Rathogwa, N & Richardson ... - DWA Home Page

Create successful ePaper yourself
Turn your PDF publications into a flip-book with our unique Google optimized e-Paper software.
odorata and L. camara, as well as representing a similar habitat type. Soil augors were done to ensure<br />
that the sites all had similar soils, and although soils did vary slightly between the plots, this was<br />
recorded. The centres of the plots were marked with steal pegs similar to that used for the former study<br />
(see Appendix 1). The plots were circular and had a radius of 4 m. Danger tape was used to demarcate<br />
the plots for the clearing teams. GPS co-ordinates were taken for each plot and photographs of the<br />
plot, the peg and the augered soil were taken in 2004 and 2006. After the initial treatments in August<br />
2004, two additional follow up treatments and sampling was done in June 2005 and June 2006. This<br />
data was submitted in three excel files together with this report.<br />
Within each 4 m radius circular plot all the indigenous plants (i.e. trees, shrubs, herbs, lianas, creepers,<br />
forbs and grasses) were identified and the tree diversity (i.e. number of indigenous trees and shrubs,<br />
herb diversity (i.e. number of herbs), and grass diversity (i.e. number of grasses) per plot were<br />
established and recorded. Other plot variables such as percentage (%) canopy cover, % grass cover,<br />
% C. odorata cover and % C. odorata flowering were also estimated and recorded. The presence of<br />
other invasives within the 4 m radius plot was also investigated and recorded. Soil samples were also<br />
taken here in 2004 and in 2006 in order that seed banks could be determined. The botanical data was<br />
recorded before the treatments were applied.<br />
The WfW team was then asked to apply the different treatments following their normal clearing<br />
methods and schedule. The foremen were also requested to record the time spent per plot and the<br />
number of people who were involved during clearing. Table 1 shows the different treatments that were<br />
applied at the two sites.<br />
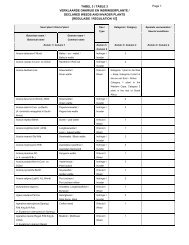
Table 1: Treatments applied to Tzaneen region during August 2004, June 2005 and June 2006.<br />
Site No. of replicates Treatments applied<br />
Cleared before 3 Control (no clearing)<br />
Cleared before 3 Hand pulling<br />
Cleared before 3 Hand pulling and stack<br />
Cleared before 3 Foliar spray with GARLON<br />
Cleared before 3 Cut & treat stem with GARLON<br />
Cleared before 3 Cut & treat stem with GARLON and stack<br />
Cleared before 3 Foliar spray with ROUNDUP<br />
Cleared before 3 Cut & treat stem with ROUNDUP<br />
Uncleared before 4 Control (no clearing)<br />
Uncleared before 4 Cut & treat stem with CHOPPER<br />
Uncleared before 4 Cut & treat stem with CHOPPER and stack<br />
A further 1 m radius circular plot was resampled from each 4 m radius circular plot using the centre as<br />
the reference point. Within the 1 m radius subplot, the grass cover was estimated and each plant was<br />
identified, its density and average height measured. The density of C. odorata within this small plot was<br />
also counted.<br />
Appendix 2