Structural Grading of Foveal Hypoplasia Using Spectral-Domain ...
Structural Grading of Foveal Hypoplasia Using Spectral-Domain ...
Structural Grading of Foveal Hypoplasia Using Spectral-Domain ...

You also want an ePaper? Increase the reach of your titles
YUMPU automatically turns print PDFs into web optimized ePapers that Google loves.
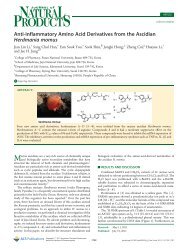
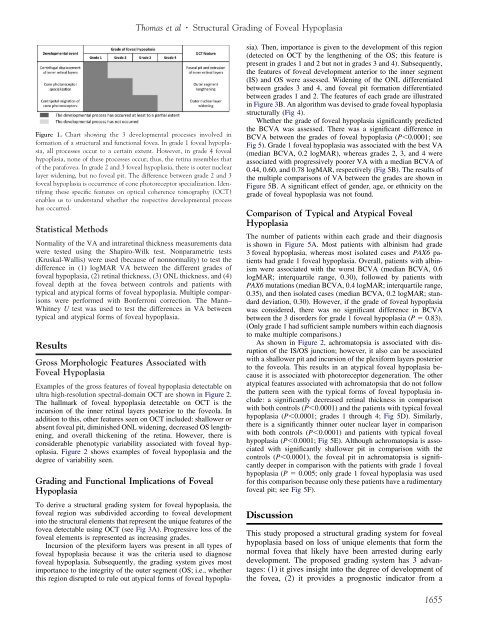
Figure 1. Chart showing the 3 developmental processes involved in<br />
formation <strong>of</strong> a structural and functional fovea. In grade 1 foveal hypoplasia,<br />
all processes occur to a certain extent. However, in grade 4 foveal<br />
hypoplasia, none <strong>of</strong> these processes occur; thus, the retina resembles that<br />
<strong>of</strong> the parafovea. In grade 2 and 3 foveal hypoplasia, there is outer nuclear<br />
layer widening, but no foveal pit. The difference between grade 2 and 3<br />
foveal hypoplasia is occurrence <strong>of</strong> cone photoreceptor specialization. Identifying<br />
these specific features on optical coherence tomography (OCT)<br />
enables us to understand whether the respective developmental process<br />
has occurred.<br />
Statistical Methods<br />
Normality <strong>of</strong> the VA and intraretinal thickness measurements data<br />
were tested using the Shapiro-Wilk test. Nonparametric tests<br />
(Kruskal-Wallis) were used (because <strong>of</strong> nonnormality) to test the<br />
difference in (1) logMAR VA between the different grades <strong>of</strong><br />
foveal hypoplasia, (2) retinal thickness, (3) ONL thickness, and (4)<br />
foveal depth at the fovea between controls and patients with<br />
typical and atypical forms <strong>of</strong> foveal hypoplasia. Multiple comparisons<br />
were performed with Bonferroni correction. The Mann–<br />
Whitney U test was used to test the differences in VA between<br />
typical and atypical forms <strong>of</strong> foveal hypoplasia.<br />
Results<br />
Gross Morphologic Features Associated with<br />
<strong>Foveal</strong> <strong>Hypoplasia</strong><br />
Examples <strong>of</strong> the gross features <strong>of</strong> foveal hypoplasia detectable on<br />
ultra high-resolution spectral-domain OCT are shown in Figure 2.<br />
The hallmark <strong>of</strong> foveal hypoplasia detectable on OCT is the<br />
incursion <strong>of</strong> the inner retinal layers posterior to the foveola. In<br />
addition to this, other features seen on OCT included: shallower or<br />
absent foveal pit, diminished ONL widening, decreased OS lengthening,<br />
and overall thickening <strong>of</strong> the retina. However, there is<br />
considerable phenotypic variability associated with foveal hypoplasia.<br />
Figure 2 shows examples <strong>of</strong> foveal hypoplasia and the<br />
degree <strong>of</strong> variability seen.<br />
<strong>Grading</strong> and Functional Implications <strong>of</strong> <strong>Foveal</strong><br />
<strong>Hypoplasia</strong><br />
To derive a structural grading system for foveal hypoplasia, the<br />
foveal region was subdivided according to foveal development<br />
into the structural elements that represent the unique features <strong>of</strong> the<br />
fovea detectable using OCT (see Fig 3A). Progressive loss <strong>of</strong> the<br />
foveal elements is represented as increasing grades.<br />
Incursion <strong>of</strong> the plexiform layers was present in all types <strong>of</strong><br />
foveal hypoplasia because it was the criteria used to diagnose<br />
foveal hypoplasia. Subsequently, the grading system gives most<br />
importance to the integrity <strong>of</strong> the outer segment (OS; i.e., whether<br />
this region disrupted to rule out atypical forms <strong>of</strong> foveal hypopla-<br />
Thomas et al <strong>Structural</strong> <strong>Grading</strong> <strong>of</strong> <strong>Foveal</strong> <strong>Hypoplasia</strong><br />
sia). Then, importance is given to the development <strong>of</strong> this region<br />
(detected on OCT by the lengthening <strong>of</strong> the OS; this feature is<br />
present in grades 1 and 2 but not in grades 3 and 4). Subsequently,<br />
the features <strong>of</strong> foveal development anterior to the inner segment<br />
(IS) and OS were assessed. Widening <strong>of</strong> the ONL differentiated<br />
between grades 3 and 4, and foveal pit formation differentiated<br />
between grades 1 and 2. The features <strong>of</strong> each grade are illustrated<br />
in Figure 3B. An algorithm was devised to grade foveal hypoplasia<br />
structurally (Fig 4).<br />
Whether the grade <strong>of</strong> foveal hypoplasia significantly predicted<br />
the BCVA was assessed. There was a significant difference in<br />
BCVA between the grades <strong>of</strong> foveal hypoplasia (P0.0001; see<br />
Fig 5). Grade 1 foveal hypoplasia was associated with the best VA<br />
(median BCVA, 0.2 logMAR), whereas grades 2, 3, and 4 were<br />
associated with progressively poorer VA with a median BCVA <strong>of</strong><br />
0.44, 0.60, and 0.78 logMAR, respectively (Fig 5B). The results <strong>of</strong><br />
the multiple comparisons <strong>of</strong> VA between the grades are shown in<br />
Figure 5B. A significant effect <strong>of</strong> gender, age, or ethnicity on the<br />
grade <strong>of</strong> foveal hypoplasia was not found.<br />
Comparison <strong>of</strong> Typical and Atypical <strong>Foveal</strong><br />
<strong>Hypoplasia</strong><br />
The number <strong>of</strong> patients within each grade and their diagnosis<br />
is shown in Figure 5A. Most patients with albinism had grade<br />
3 foveal hypoplasia, whereas most isolated cases and PAX6 patients<br />
had grade 1 foveal hypoplasia. Overall, patients with albinism<br />
were associated with the worst BCVA (median BCVA, 0.6<br />
logMAR; interquartile range, 0.30), followed by patients with<br />
PAX6 mutations (median BCVA, 0.4 logMAR; interquartile range,<br />
0.35), and then isolated cases (median BCVA, 0.2 logMAR; standard<br />
deviation, 0.30). However, if the grade <strong>of</strong> foveal hypoplasia<br />
was considered, there was no significant difference in BCVA<br />
between the 3 disorders for grade 1 foveal hypoplasia (P 0.83).<br />
(Only grade 1 had sufficient sample numbers within each diagnosis<br />
to make multiple comparisons.)<br />
As shown in Figure 2, achromatopsia is associated with disruption<br />
<strong>of</strong> the IS/OS junction; however, it also can be associated<br />
with a shallower pit and incursion <strong>of</strong> the plexiform layers posterior<br />
to the foveola. This results in an atypical foveal hypoplasia because<br />
it is associated with photoreceptor degeneration. The other<br />
atypical features associated with achromatopsia that do not follow<br />
the pattern seen with the typical forms <strong>of</strong> foveal hypoplasia include:<br />
a significantly decreased retinal thickness in comparison<br />
with both controls (P0.0001) and the patients with typical foveal<br />
hypoplasia (P0.0001; grades 1 through 4; Fig 5D). Similarly,<br />
there is a significantly thinner outer nuclear layer in comparison<br />
with both controls (P0.0001) and patients with typical foveal<br />
hypoplasia (P0.0001; Fig 5E). Although achromatopsia is associated<br />
with significantly shallower pit in comparison with the<br />
controls (P0.0001), the foveal pit in achromatopsia is significantly<br />
deeper in comparison with the patients with grade 1 foveal<br />
hypoplasia (P 0.005; only grade 1 foveal hypoplasia was used<br />
for this comparison because only these patients have a rudimentary<br />
foveal pit; see Fig 5F).<br />
Discussion<br />
This study proposed a structural grading system for foveal<br />
hypoplasia based on loss <strong>of</strong> unique elements that form the<br />
normal fovea that likely have been arrested during early<br />
development. The proposed grading system has 3 advantages:<br />
(1) it gives insight into the degree <strong>of</strong> development <strong>of</strong><br />
the fovea, (2) it provides a prognostic indicator from a<br />
1655