Structural Grading of Foveal Hypoplasia Using Spectral-Domain ...
Structural Grading of Foveal Hypoplasia Using Spectral-Domain ...
Structural Grading of Foveal Hypoplasia Using Spectral-Domain ...

You also want an ePaper? Increase the reach of your titles
YUMPU automatically turns print PDFs into web optimized ePapers that Google loves.
controls and incursion <strong>of</strong> the inner retinal layers. This suggests<br />
that the centrifugal displacement <strong>of</strong> the inner retinal<br />
layers is not complete in some patients with achromatopsia.<br />
In summary, a structural grading system for foveal hypoplasia<br />
that relates to developmental stages and visual prognosis<br />
and that can be applied to most disorders associated<br />
with foveal hypoplasia was developed. Atypical forms <strong>of</strong><br />
Thomas et al <strong>Structural</strong> <strong>Grading</strong> <strong>of</strong> <strong>Foveal</strong> <strong>Hypoplasia</strong><br />
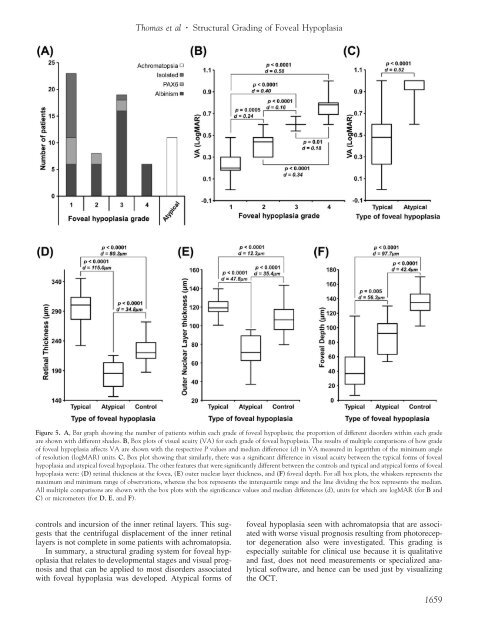
Figure 5. A, Bar graph showing the number <strong>of</strong> patients within each grade <strong>of</strong> foveal hypoplasia; the proportion <strong>of</strong> different disorders within each grade<br />
are shown with different shades. B, Box plots <strong>of</strong> visual acuity (VA) for each grade <strong>of</strong> foveal hypoplasia. The results <strong>of</strong> multiple comparisons <strong>of</strong> how grade<br />
<strong>of</strong> foveal hypoplasia affects VA are shown with the respective P values and median difference (d) in VA measured in logarithm <strong>of</strong> the minimum angle<br />
<strong>of</strong> resolution (logMAR) units. C, Box plot showing that similarly, there was a significant difference in visual acuity between the typical forms <strong>of</strong> foveal<br />
hypoplasia and atypical foveal hypoplasia. The other features that were significantly different between the controls and typical and atypical forms <strong>of</strong> foveal<br />
hypoplasia were: (D) retinal thickness at the fovea, (E) outer nuclear layer thickness, and (F) foveal depth. For all box plots, the whiskers represents the<br />
maximum and minimum range <strong>of</strong> observations, whereas the box represents the interquartile range and the line dividing the box represents the median.<br />
All multiple comparisons are shown with the box plots with the significance values and median differences (d), units for which are logMAR (for B and<br />
C) or micrometers (for D, E, and F).<br />
foveal hypoplasia seen with achromatopsia that are associated<br />
with worse visual prognosis resulting from photoreceptor<br />
degeneration also were investigated. This grading is<br />
especially suitable for clinical use because it is qualitative<br />
and fast, does not need measurements or specialized analytical<br />
s<strong>of</strong>tware, and hence can be used just by visualizing<br />
the OCT.<br />
1659