CHAPTER II MATERIALS AND METHODS 2.1 Chemicals and ...
CHAPTER II MATERIALS AND METHODS 2.1 Chemicals and ...
CHAPTER II MATERIALS AND METHODS 2.1 Chemicals and ...

Create successful ePaper yourself
Turn your PDF publications into a flip-book with our unique Google optimized e-Paper software.
<strong>2.1</strong> <strong>Chemicals</strong> <strong>and</strong> materials<br />
<strong>CHAPTER</strong> <strong>II</strong><br />
<strong>MATERIALS</strong> <strong>AND</strong> <strong>METHODS</strong><br />
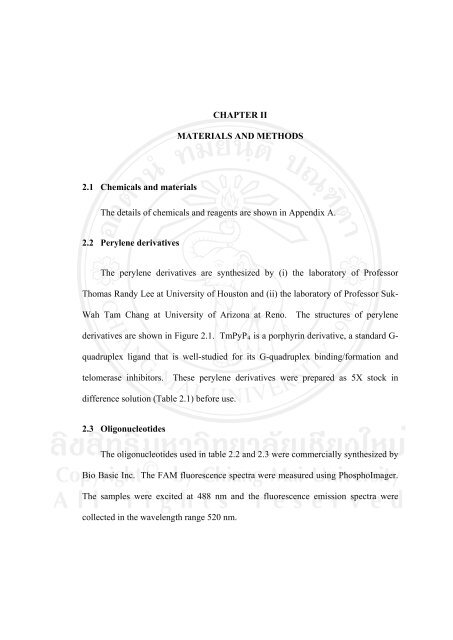
The details of chemicals <strong>and</strong> reagents are shown in Appendix A.<br />
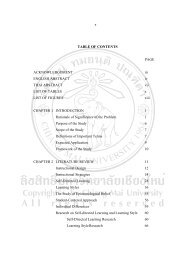
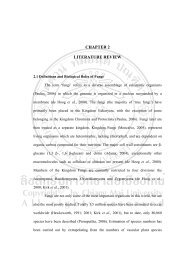
2.2 Perylene derivatives<br />
The perylene derivatives are synthesized by (i) the laboratory of Professor<br />
Thomas R<strong>and</strong>y Lee at University of Houston <strong>and</strong> (ii) the laboratory of Professor Suk-<br />
Wah Tam Chang at University of Arizona at Reno. The structures of perylene<br />
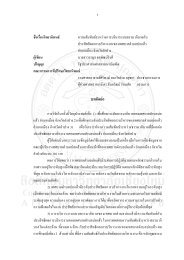
derivatives are shown in Figure <strong>2.1</strong>. TmPyP4 is a porphyrin derivative, a st<strong>and</strong>ard G-<br />
quadruplex lig<strong>and</strong> that is well-studied for its G-quadruplex binding/formation <strong>and</strong><br />
telomerase inhibitors. These perylene derivatives were prepared as 5X stock in<br />
difference solution (Table <strong>2.1</strong>) before use.<br />
2.3 Oligonucleotides<br />
The oligonucleotides used in table 2.2 <strong>and</strong> 2.3 were commercially synthesized by<br />
Bio Basic Inc. The FAM fluorescence spectra were measured using PhosphoImager.<br />
The samples were excited at 488 nm <strong>and</strong> the fluorescence emission spectra were<br />
collected in the wavelength range 520 nm.
N N<br />
N N<br />
H<br />
H<br />
N<br />
N<br />
N N<br />
TmPyP 4<br />
N<br />
O<br />
N<br />
N<br />
PM3<br />
O<br />
O<br />
N<br />
O O<br />
N<br />
Figure <strong>2.1</strong> Structures of perylene derivatives used in this study <strong>and</strong> TmPyP4.<br />
Perylene Derivative<br />
N<br />
23<br />
PIPER<br />
Table <strong>2.1</strong> Solubility Profiles of Perylene Derivatives.<br />
Solubility<br />
PM 1 Water, Methanol<br />
PM 2 Diluted acid, chloroform<br />
PM 3 10 mM Tris-HCl pH 7<br />
PIPER 1N HCl 10% H20<br />
TmPyP Water<br />
4<br />
O<br />
N<br />
N<br />
N N<br />
O O<br />
N<br />
O<br />
NN<br />
OO<br />
N<br />
PM2<br />
O<br />
N<br />
O<br />
PM1<br />
N<br />
NH
Name<br />
24<br />
Table 2.2: Sequences of oligonucleotide <strong>and</strong> their specific assay.<br />
2.4 Non-denaturing gel electrophoresis<br />
Non-denaturing gel electrophoresis was employed to separate DNA samples in<br />
their native states. In this study, various forms of DNA structures such as duplex,<br />
single str<strong>and</strong>, <strong>and</strong> G-quadruplexes were separated from each other when they<br />
migrated through polyacrylamide gel. To maintain the native forms of DNA sample,<br />
the electrophoresis was run at 4 o C <strong>and</strong> electrophoresis buffer <strong>and</strong> gel were<br />
supplemented with KCl.<br />
Polyacrylamide gel was prepared by mixing 40% acrylamide/bis-<br />
acrylamide (19:1) with 5X TBE buffer, 4M KCl, <strong>and</strong> the distilled water to the desired<br />
percentage of gel <strong>and</strong> the final concentration of 50 mM KCl in the gel. For 80 ml gel,<br />
the gel polymerization was started by adding 1000 µl of 10% ammonium persulfate<br />
<strong>and</strong> 35 µl of TEMED (N, N, N' , N' -tetramethylethylenediamine) before pouring to<br />
the gel mold.<br />
Sequences Assay<br />
VT-66 5’- GCCTGTCCCC GCCCCCCGGG GCGGGCCGGG<br />
GGCGGGGTCC<br />
CTTCCCGAGC CATGCGCCAC CTCCTT -3’<br />
P16 5’- FAM-AAGGAGGTGGCGCATG -3’<br />
DNA polymerase<br />
stop assay<br />
32G4 5’- FAM-AGTATAGGGG CGGGCCGGGG GCGGGGTTAG TA -3’ Duplex/Quadruplex<br />
32C4 5’- TACTAACCCCGCCCCCGGCCCGCCCCTATACT -3’<br />
competition assay
25<br />
The samples were mixed with 6X non-denaturing loading dye buffer. Before<br />
sample loading, the gel was pre-run at 350 votes for 30 min at 4 o C in 1X TBE buffer<br />
supplemented with 50mM KCl. Each well was washed again <strong>and</strong> 10 µl of each<br />
sample was loaded. After all samples were loaded, the gel was run at 350 votes at<br />
4 o C until the dye front traveled about 10 cm from the wells. Then, the power supply<br />
was shut off <strong>and</strong> the glass wash, ready for fluorescence detection.<br />
2.5 Denaturing gel electrophoresis<br />
Denaturing gel electrophoresis was employed to separate DNA by length. In this<br />
study, we employed this technique to separate the DNA products from DNA<br />
polymerase stop assay.<br />
The gel mold was prepared as described. The denaturing gel was mixing 40%<br />
acrylamide/bis-acrylamide (19:1), urea, 5X TBE buffer, <strong>and</strong> the water to the desired<br />
percentage of gel <strong>and</strong> the final concentration of 8 M urea. For 80 ml gel, the gel<br />
polymerization was started by adding 1ml of 10% ammonium persulfate <strong>and</strong> 35 µl of<br />
TEMED before pouring to the gel mold. When polymerization was complete, the gel<br />
plate was assembled to electrophoresis unit. The gel slots were washed <strong>and</strong> the gel<br />
was pre-run at constant power 1800-2000 voltage for 1 hour. Once again, slots were<br />
washed to eliminate the accumulated urea. Before sample loading, the sample in<br />
formamide loading buffer were heated at 95 O C for 5 min <strong>and</strong> immediately placed on<br />
ice, to denature any secondary structure. Samples were then loaded onto the gel <strong>and</strong><br />
electrophoresis in a 1X TBE running buffer at 1800 volts for 2 hours. The gel was<br />
separated from the glass plates <strong>and</strong> transferred onto a plastic covered, ready to detect<br />
fluorescence b<strong>and</strong>s.
2.6 DNA polymerase stop assay<br />
26<br />
DNA polymerase stop assay is often employed to test whether a compound can<br />
induce intramolecular G-quadruplex formation from any particular G-quadruplex<br />
motif. The assay is based on the principle that DNA polymerase cannot traverse<br />
through an intramolecular G-quadruplex structure; therefore, primer extension by<br />
DNA polymerase will arrest when DNA polymerase encounters a stable G-<br />
quadruplex on the DNA template. The 10 l G-quadruplex forming mixture,<br />
consisting of the indicated concentration of test compound, a DNA template (VT-66,<br />
100 nM), <strong>and</strong> a FAM-labeled primer (P16, 100 nM) in 10 mM Tris-HCl buffer (pH<br />
7.4) containing 25 mM KCl, was first denatured by heating to 95 C for 5 min, then<br />
slowly cooled to 37 C, <strong>and</strong> held at 37 C for 30 min. The primer extension reaction<br />
was initiated by adding a 10 l reaction mixture consisting of 100 mM dNTPs, 3 mM<br />
MgCl2,<br />
<strong>and</strong> 1 unit of DNA polymerase I Klenow fragment (Fermentas). The reaction<br />
was allowed to proceed at 37 C for 30 min before it was stopped by adding 4 l of<br />
loading buffer (95% formamide, 10 mM EDTA, 0.1% xylene cyanol, 0.1%<br />
bromphenol blue). The samples were separated by electrophoresis in a 12%<br />
denaturing polyacrylamide gel <strong>and</strong> visualized with a phosphoimaging system<br />
(Typhoon; Molecular Dynamics).<br />
2.7 Duplex/quadruplex competition Assay<br />
Many G-quadruplex lig<strong>and</strong>s are not useful as telomerase inhibitor because they<br />
induce acute cytotoxicity, which is believed to occur from non-specific binding to<br />
double str<strong>and</strong>ed DNA. To investigate the binding preference of our perylene<br />
derivatives, we employed the duplex/quadruplex competition assay. If the compound
27<br />
prefers binding to G-quadruplex, there will be less duplex. On the other h<strong>and</strong>, if the<br />
compound prefers binding to duplex, there will be less G-quadruplex formation. In<br />
this study, we observed the competition between duplex <strong>and</strong> quadruplex from the<br />
fluorescent-labeled G-rich str<strong>and</strong>.<br />
The 20-µl reaction mixture contained 2µM of fluorescent-labeled G-str<strong>and</strong>, 10<br />
mM of Tris-HCl buffer pH 7.4 containing 100 mM KCl, <strong>and</strong> 0-32 µM of perylene<br />
derivative. The reaction mixtures were heated at 95 O C for 10 min before incubated at<br />
55 O C for 10 h. The incubation was terminated by rapidly cooling down to 4 O C. The<br />
sample were added with 6X glycerol loading dye buffer <strong>and</strong> kept at 4 O C before<br />
loading into non-denaturing gel. The 10 µl of each sample was loaded on 16% non-<br />
denaturing polyacrylamide gel containing 50 mM KCl. The gel was run in 1X TBE<br />
buffer supplemented with 50 mM KCl at 4 O C, 350 volts for 10 h. Gel was then<br />
exposed to fluorescence spectrum by PhosphoImager.<br />
2.8 Cell lines <strong>and</strong> culture conditions<br />
The human lung carcinoma cell line A549 was obtained from American Type<br />
Culture Collection (Rockville, MD). The A549 cells were grown in Roswell Park<br />
Memorial Institute medium 1640 (RPMI 1640) with 10% fetal bovine serum (FBS)<br />
<strong>and</strong> 1% antibiotics (50 units/ml penicillin, 50 µg/ml streptomycin). The A549 cells<br />
were grown as monolayers at 37 2 <strong>and</strong> 95%<br />
air.
2.9 Cytotoxicity test<br />
28<br />
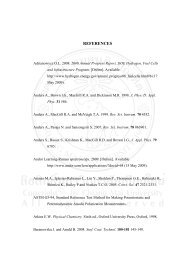
Cell survival is determined by using the colorimetric Sulforhodamine B assay.<br />
The assay relies on the ability of Sulforhodamine B to bind to protein components of<br />
cells that have been fixed to tissue-culture plates by trichloroacetic acid (TCA).<br />
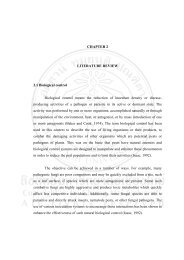
Sulforhodamine B is bright-pink aminoxanthane dye with two sulfonic groups (Figure<br />
2.2) that bind to basic amino-acid residues under mild acidic conditions, <strong>and</strong><br />
dissociate under basic conditions. As the binding of Sulforhodamine B is<br />
stoichimetric, the amount of dye extracted from stained cells is directly proportional<br />
to the cell mass (Vichai <strong>and</strong> Kirtikara, 2006).<br />
Figure 2.2 Structure of Sulforhodamine B
2.9.1 Cell preparation<br />
29<br />
After removing medium, the cells were washed with sterilized phosphate-<br />
buffered saline (PBS), <strong>and</strong> then trypsinised with 0.25% (wt/vol) trypsin in versene-<br />
EDTA to evenly cover the cell-growth surface. When the cells were started to<br />
dissociate, a sterilized plastic or glass pipette was used to disperse them from the<br />
culture surface with culture medium containing FBS <strong>and</strong> mix to obtain a<br />
homogeneous cell suspension. After transferring the cell suspension to a sterilized<br />
tube, the cells were centrifuged at 3,000 rpm for 5 min. The cell concentration was<br />
determined by counting in a hematocytometer chamber under a microscope, using a<br />
1:1 mixture of cell suspension <strong>and</strong> 0.4% (wt. /vol.) trypan blue solution <strong>and</strong> calculates<br />
by using the formulae below:<br />
Number of cells (cells/µl) = N x Cv x Cd<br />
2.9.2 Sulforhodamine B assay protocol<br />
N = number of cells<br />
Cv = correction factor of volume (10 4<br />
)<br />
Cd = correction factor of dilution (x 2)<br />
The growth inhibition of A549 cells was determined using the Sulforhodamine B<br />
(SRB) assay according to a published protocol (Vichai V & Kirtikara, 2006). Briefly,<br />
after adjusted the cell concentration with growth medium to obtain seeding density at<br />
4<br />
1.0 x 10 cells/well, the cell suspensions were seeded in 96-well tissue-culture plates<br />
which pre-added with a various concentration (0-16 µM) of the test sample. The cell<br />
suspensions were occasionally mixed during plating to ensure an even distribution of<br />
the cells. The cells were allowed to attach for 2-3 h at 37 C in a humidified incubator
30<br />
with 5% CO2. The first plate, as no-growth control (day 0), was proceeded to fix the<br />
cell monolayer, whereas the remaining plates were incubated at 37 C in a humidified<br />
incubator with 5% CO2 for 72 h. At the end of each treatment, the cells were fixed by<br />
gentle addition of 100 µl of cold 10% (wt /vol.) trichloroacetic acid (TCA) to each<br />
well, followed by incubation at 4 C for 1 h. Plates were washed four times with<br />
deionized water <strong>and</strong> removed excess water using paper towels. Then, the plates were<br />
left air dry at room temperature (20-25 C). Cells were stained with 100 µl of SRB<br />
solution (0.057% SRB wt/vol in 1% acetic acid) added to each well for 30 min at<br />
room temperature, then quickly rinse the plates four times with 1%(vol /vol) acetic<br />
acid to remove unbound dye <strong>and</strong> allowed them to dry at room temperature. Next,<br />
bound dye was solubilized with 10 mM Tris base solution (pH 10.5). The optical<br />
density (OD.) was read at 510 nm using fluorescence plate reader (Biotech K40). The<br />
absorbance values of treated samples were calculated as the percentage of cell-growth<br />
inhibition using the formula below:<br />
% of control cell growth = mean OD sample – mean OD day 0<br />
mean OD neg. control - mean OD day 0<br />
% growth inhibition = 100 - % of control cell growth<br />
x 100<br />
For IC50 determination, a dose-response curve between the compound<br />
concentration <strong>and</strong> percent growth inhibition was plotted. IC50 can be derived using<br />
curve-fitting methods with statistical analysis.
<strong>2.1</strong>0 Reverse transcriptase-polymerase chain reaction (RT-PCR)<br />
31<br />
Reverse transcriptase-polymerase chain reaction (RT-PCR) is used to amplify<br />
cDNA copies of RNA. RT-PCR generate large cDNA libraries from cellular mRNA.<br />
RT-PCR can be adapted to identify mutations <strong>and</strong> polymorphisms in transcribed<br />
sequences <strong>and</strong> to measure the strength of gene expression when the amounts of<br />
available mRNA are limited <strong>and</strong>/or when the RNA of the interest is expressed at very<br />
low levels.<br />
Principle of RT-PCR is relative simple. The first step is enzymatic conversion of<br />
RNA to a single-str<strong>and</strong>ed cDNA template. An oligodeoxynucleotide primer is<br />
hybridized to the mRNA <strong>and</strong> is then extended by an RNA-dependent DNA<br />
polymerase to create a cDNA copy that can be amplified by PCR. Depending on the<br />
purpose of the experiment, the primer for first-str<strong>and</strong> cDNA synthesis can be<br />
specifically designed to hybridize to a particular target gene or it can bind generally to<br />
all mRNAs. Amplification of the desired portion of cDNA can be achieved in PCRs<br />
primed by forward <strong>and</strong> reverse oligonucleotide primers corresponding to specific<br />
sequence in particular cDNAs. In this study, VEGF expression at the transcriptional<br />
level was analyzed using RT-PCR. In brief, the A549 human lung cancer cells were<br />
incubated with test sample for 24 h. Then, the total RNA was extracted using Trizol<br />
reagent. The mRNAs were converted to cDNAs by reverse transcriptase. The<br />
cDNAs of VEGF was amplified by PCR with specific primers shown in Table 2.3<br />
PCR products were separated by agarose gel electrophoresis. The parallel<br />
amplification of GAPDH cDNA was also conducted as a positive control <strong>and</strong> an<br />
internal st<strong>and</strong>ard.
32<br />
Table 2.3 Primer sequences for determining effect of perylene derivatives on VEGF<br />
expression in A549 cells by RT-PCR<br />
VEGF (F)<br />
VEGF (R)<br />
GAPDH (F)<br />
GAPDH (R)<br />
Name Primer Sequence Product Size (bp.)<br />
5’- TGCATTGGAGCCTTGCCTTG -3’<br />
5’- CGGCTCACCGCCTCGGCTTG -3’<br />
5’- CCACAGTCCATGCCATCAC -3’<br />
5’- CCACCACCCTGTTGCTGTA -3’<br />
<strong>2.1</strong>0.1 Treatment of A549 cells with a test sample<br />
540, 410<br />
A549 cells (2.0 x 10 5 cells) were incubated in 6-well tissue-culture plates<br />
containing growth medium. Cells were allowed to attach for 24 h, <strong>and</strong> washed with<br />
PBS, <strong>and</strong> then treated with each test compounds. The plate was incubated at 37 C in<br />
a humidified incubator with 5% CO2<br />
were extracted as described below.<br />
<strong>2.1</strong>0.2 RNA extraction<br />
Total RNA was extracted using Trizol reagent (Invitrogen), according to the<br />
manufacturer’s instruction. In Brief, the cell monolayers were directly lysed in a<br />
culture dish by adding 1 ml of TRIzol Reagent to a 3.5 cm diameter dish, <strong>and</strong> passed<br />
several times through a pipette. The cleared homogenate solutions were transferred to<br />
a fresh tube. The homogenized cells were incubated for 5 min at 15 to 30°C to permit<br />
the complete dissociation of nucleoprotein complexes <strong>and</strong> then added 0.2 ml of<br />
chloroform per 1 ml of TRIzol Reagent. The tubes were vigorously shaken for 15<br />
452<br />
for 24 h. At the end of treatment, total RNA
33<br />
seconds <strong>and</strong> incubated at 15 to 30°C for 2 to 3 min. After centrifugation at 12,000×g<br />
for 15 min at 4°C, the mixture was separated into a lower red, phenol-chloroform<br />
phase, an inter-phase, <strong>and</strong> a colorless upper aqueous phase. RNA remained<br />
exclusively in the aqueous phase, which is about 60% of the volume of TRIzol<br />
Reagent used for homogenization. The aqueous phase was transferred to a fresh tube.<br />
The RNA was precipitated from the aqueous phase by mixing with isopropyl alcohol,<br />
incubated at 15 to 30°C for 10 min <strong>and</strong> centrifuged at 12,000×g for 10 min at 4°C.<br />
The RNA precipitate, often invisible before centrifugation, formed a gel-like pellet on<br />
the side <strong>and</strong> bottom of the tube. After removing the supernatant, the RNA pellet was<br />
washed once with 75% ethanol, mixed by vortexing <strong>and</strong> centrifuged at 7,500×g for 5<br />
min at 4°C. At the end of the procedure, the RNA pellet was dried by air-dry or for 5-<br />
10 min <strong>and</strong> then dissolved in DEPC-treated water. The quantity <strong>and</strong> quality of total<br />
RNA were assessed by the ratio of A260 /A280.<br />
The concentration of RNA was determined by UV-Visible spectrophotometer.<br />
An OD of 1 at the wavelength of 260 nm corresponds to approximately 40 µg/ml for<br />
RNA. The obtained RNA was diluted 50 times in DEPC-treated water before<br />
measuring. The concentration of RNA was calculated by using the formula below:<br />
Concentration of RNA (µg/ml) = OD260 x 40 x dilution factor<br />
The quality of the RNA is essential to overall success of the analysis. OD260 is<br />
frequently used to measure RNA concentration <strong>and</strong> OD280 is used to measure protein<br />
concentration. For further analysis it is imperative that the RNA extracted should<br />
have high purity, displaying ratio of OD260/OD280 values between 1.7 <strong>and</strong> 1.9.<br />
Smaller ratio usually indicates contamination of protein or organic chemicals.
34<br />
<strong>2.1</strong>0.3 cDNA synthesis by reverse transcription<br />
Total RNA prepared in step <strong>2.1</strong>0.2 was primed with oligo-(dT)18 primer to<br />
synthesize first-str<strong>and</strong>ed complementary DNA using AMV reverse transcriptase<br />
(Fermentus), according to the manufacturer’s instructions. Briefly, The 20 µl reaction<br />
mixture contained 1 µg of extracted RNA, 0.5 µg of oligo-(dT)18, 1 mM dNTPs, 20<br />
unit of ribonuclease inhibitor, 200 units of reverse transcriptase, <strong>and</strong> adjusted volume<br />
to 20 µl with DEPC-treated water. The reaction mixture were incubated at94 o C for 5<br />
min, 42 o C for 1 h <strong>and</strong> then at 70 o<br />
C for 10 min. The extracted RNA was converted to<br />
cDNA in these processes.<br />
<strong>2.1</strong>0.4 PCR optimization<br />
The PCR condition of interested genes (VEGF <strong>and</strong> GAPDH) was optimized to<br />
yield the amplified products without any nonspecific byproduct. The annealing<br />
temperature was varied within the range from 58using a fixed number of<br />
PCR cycle at 30. Next, the optimum PCR cycle was analyzed by various of numbers<br />
PCR cycle from 15 to 33 cycles that could give the proportional PCR product relative<br />
to its original cDNA. The chosen PCR condition, the annealing temperature <strong>and</strong> the<br />
number of PCR cycle, was confirmed by 2-fold dilution series of cDNA template: 1x,<br />
0.5x, 0.25x, <strong>and</strong> 0.125x.<br />
The procedures <strong>and</strong> optimized protocols are as follows: The 10 µl reaction<br />
mixture contained 1.0 µg of cDNA, 1X buffer (10 mM Tris-HCl pH 9.0, 50 mM KCl<br />
<strong>and</strong>, 2.0 mM MgCl2),<br />
0.2 mM dNTPs, 2 units of Taq polymerase, <strong>and</strong> 0.2 µM of<br />
primers. Each reaction mixture was then placed on a Mastercycler gradient thermal<br />
cycler. The temperature profile was as follows: initial denaturation at 95 C for 5
35<br />
min, followed by the amplification process, which are denaturation at 95 C for 30<br />
sec, annealing at optimal temperature of each gene for 30 sec <strong>and</strong> extension at 72 C<br />
for 40 sec, <strong>and</strong> the final extension step at 72 C for 5 min. The optimized conditions<br />
resulted in the efficient amplification of DNA without non-specific amplified<br />
products.<br />
<strong>2.1</strong>0.5 Agarose gel electrophoresis <strong>and</strong> analysis of PCR product<br />
After amplification, 10 µl from each sample was electrophoretically separated<br />
on a 2 % (wt/vol) agarose gel <strong>and</strong> stained with ethidium bromide (EtBr, Vivantis).<br />
The DNA b<strong>and</strong>s were visualized by UV illumination <strong>and</strong> documented by using a Bio-<br />
Rad gel doc 1000 system. The intensity of b<strong>and</strong> was quantified by Quantity One<br />
Software (Bio-Rad). The st<strong>and</strong>ard 100-base pairs DNA ladder was used as molecular<br />
weight marker. The results are expressed as the percentage of gene expression. The<br />
expression was calculated by using the formulae below:<br />
% Gene expression = Mean b<strong>and</strong> intensity of interested gene x 100<br />
<strong>2.1</strong>1 Western blot analysis<br />
Mean b<strong>and</strong> intensity of GAPDH<br />
The Western blot analysis is an analytical technique used to detect specific<br />
proteins in a given sample of tissue homogenate or cell extract. It uses gel<br />
electrophoresis to separate denatured proteins by the size of the polypeptides. The<br />
proteins are then transferred to a membrane, where they are probed using an antibody<br />
specific to the target protein.
36<br />
<strong>2.1</strong>1.1 Preparation of total cell lysis protein<br />
A549 cells (2.0 x 10 5 cells) were seeded in each 6 well plates, <strong>and</strong> exposed to a<br />
test sample of various concentrations at 37 2 incubator for 24 h. The<br />
cells were collected <strong>and</strong> the pellet was lysed with 200 µl of ice-cold lysis buffer (10<br />
mM Tris-HCl pH 7.5, 1 mM MgCl2, 1 mM EGTA, 0.5% CHAPS, 10% vol/vol<br />
-2-mercaptoethanol) <strong>and</strong> incubated on ice for 30 minutes. The<br />
pellet was then centrifuged at 12,000 x g at 4 was<br />
quantified for protein using a Bio-Rad Protein Assay (Bio-Rad).<br />
<strong>2.1</strong>1.2 Protein determination<br />
The protein concentration of cell pellets was quantified by the Bio-Rad Protein<br />
Assay (Bio-Rad). When Coomassie dye in the protein assay kit binds to proteins in<br />
acidic medium, there is an immediate shift in absorption maximum occurs from 465<br />
nm to 595 nm with a concomitant color change from brown to blue. Protein<br />
concentrations are estimated by reference to absorbance obtained for a series of<br />
st<strong>and</strong>ard protein dilutions, which are assayed alongside the unknown samples.<br />
as follows:<br />
The procedure of protein determination by Bio-Rad protein assay reagent is<br />
1. Bovine serum albumin (BSA) st<strong>and</strong>ard solution in various concentrations<br />
(187.5 – 500 µg/ml) was prepared from stock BSA (2,000 µg/ml).<br />
2. Pipette each st<strong>and</strong>ard <strong>and</strong> sample into the appropriate microplate wells.<br />
3. Add 250 µl of Bradford reagent to each well <strong>and</strong> mix.<br />
4. Measure the absorbance at 620 nm with a microplate reader.
37<br />
5. Subtract the average 620 nm reading for the blank replicate from the 620nm<br />
reading of all other individual st<strong>and</strong>ard <strong>and</strong> sample replicates.<br />
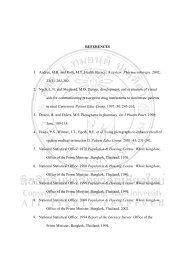
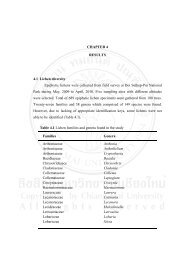
6. Prepare a st<strong>and</strong>ard curve (Figure 2.3) by plotting the average blank corrected<br />
620 nm reading for each BSA st<strong>and</strong>ard vs. its concentration in µg/ml. Use<br />
the st<strong>and</strong>ard curve to determine the protein concentration of each sample.<br />
Figure 2.3 The st<strong>and</strong>ard curve of bovine serum albumin (BSA)<br />
<strong>2.1</strong>1.3 SDS polyacrylamide gel electrophoresis (SDS-PAGE) <strong>and</strong> Western<br />
blotting<br />
BSA BS B A concentration (µg/ml) (µg/ g/ g ml)<br />
Proteins from each sample were separated by SDS-PAGE. Sodium dodecyl<br />
sulfate (SDS) binds to each polypeptide evenly throughout the polypeptide chain <strong>and</strong><br />
makes the charge/mass ratio of all the polypeptides in the mixture close to each other;<br />
therefore, the polypeptides can be separated according to their molecular weight
38<br />
through polyacrylamide gel. Smaller proteins migrate faster through this mesh <strong>and</strong><br />
the proteins are thus separated according to size.<br />
The cells were treated in the same manner as in the RT-PCR analysis. After<br />
treatment, the cells were lysed in ice-cold lysis buffer (10 mM Tris-HCl, pH 7.5, 1<br />
mM MgCl2, 1 mM EGTA, 0.5% CHAPS, 10% glycerol, <strong>and</strong> 5 mM mercaptoethanol).<br />
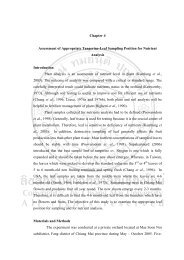
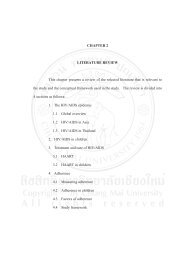
The protein (30 µg) from the cell lysates was separated by 8% SDS-polyacrylamide<br />
gel electrophoresis <strong>and</strong> was transferred onto a nitrocellulose membrane by<br />
electroblotting. The membrane was probed with the indicated primary antibody.<br />
Following incubation with enzyme-linked secondary antibody, signal was detected by<br />
enhanced chemiluminescence (Thermo Scientific) <strong>and</strong> captured on Kodak X-ray film<br />
(Figure 2.4).<br />
Figure 2.4 The schematic of SDS-PAGE <strong>and</strong> Western blot.
<strong>2.1</strong>2 Statistical analysis<br />
39<br />
All values are given as mean ± st<strong>and</strong>ard derivation (m ± SD) from triplicate<br />
samples of three independent experiments. The analysis of variance (One-Way<br />
ANOVA) with SPSS 14.0 software package was used to compare treated <strong>and</strong> control<br />
group. Differences were considered statistically significant when p < 0.05 or p <<br />
0.01.