CHAPTER II MATERIALS AND METHODS 2.1 Chemicals and ...
CHAPTER II MATERIALS AND METHODS 2.1 Chemicals and ...
CHAPTER II MATERIALS AND METHODS 2.1 Chemicals and ...

Create successful ePaper yourself
Turn your PDF publications into a flip-book with our unique Google optimized e-Paper software.
37<br />
5. Subtract the average 620 nm reading for the blank replicate from the 620nm<br />
reading of all other individual st<strong>and</strong>ard <strong>and</strong> sample replicates.<br />
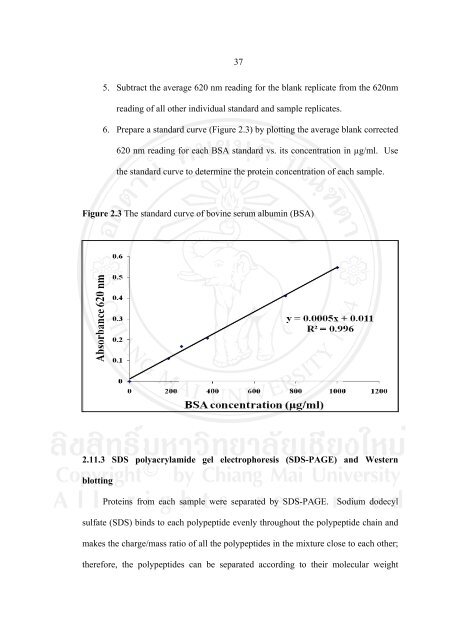
6. Prepare a st<strong>and</strong>ard curve (Figure 2.3) by plotting the average blank corrected<br />
620 nm reading for each BSA st<strong>and</strong>ard vs. its concentration in µg/ml. Use<br />
the st<strong>and</strong>ard curve to determine the protein concentration of each sample.<br />
Figure 2.3 The st<strong>and</strong>ard curve of bovine serum albumin (BSA)<br />
<strong>2.1</strong>1.3 SDS polyacrylamide gel electrophoresis (SDS-PAGE) <strong>and</strong> Western<br />
blotting<br />
BSA BS B A concentration (µg/ml) (µg/ g/ g ml)<br />
Proteins from each sample were separated by SDS-PAGE. Sodium dodecyl<br />
sulfate (SDS) binds to each polypeptide evenly throughout the polypeptide chain <strong>and</strong><br />
makes the charge/mass ratio of all the polypeptides in the mixture close to each other;<br />
therefore, the polypeptides can be separated according to their molecular weight