Wind Hazard Risk Assessment and Management for Structures
Wind Hazard Risk Assessment and Management for Structures
Wind Hazard Risk Assessment and Management for Structures
Create successful ePaper yourself
Turn your PDF publications into a flip-book with our unique Google optimized e-Paper software.
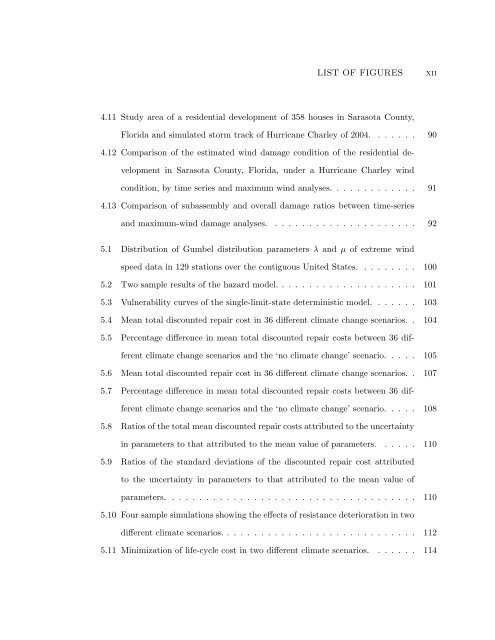
LIST OF FIGURES xii<br />
4.11 Study area of a residential development of 358 houses in Sarasota County,<br />
Florida <strong>and</strong> simulated storm track of Hurricane Charley of 2004. . . . . . . 90<br />
4.12 Comparison of the estimated wind damage condition of the residential de-<br />
velopment in Sarasota County, Florida, under a Hurricane Charley wind<br />
condition, by time series <strong>and</strong> maximum wind analyses. . . . . . . . . . . . . 91<br />
4.13 Comparison of subassembly <strong>and</strong> overall damage ratios between time-series<br />
<strong>and</strong> maximum-wind damage analyses. . . . . . . . . . . . . . . . . . . . . . 92<br />
5.1 Distribution of Gumbel distribution parameters λ <strong>and</strong> µ of extreme wind<br />
speed data in 129 stations over the contiguous United States. . . . . . . . . 100<br />
5.2 Two sample results of the hazard model. . . . . . . . . . . . . . . . . . . . . 101<br />
5.3 Vulnerability curves of the single-limit-state deterministic model. . . . . . . 103<br />
5.4 Mean total discounted repair cost in 36 different climate change scenarios. . 104<br />
5.5 Percentage difference in mean total discounted repair costs between 36 dif-<br />
ferent climate change scenarios <strong>and</strong> the ‘no climate change’ scenario. . . . . 105<br />
5.6 Mean total discounted repair cost in 36 different climate change scenarios. . 107<br />
5.7 Percentage difference in mean total discounted repair costs between 36 dif-<br />
ferent climate change scenarios <strong>and</strong> the ‘no climate change’ scenario. . . . . 108<br />
5.8 Ratios of the total mean discounted repair costs attributed to the uncertainty<br />
in parameters to that attributed to the mean value of parameters. . . . . . 110<br />
5.9 Ratios of the st<strong>and</strong>ard deviations of the discounted repair cost attributed<br />
to the uncertainty in parameters to that attributed to the mean value of<br />
parameters. . . . . . . . . . . . . . . . . . . . . . . . . . . . . . . . . . . . . 110<br />
5.10 Four sample simulations showing the effects of resistance deterioration in two<br />
different climate scenarios. . . . . . . . . . . . . . . . . . . . . . . . . . . . . 112<br />
5.11 Minimization of life-cycle cost in two different climate scenarios. . . . . . . 114


