Annual Report 2007
Annual Report 2007
Annual Report 2007

Create successful ePaper yourself
Turn your PDF publications into a flip-book with our unique Google optimized e-Paper software.
A n n u a l R e p o r t 2 0 0 7<br />
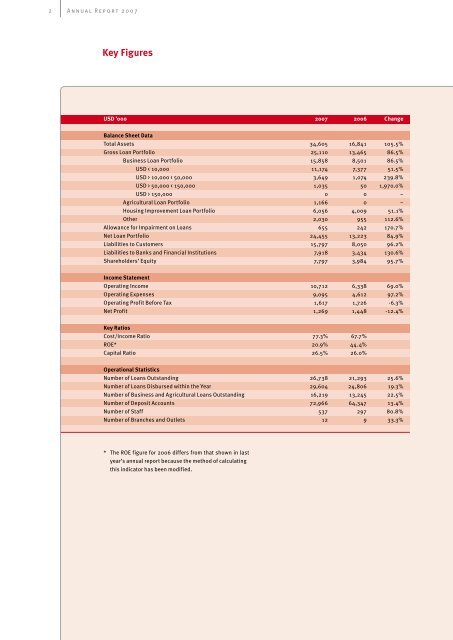
Key Figures<br />
USD ’000 <strong>2007</strong> 2006 Change<br />
Balance Sheet Data<br />
Total Assets 34,605 16,841 105.5%<br />
Gross Loan Portfolio 25,110 13,465 86.5%<br />
Business Loan Portfolio 15,858 8,501 86.5%<br />
USD < 10,000 11,174 7,377 51.5%<br />
USD > 10,000 < 50,000 3,649 1,074 239.8%<br />
USD > 50,000 < 150,000 1,035 50 1,970.0%<br />
USD > 150,000 0 0 –<br />
Agricultural Loan Portfolio 1,166 0 –<br />
Housing Improvement Loan Portfolio 6,056 4,009 51.1%<br />
Other 2,030 955 112.6%<br />
Allowance for Impairment on Loans 655 242 170.7%<br />
Net Loan Portfolio 24,455 13,223 84.9%<br />
Liabilities to Customers 15,797 8,050 96.2%<br />
Liabilities to Banks and Financial Institutions 7,918 3,434 130.6%<br />
Shareholders’ Equity 7,797 3,984 95.7%<br />
Income Statement<br />
Operating Income 10,712 6,338 69.0%<br />
Operating Expenses 9,095 4,612 97.2%<br />
Operating Profit Before Tax 1,617 1,726 -6.3%<br />
Net Profit 1,269 1,448 -12.4%<br />
Key Ratios<br />
Cost/Income Ratio 77.3% 67.7%<br />
ROE* 20.9% 44.4%<br />
Capital Ratio 26.5% 26.0%<br />
Operational Statistics<br />
Number of Loans Outstanding 26,738 21,293 25.6%<br />
Number of Loans Disbursed within the Year 29,604 24,806 19.3%<br />
Number of Business and Agricultural Loans Outstanding 16,219 13,245 22.5%<br />
Number of Deposit Accounts 72,966 64,347 13.4%<br />
Number of Staff 537 297 80.8%<br />
Number of Branches and Outlets 12 9 33.3%<br />
* The ROE figure for 2006 differs from that shown in last<br />
year’s annual report because the method of calculating<br />
this indicator has been modified.