The QCD Phase Diagram - Theory Center
The QCD Phase Diagram - Theory Center
The QCD Phase Diagram - Theory Center

You also want an ePaper? Increase the reach of your titles
YUMPU automatically turns print PDFs into web optimized ePapers that Google loves.
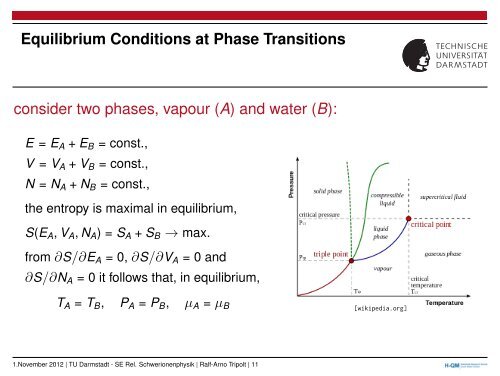
Equilibrium Conditions at <strong>Phase</strong> Transitions<br />
consider two phases, vapour (A) and water (B):<br />
E = EA + EB = const.,<br />
V = VA + VB = const.,<br />
N = NA + NB = const.,<br />
the entropy is maximal in equilibrium,<br />
S(EA, VA, NA) = SA + SB → max.<br />
from ∂S/∂EA = 0, ∂S/∂VA = 0 and<br />
∂S/∂NA = 0 it follows that, in equilibrium,<br />
TA = TB, PA = PB, µA = µB [wikipedia.org]<br />
1.November 2012 | TU Darmstadt - SE Rel. Schwerionenphysik | Ralf-Arno Tripolt | 11